 MetaTrader 5
 专家
专家
 指标
指标
 程序库
程序库
 实用工具
实用工具
 窗口小部件
窗口小部件
 规则
规则
适用于MetaTrader 4的技术指标 - 174
 下面列出的技术指标信号对MetaTrader 4平台的开仓交易和平仓交易起着至关重要的作用。
指标的本质就是一种交易品种的数学转换,旨在预测价格变化。
下面列出的技术指标信号对MetaTrader 4平台的开仓交易和平仓交易起着至关重要的作用。
指标的本质就是一种交易品种的数学转换,旨在预测价格变化。 
SMC Cheat Code Dashboard Trading System SMC Cheat Code Dashboard Trading System 是一款为 MetaTrader 4 打造的专业级机构市场结构指标。专为 Smart Money Concepts(SMC)和 ICT 交易者设计,该工具能够自动识别高概率结构突破、关键流动性区域以及多时间框架之间的动态订单流一致性,从而减少图表杂乱和主观分析。 无论您采用剥头皮交易、日内交易还是波段交易策略, SMC Cheat Code 都可以作为实时多品种扫描器,过滤低概率市场噪音,并实时突出显示关键市场结构的汇合区域。 核心功能与运行机制 1. 多品种 SMC Dashboard — 实时扫描器 实时跨品种扫描: 在单一图表窗口中监控您关注的交易品种(EURUSD、GBPUSD、AUDUSD、USDJPY、USDCAD 等)的市场结构一致性。 高时间框架(HTF)与低时间框架(LTF)矩阵: 自动评估关键 SMC 共振条件: H1 vs. D1 — 高时间框架趋势一致性。 M15 vs. H4 — 日内交易结构一致性。 M

StructuraX Non-repainting market structure analysis with a mechanical bias score, optional higher-timeframe context, key levels, and risk-based reference calculations. Overview StructuraX is a rule-based market structure indicator designed to turn price action into a structured analytical framework. It analyses the current chart timeframe for: Market structure: HH/HL and LH/LL Confirmed Break of Structure (BOS) Dominant impulse and retracement depth Momentum thrust Compression Key structural zon

HIZOA Volume Reversal Flow
Volume Pressure, Reversal Development and Directional Confirmation
HIZOA Volume Reversal Flow is an analytical volume oscillator designed to visualise bullish and bearish pressure, identify developing volume reversals and reduce distracting counter-flow noise during clearer directional conditions.
Instead of treating every opposing volume bar as equally meaningful, the indicator evaluates volume intensity, directional flow, price behaviour and multi-stage follow-thr

UNIFIED FX — 统一外汇分析系统 多个工具。一个统一系统。 UNIFIED FX 将多种核心外汇分析工具整合到一个统一指标中,让交易者能够以更简洁、更清晰、更有条理的方式分析市场。 无需在多个指标之间频繁切换,也无需让交易图表充满各种独立工具。 UNIFIED FX 将关键技术分析工具整合到一个精简而统一的系统中。 内置分析工具 移动平均线(MA) — 帮助识别趋势方向以及动态价格水平。 MACD — 用于分析市场动能并确认趋势。 RSI — 帮助分析市场动能,以及识别超买和超卖区域。 布林带(BB) — 提供市场波动性以及价格位置方面的参考。 随机指标(Stoch) — 帮助分析市场动能和潜在反转区域。 更多功能,即将推出 这只是开始。 UNIFIED FX 被设计为一个 持续发展的外汇分析系统 。随着开发不断推进,未来更新将加入更多指标、分析工具和功能。 我们的目标,是逐步将更多实用的市场分析工具整合到 一个统一的分析环境 中。 首发优惠价格 — $40 目前, UNIFIED FX 面向早期购买者提供 $40 的首发优惠价格 。 随着更多指标、工具和功能不断加入,系统也

Moonshine Pivot Trend is a trend indicator for MT4 and MT5 whose trailing stop sits still for days at a time. On gold H1 it produced 153 signals in four and a half years, about 33 a year. If that sounds low, that's the argument I want to make before you look at a screenshot and decide something is broken. Most ATR trend tools centre their band on the current candle, so every new bar moves the anchor and a quiet stretch nudges you out of a trend that never broke. This one anchors to confirmed swi

QCL Clouds for MetaTrader 4 is an adaptive market-regime indicator designed to display trend direction, momentum transitions, and dynamic price zones in a clean and practical format. The indicator combines its internal calculations into color-changing signal-line segments, crossover dots, and a projected market cloud. The simplified presentation helps traders identify directional changes without placing multiple overlapping lines on the chart. HOW TO READ QCL CLOUDS • Blue Signal Line
Indicates

SMC Structure Suite - 无需手动绘制的市场结构解读
SMC Structure Suite 标记聪明钱方法所依赖的价格行为要素,并在每根 K 线上保持更新。摆动点标签、结构突破、订单块、价格失衡和流动性扫荡全部来自同一个摆动点引擎,因此整体画面始终内部一致,不会像手工绘制的水平线那样逐渐偏离。
所有对象都锚定在时间和价格坐标上,因此当你切换周期、缩放或滚动图表时,区域仍停留在原来的位置。
图表上标记了什么
摆动点标签。交替出现的摆动高点和低点,在两侧形成可配置数量的 K 线后才被确认,然后与同类型的前一个摆动点比较,标注为 HH、HL、LH 或 LL。绝不会用未完成的 K 线标记摆动点。
结构突破。当某根蜡烛在当前偏向方向上收于最近确认的摆动点之外时,该水平被绘制并标记为结构突破。这是延续,不是反转。
性质改变。当收盘价逆着当前偏向突破最近确认的摆动点时,会被标记为性质改变。这是控制权可能易手的第一个结构性证据,用单独的颜色绘制,因此绝不会与延续混淆。
订单块。结构突破之后,工具会回溯到脉冲行情之前最后一根反向蜡烛,并将其标记为订单块。影线进入区域视

Daily Open Levels With Buy Sell Signal is a professional trend-following indicator based on the daily opening price.
HOW IT WORKS: The market's true daily bias is determined by the daily open. If price is above the daily open, the bias is BUY. If below, the bias is SELL.
FEATURES: - Solid Line: Today's Daily Open Price (D0) - Main Intraday Support/Resistance - Dashed Lines: Previous 5 Days Open Prices (D-1 to D-5) - Historical Key Levels - The levels are automatically drawn as horizontal line

Take the guesswork out of price action trading. The Dynamic Breakout Channel Pro is an institutional-grade, real-time indicator designed to isolate genuine market structure and shield retail accounts from toxic sideways consolidation traps.
By actively scanning historical candle data on every single market tick, this powerful utility visually maps the exact price boundaries where heavy institutional order blocks are waiting to burst.
Core Features: - Fully Customizable Lookback Engine: Adju

MQL5 博客 = https://www.mql5.com/en/blogs/post/776258 MT4 版本 = https://www.mql5.com/en/market/product/197233 MT5 版本 = https://www.mql5.com/en/market/product/197234
VWAP PROFILE [tambangEA] 是一款基于交易时段(Session)的高级 VWAP(成交量加权平均价)与市场轮廓(Market Profile)指标,旨在帮助交易者直接在图表上识别公允价值、统计学上的极端价格、潜在的均值回归机会以及重要的价值区域。
该指标将时段 VWAP、偏差带、价格轮廓分析、控制点 (POC)、拒绝信号、确认逻辑以及交互式多品种仪表板整合在一个统一的交易工作区中。
它专为寻求结构化方法的交易者设计,用于评估价格是处于公允价值附近、出现统计学上的过度延伸,还是显示出从极端区域反转(拒绝)的迹象。
核心功能 时段 VWAP (Session VWAP)
中心 VWAP 线代表当前交易时段内成交量加权的公允价值。
该指标

Binary God BUY / SELL Signal Indicator with Built-in Win Rate Tracking Binary God is an indicator for MetaTrader 5 designed to help identify and filter BUY and SELL opportunities based on candlestick structure . One of the key features of Binary God v is that it does not display every detected signal. Instead, it filters and displays only the signals that meet the specific conditions of the COUNTER 1 / COUNTER 2 systems. This allows traders to monitor WIN / LOSS results, Win Rate, MAX WIN, and

Arrow Master
是 MetaTrader 4 主图指标,用三层彩色带显示趋势方向,并可显示买卖箭头。 色带采用类似 HalfTrend 的翻转逻辑:对最高价和最低价按 Arrow Pulse 周期做均线,并用 Arrow Shield 作为价格缓冲。满足翻转条件后,色带变色,并可画出箭头。同一逻辑用于当前周期和多周期面板。 图表功能: 三条不同粗细的彩色趋势线 可选向上/向下箭头 可选 ATR 入场、止盈、止损区域(仅当前信号;价格触及 TP 或 SL 后删除) 可选面板:当前状态、信号价格与时间、当前趋势持续根数、M15 / H1 / H4 / D1 趋势,以及四周期多空比例条 可选提醒:终端警报、声音、邮件、推送 主要参数:DrawArrow、ArrowPulse、ArrowShield;提醒组;ShowDashboard 及位置/缩放;ShowATRZones、ATR_SLMultiplier、ATR_RiskReward。 本产品仅用于图表分析,不下单,不保证收益。历史信号不代表未来表现。请仅使用可承受风险的资金,并遵循自有交易规则。 支持与社群: 官方 MQL5 群

AutoPivot FXAIEA —— 一眼看清当天支撑阻力的枢轴点指标 做日内交易,最耗神的不是找形态,而是回答一个最基础的问题: 今天价格在什么位置会受阻、在哪里有支撑、哪条线才是真正的关键位。 AutoPivot FXAIEA 把这件事变成了看图就能答:每一天自动画出枢轴中轴 P 与上下各四层阻力 R1–R4、支撑 S1–S4,价格走到哪一层、离哪条线还有多少空间,抬眼就知道。 用它看盘,你能直接得到什么 一眼分清"现在处在什么位置" 中轴 P 就是当天多空的分水岭。价格在 P 上方,说明买方占优,回踩 P 不破就是顺势做多的位置;跌回 P 下方,说明卖方接管,反抽 P 站不上去就是空的思路。不用再自己翻昨天的开高低去算。 提前知道下一目标位在哪 价格突破 R1,下一个目标就是 R2,再上是 R3——每一层的距离在图上是等距展开的,推进节奏一目了然。做突破单时,止盈放在哪一层、还剩多少空间,事前就能算清楚,不用边走边猜。 支撑阻力变成明确的进出场依据 回踩 S1 企稳可考虑接多,跌破 S1 就看 S2;反弹到 R1 滞涨可考虑减仓,站稳 R1 再追 R2。每条线都有实际意义,止损

Crypto_Forex 指标“WPR 平缓探测器”是一款高效的交易辅助工具!无需重绘。 我推荐您使用这款适用于 MT4 的出色指标来升级您的交易方法。 - 指标在图表上显示价格平缓区域。它具有“平缓敏感度”参数,用于平缓检测。 - “WPR 平缓探测器”可用于价格行动入场确认,或与其他指标结合使用。 - 您可以将其用于趋势跟踪系统,以检测平缓区域并避免在该区域交易。 - 您可以将其用于反转剥头皮交易 - 从平缓区域进行反转交易。 - 有很多机会可以使用“WPR 平缓探测器”替代标准 WPR 振荡器。 - WPR 本身是快速剥头皮交易的最佳振荡器之一。 - 非常适合在超买区域(高于 -20)进行卖出入场,在超卖区域(低于 -80)进行买入入场。 Click here to see high quality Trading Robots and Indicators! 这是仅在 MQL5 网站上提供的原创产品。

This indicator is based on the RTM trading method by studying and trading with it on the real market carefully. please after purchasing the indicator send me a message to give you the user guide lines.
RTM Indicator finds the price-action zones that supply-and-demand traders mark by hand and keeps them up to date on every closed bar. It is built on the ZoneReader Pro zone engine and is supplied here as a MetaTrader 5 indicator.
Zones The indicator scans the chart (or a higher timeframe of your c

Adaptive Price Action Engine 买指标,免费送EA 自适应多时间框架趋势与K线形态智能分析系统 市场环境始终在变化,不同的市场阶段中,并非所有 Price Action 形态都具有相同的参考价值。 Adaptive Price Action Engine 旨在适应不断变化的市场条件,将 趋势结构、多时间框架分析、K线形态与统计优化 整合到一个统一的分析框架中。 两种自适应模式 Dual Alpha Trend Mode(双 Alpha Trend 模式)
自动搜索适合的 Alpha Trend 参数,并结合低周期与高周期市场结构,使指标能够根据近期市场行为动态调整趋势识别。 Candlestick + Alpha Mode(K线 + Alpha 模式)
将 Alpha Trend 市场状态与 22种多空K线形态 相结合。系统不会简单地对所有形态一视同仁,而是对不同的形态组合进行统计评估,并识别在特定市场环境下表现出更强历史统计特征的配置。 主要功能 趋势参数自动优化 多时间框架市场状态分析 22种多头与空头 Price Action K线形态 对数千种可能

RelicusRoad 是适用于 MetaTrader 4 和 MetaTrader 5 的流动性价位指标,围绕一条中线绘制一组基于波动率的价位通道,让你一眼看出价格是接近近期均值,还是已经伸展到该设定目标位与止损位的边缘。 中线是近期价格的加权均值。上方是三条 Sell 价位,下方是三条 Buy 价位,每一条都比前一条再远一个固定步长,因此只有当价格已经远离均值时,才会到达最外侧的线。 每条线告诉你什么 标记为 Safe Close 的 Neutral 线:近期价格的平衡点;交易回到这里,算是完成了它份内的普通任务。 标记为 TP/SL-1 的 Level 1:一次摆动的正常幅度;在趋势中,价格常常沿趋势一侧贴着这条线运行。 标记为 TP/SL-2 的 Level 2:价格已经伸展;可以在这里落袋部分仓位或收紧止损。 标记为 TP/SL-3 的 Level 3:极值位置;把它当作当前交易的目标位,而不是在同方向开新仓的地方。 上下带宽不对称:上下两侧分别测量,因此一轮强劲上涨之后,上方的带宽往往扩张得更多。 在通道内交易 在边缘反向交易:价格到达 Level 2 或 Level 3

Most ATR trend tools can't tell you in advance where the trend flips. The band is built from the midpoint of the bar you're standing on, so the level that would turn it slides while that bar prints. You can't place an order against a moving line. Chandelier Structure Pro tests the close against the previous bar's stop. The number you read at 09:00 is the number that decides 09:59. On 57,540 hourly gold bars back to January 2014 it flipped 829 times on default settings, about one signal every 69

VWAP Sniper Reversal Pro v3.00
MT4 Mean-Reversion Indicator — Rolling VWAP, Dual-Layer ATR Bands, Volume Exhaustion, RSI Gate & Confirmation Modes VWAP Sniper Reversal Pro identifies potential mean-reversion setups at statistical price extremes. It combines a rolling volume-weighted average price (VWAP) baseline, dual-layer ATR deviation bands, volume and wick exhaustion filters, and an RSI gate to confirm reversal signals on completed bars. Built for traders who want multi-factor confluence ra

HurstCyclicSignorinPro
HurstCyclicSignorinPro is an advanced, institutional-grade technical analysis indicator designed for MetaTrader 4 (MT4). It bridges the gap between classic mathematical market theory and modern algorithmic trade execution. By combining Hurst Exponent (R/S Analysis) with a Dominant Cycle Autocorrelation Engine and the proprietary Signorin Entry Engine , this indicator dynamically adapts to shifting market regimes—identifying whether an asset is trending, mean-reverting, or

INSTITUTIONAL ORDERBLOCK MAPPER — THE ULTIMATE SMART MONEY SUPPLY & DEMAND MATRIX
Stop trading blind retail indicators that repaint and lag. To achieve consistent profitability, you must trace market structure exactly where commercial banks and institutional algorithms place their resting block orders.
The 'Institutional OrderBlock Mapper' is a heavy-duty, professional-grade visual mapping engine for MetaTrader 4 that instantly isolates, projects, and locks high-probability Supply and Dem

NuStar Navigator MT4
Overview NuStar Navigator MT4 is a non-repainting, complete trading system for any instrument (market). It guides you through when to enter, when to hold and when to exit your trade with realtime on screen visual guidance. NuStar Navigator MT4 uses an institutional trend following system that monitors OHLC candle prices to predict the NEXT 4 BARS using probability. It compares previous candle patterns to the current setup to determine where the market may go next. It

Graded Cross Signals is an EMA crossover indicator for MT4 and MT5 that doesn't try very hard to throw signals away. On 57,562 hourly gold bars back to January 2014 it saw 1,759 crossovers and took 1,544 of them. What it does instead is tell you, on every arrow, how much of the chart agreed with that cross when the bar closed. Then it runs each entry as a trade with a stop, three targets and a scorecard in R. Graded Cross Signals vs a plain EMA crossover What a crossover entry needs What a plain

WaveForce Structure is a manual market-structure toolkit built around the impulse–correction–impulse logic. Core idea
You mark three structure points. The indicator helps you formalize the markup, zones, and working levels. It does not replace your decision with automatic buy/sell calls. Panel features 1-2-3 markup
Place structure points, lines, and labels. Suitable for impulse sequences and for reading corrective formations. Zones
Zones between key legs of the markup with adjustable fill. Usefu

See the Dow Theory direction of six timeframes in one panel. DowgatorPro2 judges the current trend direction (up or down) automatically by Dow Theory, using closed bars only. It carries over the features of the earlier e-DowgatorPro and puts first that even a beginner can read the direction without confusion. The direction of six timeframes (M1 to D1) is shown on the panel in color. Features Check direction mismatch: see on the panel whether your chart's timeframe agrees with the higher timefram

Volmark – important levels. Clear chart. Are there many lines on the chart, but it's unclear which ones to focus on? Do you have to re-search for reference points every day, manually mark levels, and switch between multiple instruments? Volmark for MetaTrader 5 brings together market activity levels, historical benchmarks, profile, and VWAP in a single interface. It helps you focus on what matters most: where the price is and how it behaves around the marked areas. Less manual marking means more

The Walter White Signal Indicator is a powerful trading tool developed for MetaTrader 4 (MT4), designed to optimize your trading decisions with three distinct signaling modes: Trend, Pullback, and Breakout. Each signal mode is visually differentiated with unique on-chart icons for quick and effortless market reading. It features clear graphical projections for Stop Loss (SL) and Take Profit (TP) levels directly on the chart, streamlining risk management. While fully compatible with all MT4 tradi

对于使用网格交易系统的交易者来说,这绝对是必备指标!!! - 相对回撤专业显示指标以百分比显示您账户当前的相对回撤或浮动盈利。 - 内置 PC 和移动端提醒,触发级别可调。 - 它显示与其关联的外汇对的当前点差和隔夜利息。 - 指标还显示账户余额、账户净值和保证金。 - 指标值可在图表任意位置显示 . - 还可以设置颜色和字体大小。 - 使用相对回撤显示,交易者无需再使用计算器。 ............................................................................. Click here to see high quality Trading Robots and Indicators! 这是仅在 MQL5 网站上提供的原创产品。

Obaforex Three Phase Map maps the master pattern (forex master pattern) market cycle on any chart similar to the Action Threshold Software (ATS): contraction (range), expansion and trend , the three phases every market repeats. It draws the contraction boxes, the average price (value) line, numbered expansion legs, liquidity lines and projected targets, with a higher-timeframe panel. It works on forex, gold, indices and crypto, on any timeframe, and does not repaint. It shows yo
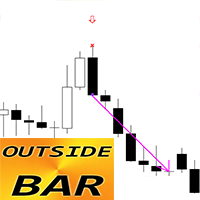
Crypto_Forex MT4 OUTSIDE 柱状图指标,无需重绘,无延迟。 - “OUTSIDE 柱状图”指标是一款非常强大的价格行为交易指标。 - 指标可检测图表上的 OUTSIDE 柱状图: - 看涨 OUTSIDE 柱状图 - 图表上显示蓝色箭头信号(见图)。 - 看跌 OUTSIDE 柱状图 - 图表上显示红色箭头信号(见图)。 - 提供 PC、手机和电子邮件提醒。 - “OUTSIDE 柱状图”指标非常适合与支撑/阻力位结合使用。 ............................................................................. Click here to see high quality Trading Robots and Indicators! 这是一款仅在 MQL5 网站上提供的原创产品。

The levels of higher timeframes, on the chart you are watching. LineTraderPro2 finds swing highs and lows with Dow Theory rules and draws horizontal lines at the levels the market watches, for any of 20 timeframes from M1 to W1. Each line is labeled with its timeframe (H1, D1 and so on) and the date of the swing, so you can see at a glance which timeframe a level belongs to without switching charts. What you see on the chart Horizontal lines: the swing highs above the price and the swing lows be

Stop Run 是适用于 MT4 和 MT5 的独立流动性扫荡与止损猎杀指标。当价格的影线突破前一个摆动高点或低点,并在该水平内收盘时,指标会标记该 K 线。这类拒绝通常被称为止损猎杀或流动性抓取回落。
看涨 SR 信号:扫过前一个摆动低点后重新收回该水平。看跌 SR 信号:扫过前一个摆动高点后重新收回该水平。影线拒绝阈值可以调整,默认约为 K 线总区间的 25%。
指标可显示箭头、SR 文字标签和信息面板。新闭合 K 线出现信号时,可启用 Alert、Push 和 Sound 通知。可调参数包括摆动强度、回看范围、历史深度、最大标记数、影线比例、颜色、显示开关和通知开关。
支持任意品种和周期。不需要 DLL,也不连接互联网。Stop Run 只是图表分析工具,永远不会交易,也不会下单、修改或关闭任何订单。

【Product Overview】 METATRADER 4 · INDICATOR Trend Contrarian How far has the current move already extended
within the broader trend?
An MT4 indicator that divides price movement into blocks of a fixed width and automatically records how many consecutive blocks have confirmed in the same direction.
It does not trade automatically. Placing orders is always down to you.
Auto-Adaptive Block width adjusts
to market conditions Continuous Tallying Shows streak-length
frequency instantly No Order

just for a limited time you can get unlimited god money maker item! discounted at 49$ after 15 sale it will go at 89
THE TRADING PANNEL IS AN EA it not come with the indicator
Smart Money Suite v1 – All-In-One Institutional SMC Toolkit for MT4 Smart Money Suite is a comprehensive, institutional-grade trading toolkit engineered for traders operating with Smart Money Concepts (SMC) and ICT methodologies. The indicator consolidates Market Structure analysis, Liquidity Mapping, Fair Value Gaps,

ReversalZones Pro — 动态日内波动率与反转点分析指标 ReversalZones Pro 是一款专为 MetaTrader 4 设计的机构级日内波动率与枢轴点预测指标。与依赖移动平均线或平滑振荡器的传统滞后指标不同,ReversalZones 根据统计日幅扩展和斐波那契区间比例,在每个交易日开盘时即可精确计算并预测供需区和均值回归区域。 无论您是针对极值过度扩张进行 均值回归交易(反转) ,还是追踪突破动能的 突破延续交易 ,ReversalZones 都能结合机构级影线过滤机制,为您提供精确且不重绘的入场信号。 核心功能与优势 无滞后预测型区域绘制: 在开盘时根据日波幅( $High_{D1} - Low_{D1}$ )及斐波那契比例(38.2%、61.8% 和 100%)自动计算并绘制当日关键位置。 机构级拒绝影线过滤: 仅当价格触及关键边界 并且 收出强力拒绝影线(可通过 InpMinWickPercent 自定义)时才会触发信号,有效过滤盘整期的伪信号。 双重策略引擎(反转与突破): 反转信号: 当价格在 38.2% 触发线或 61.8%–100% 供需框受阻

MQL5 博客: https://www.mql5.com/en/blogs/post/776450 MT4 版本: https://www.mql5.com/en/market/product/198190 MT5 版本: https://www.mql5.com/en/market/product/198191
MARKET DIRECTION [tambangEA] 是一款多层次市场分析指标,旨在将趋势方向、动能、多周期确认、供需区、市场结构、风险管理水平、交易时段、经济新闻背景以及多品种监控功能整合于一个综合仪表盘中。 该指标构建了一个结构化的决策支持环境。它不依赖单一信号,而是呈现多层信息,使交易者能够从一张图表中评估市场方向、确认信号、市场背景及风险状况。 它适用于外汇、黄金、指数、金属以及 MetaTrader 支持的其他交易品种。
主要功能 市场方向引擎 核心方向分析引擎结合了以下要素: - 基于 Heikin-Ashi(平均K线)的价格处理 - ATR 波动率标准化 - 双重 Supertrend(超级趋势)逻辑 - 快速与慢速方向分析 - 可选的突破过滤功能

Session Liquidity Confluence Pro Session Liquidity Confluence Pro is an MT4 chart-window indicator designed to map important Daily, Weekly, Monthly and trading-session High/Low levels in one place. The indicator combines multiple liquidity reference levels, merges levels that occur at the exact same price, classifies their confluence strength, and provides configurable alerts when price approaches or touches important confluence zones. This is not a trade signal generator . It is a liquidity and

CME Nexus Prime - Auction Market Theory & Volume Profile
CME Nexus Prime is an advanced analytical indicator for MetaTrader 4 combining Auction Market Theory, session volume profiling, structural reference levels, and volume participation analysis into a single interactive decision-support panel.
Note: This is an analysis tool only and does not execute trades automatically.
NEXUS RAIL INTERFACE The indicator features an interactive chart panel divided into four working sections: - LIVE: Sum

Automatic Fibonacci swing tool with one-click TP targets. Detects the main swing, inner swing and local swing, and projects TP1-TP4 from the current correction (50 / 61.8 / 75 / 100%). Auto Fibo Swing Target is an automatic Fibonacci tool that measures market swings for you and projects clear Take Profit targets from the current correction. No more dragging Fibonacci lines by hand - one click and the levels are on the chart, updated in real time as price develops.
HOW IT WORKS
The indicator fi

The Ultimate Institutional Liquidity & Order Block Suite for MetaTrader 4 (中文译名:MetaTrader 4 终极机构流动性与订单块套件) 使用 OB Finder 将您的交易提升至机构级别。这是一款基于 Smart Money Concepts (SMC) 聪明的钱概念的跨周期指标,旨在实时精准定位真正的机构订单块 (Order Blocks / OB) 和失衡区/公平价值缺口 (Fair Value Gaps / FVG)。 通过数学位移 (Displacement) 计算、机构强度算法以及多周期嵌套检测技术,OB Finder 能过滤市场噪音,直接在图表中呈现高概率的供求区域。 为什么每位交易者都需要这款工具 1. 自动多品种切换器(交互式 GUI 面板) 无需再频繁切换工作区标签或让多个窗口堵塞图表。OB Finder 内置美观、可自定义的图表控制面板,只需轻轻一点,即可在常用品种(EURUSD、GBPUSD、XAUUSD、BTCUSD 等)之间瞬间切换。 2. 机构位移过滤器(拒绝假突破) 并非价格暴

AE SMC Zones Signal Pro marks the footprints of big money on your chart: Fair Value Gaps , Order Blocks and Breaker Blocks . It shows an arrow only when price actually reacts to a zone with a false breakout, a pin bar or a pivot reversal. FVG + Order Block + Breaker in one tool Arrows on closed candles Higher-TF zones on your working chart D1 trend filter Alert / Push / Email Signals for EAs All my products · Message me after purchase for setup help and a ready template Built on S
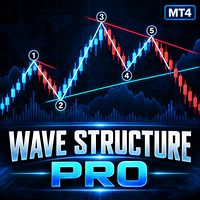
Wave Structure Pro is a technical analysis indicator for MetaTrader 4 designed to help traders identify market swings, wave structures, trend direction, dynamic trendlines and potential target levels directly on the chart. The indicator automatically analyzes price movement and presents the market structure in a clear visual format. It can be used on Forex, Gold, Indices, Commodities and other symbols available in MetaTrader 4. MAIN FEATURES • Automatic wave structure detection
• Automatic wave

AMD Nexus Prime - Market Structure & Liquidity Indicator
AMD Nexus Prime is a professional market structure indicator for MetaTrader designed to identify and visualize Accumulation, Manipulation, and Distribution (AMD) sequences directly on the chart.
The indicator processes confirmed bars, tracks range development, detects liquidity sweeps, and builds a reference trade model when a Distribution phase is confirmed.
Note: This is an analysis tool only. It does not open, modify, or close trad

MQL5 博客: https://www.mql5.com/en/blogs/post/776607 MT4 版本: https://www.mql5.com/en/market/product/198437 MT5 版本: https://www.mql5.com/en/market/product/198438
GRAVITY MAGNET [tambangEA] 是一款先进的市场结构与流动性吸引力指标,旨在帮助交易者识别价格的潜在吸引方向,并评估多空双方流动性力量的强弱对比。 该指标不依赖单一的趋势信号,而是分析多种结构性流动性来源,并根据强度、距离、时效性、市场形态及趋势背景对它们进行排序,最终将结果转化为直观易读的“市场引力”(Market Gravity)框架。 本指标定位为决策辅助工具,而非价格预测引擎。引力数值反映的是相对的市场吸引力与压力,而非未来价格走势的统计概率。 核心概念 金融市场的价格走势往往倾向于向流动性集中的区域移动。 Gravity Magnet 能够识别并排列这些区域,将其视为潜在的“流动性磁极”(Liquidity Magnets),包括: -

WaveForce Mark is a panel indicator for manual chart markup and quick access to trading rules inside MetaTrader. Purpose
When market structure is already clear, you still need clean lines, labels, and a short checklist of rules. Mark keeps markup tools and text cards in one panel so you do not leave the chart. What you get Markup tab
Tools for drawing lines on the chart in a consistent panel style. Cleanup actions help you remove objects and keep the chart readable. Wave logic tab
Labels and hel

Ichi Nexus Prime - Adaptive Ichimoku Analysis for MT4
Ichi Nexus Prime is an advanced analytical indicator that combines the traditional Ichimoku framework with adaptive market calculations, multi-timeframe context, and structured risk visualization in one clean workspace.
Note: This is an analysis-only indicator and does not trade automatically.
CORE ENGINE The indicator operates in two calculation modes: - Classic Mode: Uses traditional, fixed Ichimoku periods. - Adaptive Mode: Dynamically

Nasdaq Signal Pro with Auto TP SL — MT4 入场、止盈目标、止损参考:在同一张图表上查看纳斯达克交易信息。 Nasdaq Signal Pro 是用于 MT4 的自主交易辅助指标,适用于纳斯达克100现金指数差价合约(CFD)。它在 M5、M15 图表上显示 BUY/SELL 候选信号、参考入场价、止盈(TP)和止损(SL)。蓝色面板将信号、市场状态和参考价格集中展示,方便下单前检查。 本页面为 MT4 版,MT5 版单独销售。本产品是指标,不会自动下单、平仓或修改订单。 查看 MT5 版 永久许可证购买者专享赠品 购买永久许可证,即可免费获得 AI Zone Radar(MT5版)。这是一款独立指标,可显示支撑/阻力区域及其参考强度评分,帮助查看附近的重要价格区域。 购买后,请通过 MQL5 站内消息向作者发送“AI Zone Radar bonus”申请。核实购买记录后,将提供领取说明。仅永久许可证购买者符合条件,租赁不包含赠品。赠品仅支持 MT5;即使购买的是 Nasdaq MT4 版,使用赠品也需要 MT5。 查看 AI Zone Rada

Hull Structure Pulse - Momentum & Market Structure System
Hull Structure Pulse is an analytical trading system that combines momentum (Hull Moving Average) with market structure (BOS and CHoCH). It provides 100% non-repainting signals, a multi-layered qualification engine, and an on-chart control panel.
SYSTEM OVERVIEW The indicator evaluates structural breakouts through a Qualification Engine. Signals are confirmed only when price meets strict criteria for momentum, volume, and targets. Mark

Crypto_Forex 指标“CCI 带动态超卖/超买区域”,适用于 MT4,无需重绘。 - 商品通道指数 (CCI) 非常适合顺势交易,顺势而为。 - 非常适合在动态超买区域设置卖出入场点,并在动态超卖区域设置买入入场点,顺势而为。 - 此指标也非常适合与价格行动入场点结合使用。 - 动态超买区域 - 黄线上方。 - 动态超卖区域 - 蓝线下方。 - CCI 震荡指标用于测量当前价格与历史平均价格之间的差额。 - 提供 PC 和移动端提醒。 ............................................................................. Click here to see high quality Trading Robots and Indicators! 本产品为原创产品,仅在 MQL5 网站上提供。

适用于 MT4 平台的加密货币/外汇“TREND Histogram”(趋势直方图)指标,无重绘(不闪烁)。 - “TREND Histogram”指标比任何标准的移动平均线(MA)交叉信号都更灵敏、更高效。 - 该指标包含两种颜色:黄色(金色)代表看跌趋势,绿色代表看涨趋势(颜色可在设置中更改)。 - “TREND Histogram”内置了移动端和电脑端提醒功能。 - 建议将此指标与其他交易方法(如价格行为/Price Action、VSA、其他指标等)结合使用。 - 该直方图指标是结合了价格与成交量数据并将其转化为单一数值的顶级指标之一。 Click here to see high quality Trading Robots and Indicators! 这是仅在 MQL5 网站上提供的原创产品。

TradeInfo Heatmap Edition es una herramienta profesional de análisis visual para MetaTrader 4, diseñada para transformar el seguimiento de tu rendimiento en una experiencia clara, rápida e intuitiva.
A diferencia de los informes tradicionales, este indicador consolida todo tu historial de trading en un panel gráfico dinámico directamente en tu gráfico, eliminando la necesidad de exportar datos a Excel o plataformas externas.
Funcionalidades Principales: • Matriz de Rendimiento Anual y Mensual

面向 MT4 的完整 Smart Money Concepts(聪明钱概念)工作台:市场结构(BoS/CHoCH)、带汇合评分的 Liquidity Engine、FVG/Order Blocks、成交量分布、多周期背景,以及图表上的简报——适用于任何品种。 SMC Master Structure 将原始价格转化为对市场结构与流动性的清晰、基于规则的解读。它标记 Smart Money Concepts 交易者关注的摆动、结构突破与失衡,为每个设置按汇合度评分,并将整体画面整齐地保留在一张图表上——让你把时间花在决策上,而不是画图上。 功能 市场结构,自动完成。更高的高点 / 更高的低点、Break of Structure(BoS)和 Change of Character(CHoCH)在K线收盘时被检测并标注,活跃的结构性水平始终可见。 带汇合评分的 Liquidity Engine(A / B)。两类设置族——Sweep -> CHoCH -> FVG(反转)与 BoS -> FVG(延续)——先通过前置条件闸门,再依据汇合模型评分(高周期一致性、扫荡与突破力度、FVG 质量

ELLIOT NEXUS PRIME - Professional Multi-Degree Elliott Wave Analysis for MT4
Elliot Nexus Prime is an advanced Elliott Wave analytical indicator for MetaTrader 4, developed to transform complex wave structure into a clear, structured and actionable market map.
The indicator combines multi-degree Elliott Wave inference, structural analysis, Fibonacci projections, Primary/Alternate scenarios, market structure and two independent analytical signal frameworks inside one professional chart interfa

Crypto_Forex MT4 版“锤子线和射击之星”指标,无需重绘,无延迟。 - “锤子线和射击之星”指标是价格行为交易的强大指标。 - 指标可检测图表上的看涨锤子线和看跌射击之星形态: - 看涨锤子线 - 图表上显示蓝色箭头信号(见图)。 - 看跌射击之星 - 图表上显示红色箭头信号(见图)。 - 提供 PC、手机和电子邮件提醒。 - “锤子线和射击之星”指标非常适合与支撑/阻力位结合使用。 ............................................................................. Click here to see high quality Trading Robots and Indicators! 这是仅在 MQL5 网站上提供的原创产品。

Gann Pulse 是一款适用于 MetaTrader 4 的无重绘趋势信号指标。K线收盘时,它会显示清晰的买入(BUY)或卖出(SELL)箭头,并立即绘制入场价、止损和三个止盈位。无需任何理论知识:将指标加载到图表上,跟随信号即可。 理念 W. D. 江恩的经典规则中有两条:"永远不要逆势交易"和"每笔交易都要用止损保护"。Gann Pulse 同时遵循这两条规则。其专有的动量引擎能识别市场"脉搏"转向新方向的时刻,每个信号都附带完整的交易计划。 主要功能 - 买入和卖出箭头在K线收盘时确定,永不重绘、移动或消失。 - 当前信号的入场、止损、TP1、TP2 和 TP3 线。已到达的价位会在图表上标记。 - 历史方框:每个历史信号都以风险/收益方框显示,并标注以点数计的结果,让您在交易前就能在自己的图表上评估信号。 - 面板:当前信号及其持续时间、各价位、以点数和 R 计的浮动盈亏、M5、M15、M30、H1、H4 和 D1 的方向,以及最近 180 天的统计。 - 提醒:每个新信号都会发出弹窗、声音、手机推送和电子邮件提醒;到达 TP1、TP2、TP3 或止损时也会提醒。 - 适用

**Know exactly where your grid or martingale basket blows up – before you trade it.**
Grid and Martingale Risk Simulator is a visual what-if tool for traders who use grids, martingale, averaging or hedged baskets. Place virtual BUY and SELL orders directly on the chart, drag them to any price, and the indicator recalculates your simulated account in real time: Balance, Equity, Margin, Free Margin, Margin Level, the Margin Call price and the Stop Out price.
The indicator never opens, modifies

Gaps 会在您交易的任何图表上绘制更高周期留下的价位。地图来自经纪商的日线K线,因此 1 分钟图和 4 小时图会在相同位置显示相同的价位。 四类价位,基于月线、周线和日线K线 公允价值缺口、影线区、失衡区和重叠区,各自以区域形式绘制在您的图表上。 价位只来自已收盘的K线,绝不会回溯重绘。 月线、周线和日线价位保持清晰的层级,让图表始终易读。 每个区域和开盘缺口内都有子价位,可以关闭。 可设置您想看到的最小区域。 开盘缺口、流动性与最高高点 周开盘缺口和日开盘缺口,附带价格和距离。已回补的缺口标记为 FILLED 并保留在地图上。每一项都可以单独开关。 等高点和等低点,并显示上方和下方最近的未触及流动性池。 您的终端所保存历史中的最高高点,以线和卡片显示。 最近一个日线收盘价上下最近价位之间的预测区间,附带四分线。在任何图表周期上都相同。 以实时价格读数 面板显示已绘制的内容(M / W / D)、下方和上方最近的价位及其刻度条和带正负号的距离、开盘缺口、流动性池以及最高高点。 图表右侧边距中的价格轨(Ladder)承载所有标签。屏幕上的每个区域和每个开盘缺口都会在价格轨边缘获得一条竖

BBMA REENTRY — SNR + DOTLINE + FIBO MUSANG 1. Tentukan Arah Trend Pastikan setup Reentry yang dicari searah dengan Trend Filter pada Panel . Utamakan BUY saat trend bullish dan SELL saat trend bearish . Hindari Reentry yang berlawanan dengan trend utama. 2. Cari Reentry pada Time Frame Besar Cari titik BBMA Reentry ketika candle masuk atau menyentuh area MA5/10 High atau MA5/10 Low . Time Frame besar menjadi acuan utama untuk menentukan area Reentry. 3. Gunakan Time Frame Konfirmasi yang Lebi

MT4 凯利公式风险管理面板
一款基于凯利公式的仓位计算与风险审计工具。读取当前品种的已平仓历史,计算真实胜率与盈亏比,转化为三个可执行数字:最多可开多少手、止损能放多宽、当前实际承担多少风险。只显示,不下单。
面板显示内容
【历史交易统计】 当前胜率、当前败率(带胜/负场次) 盈亏比(平均盈利 ÷ 平均亏损) 统计样本、样本参考度(不足/低/中/高)
【止损设置】 计算方式(历史平均 / 固定设置) 历史平均亏损距离(双单位:价格 + 点数) 历史平均盈亏比(带平均盈利/亏损金额) 应用止损距离、止盈目标倍数
【账户风险信息】 账户余额、账户净值 凯利风险比例、建议风险资金(含占净值百分比)
【当前交易建议】 风险上限手数(可开低于此值,附算式) 多单/空单:持仓手数、均价、参考止损、参考止盈 当前持仓风险(按真实止损价计算,净敞口) 极限风险(多空叠加,最坏情况) 还可承受止损(按当前持仓总手数计算剩余点数) 温馨提示:重仓猛干,迟早完蛋。

适用于 MT4 的 Crypto_Forex MACD 信号 METER 指标。 - 非常实用的 MACD 信号 METER 指标可同时显示 7 个时间框架的当前 MACD 值(高于/低于信号线)。 - 绿色矩形 - MACD 位于信号线上方。 - 红色矩形 - MACD 位于信号线下方。 - 外汇 MACD 信号 METER 指标可用作多时间框架交易系统的交易入场过滤器。 ............................................................................. Click here to see high quality Trading Robots and Indicators! 这是仅在 MQL5 网站上提供的原创产品。

SMC Scanner – User Guide
Overview
SMC Scanner is a multi-symbol, multi-timeframe dashboard for MetaTrader 5. Every cell shows the key Smart Money Concepts state of one symbol on one timeframe. You can scan the whole market at a glance instead of opening every chart.
The SMC engine inside the scanner uses the same calculation logic as the Smart Market Structure Concepts chart indicator. With the same settings, each cell shows what the chart indicator would show on that symbol and timeframe.

See the market's fear level on the chart you trade. VixChecker shows the VIX (the volatility index often called the fear index) in a sub-window as one bar per day, colored by level: normal (blue), caution (yellow, 20 or above by default) and fear (red, 30 or above). The current value, the change from the previous close and the time of the value are shown in a small panel, and the value can also be shown on the main chart. Where the VIX values come from (please read before buying) The indicator d

MQL5 博客: https://www.mql5.com/en/blogs/post/776740 MT4 版本: https://www.mql5.com/en/market/product/199000 MT5 版本: https://www.mql5.com/en/market/product/199001
SUPPORT RESISTANCE PROFILE [tambangEA] 是一款先进的市场结构指标,旨在结合价格结构、成交量分布(Volume Profile)分析、波动率、价格拒绝行为以及水平位相互作用统计数据,来识别、评估并排列动态支撑位和阻力位。 与仅依赖摆动高点(swing highs)和摆动低点(swing lows)的传统支撑阻力指标不同,SUPPORT RESISTANCE PROFILE 增加了一个基于分布形态(profile)的验证层,有助于区分普通枢轴点与潜在的、更具市场意义的反应区域。 该指标被设计为一种市场环境与水平位分析工具,帮助交易者解答一个重要问题: 市场在何处最可能出现反应、价格拒绝、盘整或突破? 它适用于外汇、黄金、指数、大宗商品以

Round numbers on your chart, and a notice when the price gets close. RoundNumberAlert draws horizontal lines at round numbers (150.000, 150.500 ...) and watches them for you. When the price enters the touch range, only that line blinks and you get one notification. Major round numbers stand out in gold, and a small panel shows how many pips are left to the next round number above and below. Features Round-number lines: the step starts at 10 pips (for example 50 pips: 150.000, 150.500 ...). Major

Entry signals as finger marks: yellow for trend-following, pink for counter-trend. SignRAMB combines RSI, ATR, MACD, a moving average, Dow theory and the candles, and marks the places where the price may turn up or down, based on past chart patterns. A finger pointing up is a buy, pointing down is a sell. Signals are decided on closed bars and never repaint. Signals are not always right. Use them as one indicator, together with your own reading of the chart. They are meant for the move right aft

Welcome Please note that I am currently uploading all my precious indicators. (It takes time with all the files, names, pics etc.) Feel free to ask questions.
This indicator works on all TFs and instruments, from AUDCAD to Gold (Any vehicle).
When price runs into one of these lines, then we would assume a reversal might happen. For Binary Options:
Imagine there is 2min 23 sec remaining of the chart candle, price hit the S/R line, then trade the remainder time.this chart is an M5 chart when pr

适用于 MT4 的 Crypto_Forex“Acceleration Bar Pro ”(加速柱)指标——助您捕捉重大趋势。 - “Acceleration Bar Pro”指标是趋势交易的强大工具,能最大程度降低市场横盘震荡带来的干扰。 - 看涨加速柱(蓝色):图表上的某根K线,其最高价高于前5根K线的最高价,且其最低价低于后5根K线的最低价。 - 看跌加速柱(红色):图表上的某根K线,其最低价低于前5根K线的最低价,且其最高价高于后5根K线的最高价。 - 支持电脑端和移动端提醒功能。 - 配备信息显示面板:显示当前货币对的点差(Spread)和隔夜利息(Swap)。 - 信息显示面板还可展示账户余额、净值及保证金信息。 - 信息显示面板的位置可自由调整至图表的任意角落。 趋势交易: - 买入信号:图表上出现连续4根看涨加速柱。 - 卖出信号:图表上出现连续4根看跌加速柱。 Click here to see high quality Trading Robots and Indicators! 本产品为原创产品,仅在 MQL5 网站上独家提供。

MarketFlow Indies MarketFlow Indies is a clean MT5 chart indicator designed to help traders read directional flow, confirmed Buy/Sell signals, market structure, reaction zones, and spread information in one simple visual workspace. The indicator focuses on chart clarity. Signals are displayed directly on the main chart with compact Buy and Sell labels, colored flow lines, optional structure marks, and a small dashboard for quick signal review. Expert Version MT5 : https://www.mql5.com/en/market

Which currency is strong right now — in one panel. CurrencyStrength takes the RSI of the 28 pairs of USD, EUR, JPY, GBP, AUD, CHF, CAD and NZD, turns it into a score from −100 to +100 for each currency, and shows them as bars, strongest first. Features Strength ranking: strong currencies in green, weak ones in red, scored from −100 to +100. Automatic symbol detection: the pairs are found from each symbol's base and profit currency, so suffixes and prefixes (EURUSD#, EURUSD.pro, m.EURUSD, EURUSDm

OHLC Timeframes Osw
OHLC Timeframes Osw 是一款必不可少的多时间框架指标,旨在直接在当前图表上清晰准确地投影多达 4 个更高时间框架的关键开盘价 (Open)、最高价 (High)、最低价 (Low) 和收盘价 (Close) 水平。它使价格行为 (Price Action) 和 ICT 交易者能够通过绝对的视觉控制和集成在图表上的交互式按钮识别流动性点、机构支撑和阻力,从而即时开启或关闭视图。
参数指南(输入菜单) 时间框架配置(时间框架 1 至 4) - Timeframe:选择要分析的更高时间框架(如月线、周线、日线、H4)。 - Read Backwards:绘制过去周期的数量,以便将当前水平与历史周期进行比较。 - Extend Lines:水平线向图表未来延伸的长度。 - Show Open / High / Low / Close:控制每个水平的可见性(选项:隐藏、仅当前、仅上一个、显示全部)。 - Show Separator:启用或禁用所选周期的垂直分隔线。 - Color / Style / Width:为每条价格线和分隔
您知道为什么MetaTrader市场是出售交易策略和技术指标的最佳场所吗?不需要广告或软件保护,没有支付的麻烦。一切都在MetaTrader市场提供。
