适用于MetaTrader 4的技术指标 - 142

Invisible Ghost is a great arrow indicator for trading in financial markets.
Designed to work with popular technical analysis tools.
The indicator is based on the use of moving averages and Bollinger bands.
These tools help filter out market noise and focus on key moments.
This indicator also analyzes historical market data to improve the accuracy of signals.
Key features: - Simple signals: the indicator displays red arrows for sell signals and blue arrows for buy signals, making the decis

AI Supertrend timely alerts MT4 超级趋势及时提醒指标介绍 一、指标概述 MT4 超级趋势及时提醒指标是一款专门为 MetaTrader 4 平台设计的技术分析工具,旨在帮助交易者精准地捕捉市场趋势的变化,并及时发出信号提醒交易者潜在的交易机会。它基于独特AI的算法,综合考虑价格波动、趋势强度以及市场波动性等因素,绘制出直观的趋势线和发出明确的交易信号,无论是新手还是经验丰富的交易者都能从中受益。 二、指标构成与原理 趋势线 :该指标通过对价格数据的深入分析,绘制出一条动态的趋势线,清晰地展示当前市场的主要趋势方向。当趋势线向上倾斜时,表明市场处于上升趋势;反之,当趋势线向下倾斜时,市场处于下降趋势。这条趋势线的计算方法结合了多种技术分析理论,能够有效过滤掉市场的短期噪音,准确反映市场的中期和长期趋势。 信号系统 :超级趋势及时提醒指标配备了一套先进的信号系统,包括买入信号和卖出信号。当市场条件满足特定的趋势反转或延续条件时,指标会在图表上及时弹出信号提示,以箭头、图标或文字等形式明确告知交易者应该采取的交易行动。这些信号的生成基于对价格走势、趋势线突破、

1.Indicator gives key trade levels with red and green arrows. 2. You need to manually mark these trade levels on higher time frame with horizontal line or area and take the trades based on price action on lower timeframe at these trade levels. For example, see rejection or violation of these trade levels to go along or reverse the trade. (See attached screenshot) 3. You need to manually turn off signals for lower timeframes you comfortable working with. 4. Please note that you need to manually

SimpleProb:您的金融市场新盟友! 描述 您是否厌倦了复杂的指标,让交易变得更加混乱?SimpleProb 是专为 MetaTrader 4 设计的技术分析指标,它以简单高效的方式帮助您做出买卖决策。 SimpleProb 通过分析最近 14 个周期的价格走势,计算上涨 ( CALL ) 和下跌 ( PUT ) 的概率,并在您的图表上提供清晰的视觉信号,让交易决策更加直观。 如何运作? 简单概率计算 :分析最近 14 个价格周期,计算上涨和下跌的概率。 视觉信号 : 绿色箭头 :表示高概率买入机会,箭头出现在价格下方。 红色箭头 :表示高概率卖出机会,箭头出现在价格上方。 统计信息框 :图表上的统计框实时显示当前的上涨和下跌概率,并可自由移动,方便您的分析。 为什么选择 SimpleProb? 简单易用 :即使是初学者也能轻松理解和使用。 精准分析 :基于可靠的统计计算,帮助识别市场机会。 可定制 :调整概率阈值,使指标符合您的交易风格。 互动性强 :统计信息框可自由移动,完全适配您的图表布局。 如何获取? 不要再浪费时间在复杂且低效的指标上。立即获取 SimpleProb,让
CrossPoint4 is an indicator that helps novice traders.
In addition to the standard "Crosshair" function (Ctrl + F), CrossPoint4 will show you how to set the StopLoss and TakeProfit levels correctly, taking into account the minimum allowable level, calculate the number of points between two points and convert this into the currency of the account, taking into account the expected lot of the transaction.
Sometimes, when opening a deal, a novice trader completely forgets about the spread. After

Divergentor — это продвинутый индикатор предназначенный для выявления дивергенции - точек расхождения цены у двух различных пар с известной корреляцией. Например EURUSD и индекса доллара DXY, USDCHF и EURUSD, ETHUSD и BTCUSD, Nasdaq100 и SP500 и тп. Индикатор использует фундаментальную закономерность движения цены за основным активом и дает преимущество в более раннем определении разворота на текущей паре. Индикатор может быть использован как готовая стратегия входа. Идеально подходит как для

The Pure Price Action ICT Tools indicator is designed for pure price action analysis, automatically identifying real-time market structures, liquidity levels, order & breaker blocks, and liquidity voids. Its unique feature lies in its exclusive reliance on price patterns, without being constrained by any user-defined inputs, ensuring a robust and objective analysis of market dynamics. Key Features Market Structures A Market Structure Shift, also known as a Change of Character (CHoCH), is a pivot

MT4 平台 AI T3 MA Super Fill 指标使用介绍 一、指标概述
AI T3 MA Super Fill 指标是一款融合了先进算法和 T3 移动平均线技术的强大分析工具,旨在为 MT4 平台的交易者提供精准的市场趋势判断和交易信号。它利用智能算法对价格数据进行深度处理,并通过独特的方式展示 T3 移动平均线的变化情况,帮助交易者更有效地把握市场动态,无论是在趋势市场还是震荡市场中,都能辅助交易者做出更明智的交易决策,适用于外汇、股票、期货、贵金属等多种金融交易市场。 二、指标构成与原理
T3 移动平均线组合 :该指标基于 T3 移动平均线构建,通过计算不同周期的 T3 均线,如短线(13 周期)、和长线(20 周期)均线,来反映市场不同时间跨度的趋势。这些均线的交叉、分离和汇聚等情况是判断市场趋势变化的关键要素。T3 均线相较于传统均线,对近期价格数据赋予了更合理的权重,使其能够更灵敏地捕捉价格趋势的变化,同时减少了滞后性带来的影响。 智能填充区域 :指标在均线之间的区域进行智能填充,形成独特的视觉效果。当市场处于多头趋势时,填充区域呈现出蓝色,直观地展示多头趋势的
MT4CandleTime 指标介绍
MT4CandleTime 是用于 MT4 平台的指标,能以直观数字倒计时形式,显示当前 K 线的剩余时间,方便交易者把握交易节奏。 精准时间把控 :MT4CandleTime 指标为交易者提供了极为精确的 K 线剩余时间数据,使他们能够在交易过程中对时间节奏进行精细管理,避免因时间因素导致交易决策的仓促或延误,从而显著提升交易决策的精准度和计划性。
安装时,下载好.ex4 格式文件,放入 MT4 的 “MQL4/Indicators” 文件夹,重启后在 “插入 - 指标” 里添加。一般无需复杂设置,也可右键点指标选 “属性” 调整显示位置、字体等。
在日内交易、波段交易、重大事件交易等场景中都能发挥作用,帮助交易者更好地决策,精准把握进出时机,提升交易效率和成功率,且适用于不同交易风格。
使用时要注意结合所选的时间框架制定策略,同时考虑市场流动性变化对交易的影响,避免盲目操作。
MT4 平台 AI Color Gradient Volume 指标使用介绍 一、指标概述
AI Color Gradient Volume 是一款基于人工智能技术,用于 MT4 平台的创新型成交量分析指标。它通过将成交量数据转化为直观的颜色渐变图形,帮助交易者更敏锐地洞察市场中资金的流入流出情况以及买卖力量的强弱对比,从而为交易决策提供有力支持,适用于外汇、股票、期货等各类 MT4 交易市场。 二、安装与设置
安装步骤 :首先,下载 AI Color Gradient Volume 指标文件,通常为.ex4 格式。然后,在 MT4 平台上,点击 “文件” 菜单,选择 “打开数据文件夹”,进入 “MQL4” 文件夹,接着找到 “Indicators” 文件夹,将下载好的指标文件复制粘贴到该文件夹内。关闭并重新打开 MT4 平台,在 “插入” 菜单中选择 “指标”,在自定义指标列表中找到 AI Color Gradient Volume 指标并点击,即可将其添加到图表上。 参数设置 :安装完成后,指标可能会有一些默认参数设置,一般情况下这些默认设置已能满足基本交易需求,但交易者也可

The indicator displays support and resistance zones defined logically using the MACD. The entire concept is explained in the video, with specific examples shown. The indicator works on any instruments and timeframes. It does not repaint.
After placing it on the chart, please go through all the timeframes sequentially, from monthly to 1-minute, so that all lines load correctly. After that, you can start using it.
The concept is unique and has not been seen in other systems or indicators.
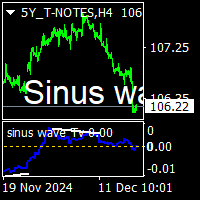
Sinus wave Tv indicator is a extra ordinary oscillator.to find divergency. For mt4 and Tradingview pine script purchased people, after installed on terminal ,contact me on mql5 to get BONUS TradingView pinescript.
it works all pairs and all timeframes. suitable for experienced and beginner traders.. indicator works on toward of the prices... while sinus wave go up side that means prices will up. and while sinus wave go down that means prices is going down. it gives divegency when trend rever

AI Pearson Trend!!
My name is Murat Yazici. I am a PhD candidate in Statistics.
I have several papers, writing books, book chapter studies, and several conference presentations and experiments about analytical modeling. About me: https://tinyurl.com/pjejextx The AI Pearson Trend indicator is a novel trend-based indicator including Fuzzy statistical modeling.
You can use it on all currencies and timeframes, not including M1 timeframes.
For best performance, check a trend to see if it is the sam
This custom trading indicator utilizes the Average True Range (ATR) to identify buy and sell opportunities based on price movement. It can optionally employ Heikin Ashi candles to reduce noise and produce smoother signals. The indicator is optimized for use on a 1-hour timeframe and is designed for long-term trading strategies. Works best with symbols: AUDUSD, EURUSD, USDJPY, GBPUSD, US500, US30, XAUUSD, BNBUSD Configure Settings : Configure Settings : Set KeyValue to 9.0 . Set ATRPeriod to 11 .
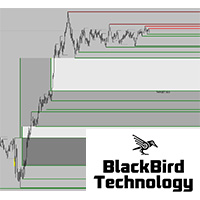
New market liquidity indicator, more accurate with two levels, will really unhide the "hidden agenda" of the price action in any timeframe. Forget all other indicator and use what professional traders are using ! For more information about market liquidity, a manual on how to use this indicator please send me a message.
A lot of information can be found on the net. (search liquidity trading/ inner circle trader)
https://www.youtube.com/watch?v=yUpDZCbNBRI
https://www.youtube.com/watch?v=2LIad2

Reversals is a trading tool designed to help traders identify potential trend reversals. Suitable for all experience levels, it provides instant alerts across multiple channels, with customizable settings . Whether you’re a scalper or swing trader, Reversal Pro can be integrated into your existing strategy.
Key Features of Reversals
Real-Time Alerts: Receive buy and sell signals directly via email, mobile, or desktop notifications. Non-Repaint Design: Once a signal is generated, it remains

Wave Trend Pro: Market Trend Analysis Tool Key Features Smart Signal Analysis Provides structured BUY/SELL signal insights Helps detect potential trend reversals Assists in exit point identification Offers real-time market condition tracking Advanced Visual Analytics Color-coded trend strength representation Dynamic trend momentum evaluation Market volatility tracking system Noise reduction filtering for clarity Performance Benefits Designed for efficient signal processing Developed to improve

交易水平指标是一个交易系统,旨在确定入场点、持有仓位和趋势方向。
包括在一个复合体中工作的多种机制、趋势方向的波浪分析、构建信号时的水平分析、显示可能的 TP 和 SL 目标。
指标能力
信号箭头出现在当前蜡烛上并且不会重新着色。 使用特殊算法来搜索价格反弹的水平。 根据趋势进行工作。 该系统具有通用性,可适用于各种交易工具。 箭头警报有多种类型。 信号箭头的输入参数在自动模式下配置和运行。 根据时间范围更改“趋势波周期”参数 “目标水平 SL TP”参数是针对主要货币对定义的;用于其他交易工具时,可以增加 10 或更多。
指标如何工作
判断趋势,该指标有一条波浪线;如果它高于价格,则趋势看跌;如果低于价格,则趋势看涨。 红色信号箭头用于购买,黄色信号箭头用于销售。 水平虚线是构建信号的电平;构建该线时,信号处于活动状态。 目标水平 SL 和 TP 的存在是为了方便技术分析和选择趋势参数。
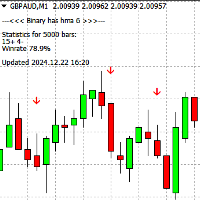
Binary HH 6 指标专为二元期权交易设计,适用于 M1 和 M5 时间框架,并支持任何货币对。它同样可用于外汇交易。 主要特点: 到期时间: 默认设置为 1 根蜡烛,但您可以在设置中调整到期时间为 1 至 3 根蜡烛。 趋势分析: 指标根据趋势运行,并在图表上以箭头形式提供信号: 蓝色箭头 – 买入信号。 红色箭头 – 卖出信号。 警报: 信号会在当前蜡烛关闭前以缓冲箭头的形式显示,支持外部 EA 使用该信号自动执行交易。 使用要求: 将 MQL5 文件夹复制到您的 MT4 终端目录中。下载链接如下:
https ://disk.yandex.ru /d /DPyo0ntaevi_2A 。 查看安装指南视频:
https ://youtu.be /Q9RvyKFQ4uA ?si =_q4qaF9jKPnhcj9x 。 如果需要弹出信号通知,可以使用此附加指标:
https ://www.mql5 .com /zh /market /product /126588 。 注意: 该指标适用于手动交易,也可以用于自动交易系统。

提升您的交易策略,使用 Big Candle Scanner Dashboard MT4,这是一个强大的多资产仪表板,专为检测多个货币对和时间框架中的超大牛市和熊市蜡烛而设计,指示潜在的动量转变或波动性激增。以经典蜡烛图分析技术为基础,由 Steve Nison 在 1990 年代通过其开创性的日本蜡烛图工作推广,这个工具成为外汇和加密交易者捕捉显著价格运动的首选。广泛用于在快速变化的市场中发现趋势启动、突破或反转,大型蜡烛通常预示主要趋势,提供早期入场点、通过高成交量确认改善风险管理、通过自动扫描减少屏幕时间等优势——非常适合剥头皮、日间交易者和波动交易者,适用于外汇对、指数、黄金 (XAUUSD) 等商品以及 BTCUSD 等加密货币。 Big Candle Scanner Dashboard MT4 提供一个可自定义的网格界面,显示大蜡烛的实时信号,由石灰绿箭头标记牛市 (向上) 和红色箭头标记熊市 (向下),具有可调节的面板尺寸、颜色 (例如,海绿色标题,钢蓝符号) 和文本缩放以实现最佳可读性。它扫描用户选择的货币对 (默认包括主要货币对如 EURUSD、GBPUSD 和异国
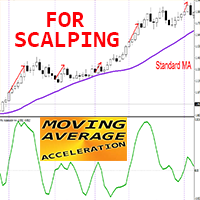
Crypto_Forex 指标移动平均线加速度适用于 MT4,无需重绘。
MA 加速度 - 是剥头皮指标,设计为“MA 速度”指标的辅助工具
- 该指标的计算基于物理方程。它将向您显示移动平均线的加速度。 - 有很多机会使用 MA 加速度升级标准策略。它可以用于 SMA、EMA 和 LWMA。 - MA 加速度是相应移动平均线的二阶导数。 - 指标显示 MA 速度指标改变其值的速度。 - 如果 MA 加速度指标的值 < 0:MA 速度在看跌方向上增加;如果 MA 加速度指标的值 > 0:MA 速度在看涨方向上增加。 - 建议在主要趋势方向的快速剥头皮策略中将 MA 加速度指标与 MA 速度指标一起使用,如果 MA 速度指标的值 < 0:趋势下降;如果 MA 速度指标的值 > 0:趋势上升。 - 上升趋势:一旦 MA 加速度 >0,开启买入剥头皮交易。 - 下降趋势:一旦 MA 加速度 <0,开启卖出剥头皮交易。
参数: 1) Period_V:相应 MA 速度指标的周期。建议值为 3 到 7。 2) Period_ACC:加速周期。建议值为 2 到 12。Period_ACC

Zone to Zone Indicator for MT4 Introducing the "Zone to Zone" indicator for MetaTrader 4, designed to enhance your trading strategy with precision and versatility. Key Features: Accurate Historical Resistance/Support Zones : Effortlessly identify key resistance and support zones on your chart, drawn with pinpoint accuracy. Highly Configurable : Tailor the indicator to your specific needs with a wide range of input parameters. Customizable Parameters : Specify the length, width, and number of hig

The correlation indicator is an analytical tool used to measure the relationship between two or more currency pairs or financial assets in the market. This indicator helps traders understand how the price movement of one asset affects or relates to the movement of another asset. Correlation is typically expressed in values ranging from -1 to +1: Positive correlation (+1) : Indicates that two assets move in the same direction. Negative correlation (-1) : Indicates that two assets move in opposite

The Dead Fish Pattern Indicator is a fresh take on the classic Quasimodo (QM) pattern, originally taught by Cikgu Mansor Sapari. But unlike traditional QM tools, this one’s laser-focused on bullish setups only—and for good reason.
Why no bearish patterns? Simple: they tend to be noisy and unreliable, often throwing false signals that can mess with your trade decisions. This indicator is built to filter that out and keep things clean, especially in uptrending markets.
Here’s how it works: it st

Binary SS 是一个用于二元期权交易的工具,特点如下: 适用于任何时间框架。 支持任何货币对。 根据 趋势生成高准确度的信号 。 如何工作? 下一根蜡烛的信号 以图表上的箭头形式显示(当前蜡烛关闭前): 蓝色箭头 — 买入信号。 红色箭头 — 卖出信号。 默认到期时间为 1 根蜡烛 ,可在设置中调整为 1 到 4 根蜡烛 。 安装: 下载“MQL5”文件夹 :
点 击下载 。 将其放入终端目录 。 观看安装视频教程:
视频教程 。 附加功能: 使用此附加指标接收弹窗通知:
下载 附加指标 。................................................................................
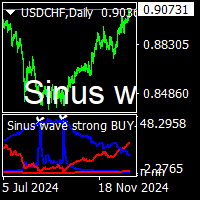
sinus wave strong buy sell indicator is nonrepaint top bottom point indicator.it work all pairs and all timeframe.suitable for beginners and experienced traders. it depend to sinus wave and vertex base .gives signal sinus wave over zero or below zero on approppirate vertex positions. cnt number has been set to 500 bars for demo mode. it can be increase to 2000 depend to charts has bar numbers. minimum value is 500. white points on red vertex spikes means sell. white points on blue vertex spikes

FIFTY 指标现在提供自动化版本,无需手动绘制水平线。此版本可自动在图表上绘制每日、每周、每月和年度水平线,确保准确性并节省时间。此外,提供按钮以切换这些水平线的可见性,实现完全自定义。对于喜欢手动操作的用户,免费版本仍然可用且功能齐全,让交易者可以根据自己的需求选择手动或自动工具。 最符合逻辑的指标之一。 高度可靠。 FIFTY 指标现在提供自动化版本,无需手动绘制水平线。此版本可自动在图表上绘制每日、每周、每月和年度水平线,确保准确性并节省时间。此外,提供按钮以切换这些水平线的可见性,实现完全自定义。对于喜欢手动操作的用户,免费版本仍然可用且功能齐全,让交易者可以根据自己的需求选择手动或自动工具。 最符合逻辑的指标之一。 高度可靠。
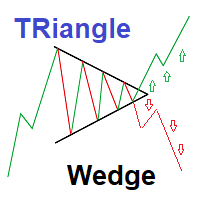
Strategy set to trade Triangle wedge break
This is a simple very effective strategy based on detecting and showing triangle wedges formation Strategy set to trade Triangle wedge break Red Arrows appears on crossing triangle down Green Arrows appears on crossing triangle Up You can also trade lower and upper triangle limit :(new version may be released to allow arrows for side ways trading) ---Sell on price declines from High triangle Level - Buy on increasing from Lower triangle level 2 inp
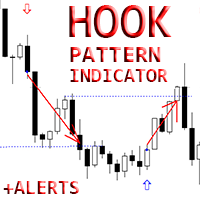
Crypto_Forex 指标“钩形模式”适用于 MT4。
- 指标“钩形模式”是价格行为交易的非常强大的指标:无需重绘,无延迟; - 指标可检测图表上的看涨和看跌钩形模式: - 看涨钩形 - 图表上的蓝色箭头信号(见图片)。 - 看跌钩形 - 图表上的红色箭头信号(见图片)。 - 具有 PC、移动和电子邮件警报。 - 指标“钩形模式”适合与支撑/阻力位结合使用。 .................................................................................................................... 点击这里查看高质量的交易机器人和指标! 这是仅在此 MQL5 网站上提供的原创产品。
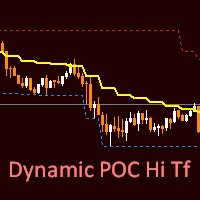
The new Dynamic PACK Hi Tf indicator is based on tick volumes. The middle line shows the average price for the selected period of the selected senior timeframe. The upper and lower lines show the maximum/minimum of the same selected period of the same timeframe. In the settings, the user can optionally choose which timeframe and bar calculation period he needs. You can also change the style, thickness, and color of each of the lines.
In the "StsrtBars" parameter, you can select the start peri
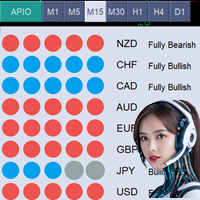
当前产品价格为 49 美元,仅限时优惠。下一阶段价格为 99 美元。 All Power In One (APIO) 指标 All Power In One (APIO) 指标是一款强大的工具,旨在评估主要货币(如 USD、EUR、GBP 等)的强度。通过分析不同货币对在可选时间框架内的走势和方向,APIO 为交易者提供清晰的货币强度洞察和潜在交易机会。 APIO 的 MT5 版本现已推出,点击下面的链接访问 MT5 版本: https ://www .mql5 .com /en /market /product /129241 使用此指标,您将获得什么? 实时监测每种货币的强度: 监测 USD、EUR、GBP 等货币的实时强度。 最佳买入机会列表: 获取包含最佳买入交易机会的货币对列表。 最佳卖出机会列表: 获取包含最佳卖出交易机会的货币对列表。 实时多时间框架访问: 通过界面按钮轻松切换时间框架,实现动态分析。 加入 Koala Trading Solution 频道,获取 Koala 产品的最新动态。频道链接: https://www.mql5.com/

Spot Turning Points with Ease The Catalyst Indicator is a tool designed to assist traders in analyzing potential turning points in price movements. By combining a smoothing technique with an advanced algorithm, this indicator offers signals that can support your trading analysis and decision-making.
Parameters: Variable (Defaults) Cycle 14
Period 21 Drag 0.2 Computer Alerts True Play_Sound True Send_Email false Send_Notification True Signal_Bar 0
How It Works Signal Detection : Gree

An indicator that calculates a volume value adjusted based on where did the candle close, so it gives a directional kind of volume. Buffers : It has two buffers, net long ,and net short. The buffers' empty value is mapped to the EMPTY_VALUE constant in MQL4 to make it easier to use the indicator in another EA or Indicator. Uses : Didn't find a specific use, but maybe combine it with VSA? not sure.

ZLMA Trend Candles indicator uses an enhanced Zero-Lag Moving Average to highlight key trend shifts, repainting candles in real time. It reacts faster than traditional moving averages, helping you spot potential market turns earlier. Gain clear entry and exit signals and filter out market noise with ease! This product is also available for MetaTrader 5 => https://www.mql5.com/en/market/product/129278 1. What Is ZLMA Trend Candles?
ZLMA Trend Candles is a MetaTrader 4/5 indicator based on the Z
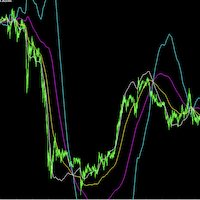
SourcePoint是一个很好的中长线交易指示器,他能独立使用,也可以去其他趋势型指标独立使用,可以很明确的给出趋势走向,很好的指出最佳的buy和sell位置,指标不含有未来函数,不会重新绘制,不仅能够应用到自己的手动交易过程中,还能完全可以写入到自己的EA中,如果你需要 MT5版本 可以去( https://www.mql5.com/zh/market/product/101744?source=Site +Market+My+Products+Page#description) 。 (如果你感觉到这个指标能够帮助你进行更准确的交易,请帮忙给个好评,希望我的作品能够帮助更多有需要的人) ===================参数列表===================== fastP: 96 slowP:208 avgP:72 =================参考使用方法=================== 此指标可以适用于任何交易品种,能够用在任何周期。 个人建议:短线交易选择M5,中长线交易选择M15 每次形成一个交点,就是一个交易机会,同时也是一个持仓平仓点位。建议配合
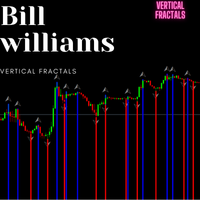
The indicator I’m referring to is a leading indicator, similar to the Bill Williams Fractals indicator, but with an added feature: it draws vertical lines on the chart to mark significant points in time. This functionality makes it particularly useful for traders as it provides clear visual cues for potential trading opportunities.
What sets this indicator apart is its versatility; it can be applied across all timeframes and any currency pair, making it suitable for a wide range of trading stra
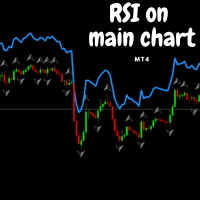
This indicator functions similarly to the Relative Strength Index (RSI), but with a key difference: instead of being displayed in a separate window, it overlays directly on the main price chart. This allows for more convenient visualization and interpretation of market momentum alongside price movements. I believe this indicator will enhance your trading experience by providing clearer insights into market conditions. Wishing you successful trading!

Lion’s Roar - Trend Strength Indicator Are you ready to take control of your trading journey? The Lion’s Roar - Trend Strength Indicator is here to help you identify and harness powerful market trends with precision and confidence. Designed with traders in mind, this advanced tool is built on a robust strategy that combines trend direction with momentum validation using the Average True Range (ATR). This indicator is not pre-optimized, giving YOU the freedom to tailor it to your unique trading

Unleash Market Volatility with the Titan Force Indicator! Are you ready to dominate the market by capitalizing on volatility? The Titan Force Indicator is your ultimate trading tool, designed for traders who thrive during periods of heightened market activity. Not Optimized for You – Yet! This indicator is a canvas for your creativity. It's been crafted to let you optimize it according to your unique trading strategies and preferences. Your skills, your edge! How Does the Titan Force Indicator

Introducing the Falcon Turn Indicator Designed for customization and optimization, this indicator empowers traders to adapt it to their unique strategies. Why Choose the Falcon Turn Indicator? The Falcon Turn Indicator leverages the power of the Parabolic SAR strategy to highlight potential buy and sell opportunities with precision and clarity. It is perfect for trend-following enthusiasts and those who value flexibility in fine-tuning their trading tools. Key Features: Parabolic SAR-Based Sign

Detailed blog post explaining everything with screenshots and has free scanner link: https://www.mql5.com/en/blogs/post/760476/
Scanner only works with the purchased Trendlines indicator. And it needs to be in same directory.
Features
Triangle Types: Detects ascending, descending, and symmetrical triangles. Channel Types: Horizontal, rising, and falling channels. Scanner: Shows symbols for above trendline patterns Threshold: Adjustable sensitivity for slopes Breakouts: Alerts when price breaks
MT4 版本 https://www.mql5.com/en/market/product/129411 MT5 版本 https://www.mql5.com/en/market/product/129412
卡尔曼扫描仪仪表盘 – 多货币对、多时间框架扫描仪
采用卡尔曼滤波技术的一体化智能趋势检测扫描仪
卡尔曼扫描仪仪表盘是一款基于改进的卡尔曼滤波趋势水平算法的高级扫描仪,旨在同时监测多个时间框架和多个交易品种的趋势方向、信号水平和趋势强度。
无论您是剥头皮交易者、波段交易者还是趋势追随者,此仪表盘都能提供实时的市场行情鸟瞰视图,帮助您更快、更准确地做出交易决策。
主要特点 1. 基于卡尔曼的趋势分析 利用卡尔曼滤波器动态适应价格波动,平滑趋势并降低噪音。这确保了对趋势水平和关键区域的准确识别。 2. 支撑位与阻力位检测 - 根据卡尔曼滤波的价格行为自动计算关键支撑位和阻力位。 - 突出显示价格突破或重新测试的水平,以便快速做出潜在交易策略的决策。 3. 多交易品种和多时间框架仪表盘 - 在一个直观的界面中显示多个交易品种和时间框架的状态。 - 清晰的视觉指标显示: 突
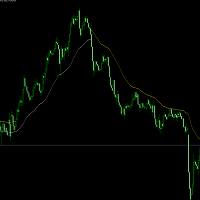
超级趋势指标
开发于2024年12月,测试效果不错。 适用于,黄金1小时,可配合 5分钟和15分钟趋势线。 白线上只做多,黄线下只做空。 其它品种可根据自己的经验使用。 如果使用中有什么问题可提供宝贵意见。谢谢。 超级趋势指标 开发于2024年12月,测试效果不错。 适用于,黄金1小时,可配合 5分钟和15分钟趋势线。 白线上只做多,黄线下只做空。 其它品种可根据自己的经验使用。 如果使用中有什么问题可提供宝贵意见。谢谢。 超级趋势指标 开发于2024年12月,测试效果不错。 适用于,黄金1小时,可配合 5分钟和15分钟趋势线。 白线上只做多,黄线下只做空。 其它品种可根据自己的经验使用。 如果使用中有什么问题可提供宝贵意见。谢谢。

The Mountain Guard Indicator is a highly customizable tool designed for traders who want full control over their optimization. It has not been pre-optimized, giving you the freedom to adapt it to your specific trading strategies and preferences. Key Features: Buy and sell signals displayed with lime (buy) and red (sell) arrows on the chart. SAR line represented as a dotted Dodger Blue line to visualize the Stop-and-Reverse (SAR) trend-following indicator. Adjustable parameters to control SAR st

Ocean State Indicator Unleash the Power of Precision Trading! Introducing the Ocean State Indicator, an innovative tool designed to elevate your trading experience. This indicator is a versatile, dynamic solution that equips you with the tools needed to analyze market trends and identify profitable entry and exit points. Priced at just $65, it’s an incredible value for traders seeking to optimize their strategies. Important Note: The Ocean State Indicator is not pre-optimized. It’s been created

Wolf Signal Indicator Note: This indicator is not optimized and is designed for traders who prefer to tailor it to their unique strategies. It provides a robust framework, giving you the freedom to adjust parameters and refine its behavior to suit your trading style. Why Choose the Wolf Signal Indicator?
The Wolf Signal Indicator is a powerful and versatile tool for identifying trading opportunities across multiple market conditions. Designed with precision, this indicator harnesses advanced al

Discover the untapped potential of market range trading with the Forest Shadow Indicator! Designed for traders who want to optimize their strategies, this tool provides raw, powerful insights into market trends and turning points. Note: The indicator is unoptimized, offering you full flexibility to tailor it to your unique trading needs. Core Logic: The Forest Shadow Indicator uses a combination of stochastic momentum and visual signals to highlight potential buy and sell zones within range-bou
Mountain Echo Indicator
Your key to uncovering trade opportunities, designed for custom optimization.
Price: $65 Key Features: Visual Buy and Sell Signals
The indicator places visually appealing arrows directly on your chart: Lime Green Arrows indicate potential buy opportunities. Red Arrows signal potential sell opportunities. Customizable Stochastic Parameters
Includes key inputs like: %K Period (default: 14) %D Period (default: 3) Slowing (default: 3) Bars to Wait Between Signals (default: 1

Welcome to the Ocean's Gate Stochastic Indicator! Note: This indicator is not optimized by default—it has been crafted for you to tweak and optimize based on your unique trading style! Dive into precise decision-making with this advanced trading tool that harnesses the power of the stochastic oscillator. The Ocean's Gate Stochastic Indicator not only visualizes overbought and oversold conditions but also identifies critical crossovers, allowing you to anticipate market movements with confidence

Introducing the River Flow Divergence Indicator Are you ready to unlock your trading potential? Meet the River Flow Divergence Indicator, a powerful tool designed to help you navigate market trends and reversals with precision. This indicator is tailored for traders who are eager to fine-tune their strategies and take control of their success. Note: This indicator is not optimized out of the box. It’s crafted for you to customize and optimize according to your unique trading style and goals. Ho

Introducing the Star Path Stochastic Cross Indicator Ready to explore your trading potential? The Star Path Stochastic Cross Indicator is here to guide your path. Designed for traders who love flexibility, this indicator is not optimized, giving YOU the freedom to tailor it to your strategies. Whether you're a beginner or an experienced trader, this tool is the perfect addition to your toolkit. The Logic Behind the Indicator
This indicator leverages the powerful stochastic oscillator to identif

Wind Dancer Indicator Ready to take control of your trading journey? The Wind Dancer Indicator is here to empower your strategies with a unique, visually intuitive approach. Designed with flexibility in mind, this indicator is not optimized, giving you the creative freedom to fine-tune and adapt it to your specific trading needs. How Does the Wind Dancer Indicator Work? The logic behind the Wind Dancer Indicator is a blend of sophisticated signals and a seamless visualization algorithm: Signal

Aurora Cross: Your Customizable Path to Trading Success! Price: $65
Explore More Tools and Strategies Here About This Indicator
The Aurora Cross Indicator is designed to empower traders to refine and optimize their strategies. It’s a versatile tool created specifically for you to customize and tailor to your unique trading approach. It is not pre-optimized, giving you complete freedom to experiment and find the perfect settings for your trading style. How It Works
At its core, the Aurora Cross

Cosmos Dance Indicator The Cosmos Dance Indicator is your next powerful tool in financial trading, designed for traders who value precision and flexibility. This indicator is not pre-optimized, giving you the freedom to fine-tune and adapt it to your specific trading strategy. With Cosmos Dance, you hold the reins to enhance your trading edge. Key Features and Logic: Clear Buy and Sell Signals: Visual arrows for "Buy" (green) and "Sell" (red) opportunities, helping you identify potential market

Not Optimized – Created for Your Custom Optimization! Introducing Diamond Crush – your pathway to mastering market squeezes! This indicator is designed to identify powerful trading opportunities by analyzing market conditions and visualizing key areas of market compression and expansion. Why Diamond Crush? Band Squeeze Analysis: Harness the power of dynamic upper and lower bands to capture market volatility and trend shifts effortlessly. Buy & Sell Signals: Visual cues guide you through potenti

Moon Touch Indicator Unlock the full potential of your trading strategy with the Moon Touch Indicator! This advanced tool is designed for traders who want to fine-tune their approach and optimize their results. While the indicator isn't pre-optimized, it gives you the flexibility to tailor it perfectly to your trading style and market conditions. How Does It Work? The Moon Touch Indicator is a versatile signal tool that works by identifying key market conditions: Buy and Sell Signals: Clearly m

Solar Flare Indicator The Solar Flare Indicator is a versatile and customizable tool designed for traders who value precision and adaptability. Built to empower traders of all levels, this indicator highlights key market dynamics to support strategic decision-making. Please note, the indicator is provided without pre-optimization, giving you the freedom to tailor its settings to your specific needs. Behind the Strategy – How It Works: The Solar Flare is rooted in a combination of technical anal

Unlock the Power of the Storm Break Indicator The Storm Break Indicator is a cutting-edge tool designed to identify precise market entry points using the proven logic of Bollinger Bands. While this indicator is not optimized out of the box, it offers you an exceptional opportunity to tailor it to your trading style and maximize its potential. What Makes the Storm Break Indicator Unique? Core Logic: The indicator leverages Bollinger Bands, a time-tested technical analysis tool, to identify overb

Visual EMA CrossPro - Your Ultimate Trading Companion! Are you ready to enhance your trading strategy with a powerful yet easy-to-use tool? Introducing the Visual EMA CrossPro, an intelligent indicator designed to help traders identify precise market entry and exit points based on EMA crossovers. For just $65, you get access to a reliable solution to simplify your trading journey. How It Works:
The Visual EMA CrossPro leverages two key EMAs (Exponential Moving Averages) to identify trends and

Visual EMA MultiFlex Indicator - Master the Trends with Precision! Achieve trading mastery with the Visual EMA MultiFlex Indicator, a dynamic tool designed to enhance your decision-making by combining the power of three Exponential Moving Averages (EMAs). Whether you're a beginner or an experienced trader, this indicator is your gateway to identifying precise market entries and exits. How It Works:
The Visual EMA MultiFlex Indicator leverages Short, Medium, and Long EMAs to analyze market momen

Visual EMA PriceSync Indicator Price: $65 Discover a cutting-edge trading indicator designed to synchronize price action with EMA (Exponential Moving Average) trends. The Visual EMA PriceSync Indicator is your ultimate tool for identifying precise market entry and exit points, making it an essential addition to any trader’s arsenal. What does it do?
The indicator detects crossover signals between the price and EMA, which signify potential trend reversals or market corrections. These signals are

The Visual EMA ReversalScout Indicator combines a powerful EMA crossover strategy with RSI-based divergence detection to generate reliable buy and sell signals. Its advanced logic ensures robust and actionable market insights while maintaining flexibility for optimization. Strategy Breakdown: EMA Crossovers: Uses Fast EMA and Slow EMA to identify trend directions and reversals. Bullish signals arise when the Fast EMA crosses above the Slow EMA, indicating an uptrend. Bearish signals occur when

Unleash Your Trading Potential with the Visual EMA SignalLine Pro! This innovative indicator is designed to revolutionize the way you approach trading. While it’s not pre-optimized, its raw power lies in its flexibility and precision, making it a must-have tool for traders eager to fine-tune strategies to their unique style. Why Choose the Visual EMA SignalLine Pro?
The indicator is built around the powerful concept of Exponential Moving Averages (EMA) combined with dynamic signal line strategi

Empower Your Trading Journey with the Visual EMA TrendForce! This advanced indicator is designed to give you the edge you need in the dynamic world of trading. Although it’s not pre-optimized, it provides a robust foundation for traders to customize and optimize according to their unique trading needs. Why Visual EMA TrendForce Stands Out
The indicator leverages the proven strength of Exponential Moving Averages (EMA) combined with trend-detection algorithms. Here’s how it can transform your tr

Visual CrossPulse Indicator The Visual CrossPulse Indicator is a tool designed for precision and ease, combining technical analysis with user-friendly features to identify profitable market opportunities. This hybrid strategy tool integrates the MACD (Moving Average Convergence Divergence) with an optional RSI (Relative Strength Index) filter, visually signaling high-probability trade setups for confident market entries. How It Works The indicator uses the MACD to detect trend momentum shifts.

HistoEdge Indicator HistoEdge is a powerful and customizable MetaTrader 5 indicator designed to provide insights for informed trading decisions. It is not optimized by default, allowing traders to fine-tune it according to their strategies. Key Features Utilizes the MACD histogram to highlight market momentum and potential reversals. Displays fast, slow, and signal periods for a comprehensive view of market dynamics. Fully customizable parameters, including fast period (default: 12), slow perio

Master the Market with the Visual SignalPro Divergence Indicator! Designed for traders who want to uncover hidden opportunities, this indicator is your gateway to identifying high-probability divergence setups. It’s not pre-optimized, giving you the freedom to fine-tune it to match your unique trading style and preferences. What Makes the Visual SignalPro Divergence Indicator Unique?
Divergence is a powerful concept that reveals when price action and momentum indicators move in opposite directi

MACD Momentum Shift Unleash the power of momentum in your trades with the MACD Momentum Shift, an advanced trading indicator based on the Moving Average Convergence Divergence (MACD). This tool is designed for traders who want to optimize and adapt it to their personal trading style. This indicator is not pre-optimized, allowing full customization. Modify MACD fast, slow, and signal periods, as well as the delay between signals, to match different market conditions and strategies. It provides c

Dragon State Indicator is a powerful trading tool designed to empower traders by giving them the foundation to optimize it further. This indicator is not optimized, making it a perfect choice for traders who love to tweak and customize trading tools to suit their unique strategies. The Logic Behind the Indicator The Dragon State Indicator identifies pivotal market movements using these components: Buy and Sell Signals: Buy Signal: Clearly displayed with lime-green arrows when conditions suggest
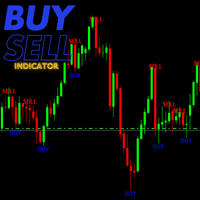
This tool is designed specifically for traders seeking to identify market reversals, allowing you to capitalize on advantageous trading opportunities. The indicator has undergone extensive testing and has established itself as a leading indicator; it often predicts market movements effectively. When a buy or sell signal is generated by the indicator, it tends to align with the market’s subsequent behavior, following the trend indicated by the signal.
By utilizing this indicator, you can enhance
MetaTrader市场是独有的自动交易和技术指标商店。
阅读MQL5.community用户备忘更多地了解我们提供给交易者的独特的服务:复制交易信号,自由职业者开发的自定义应用程序,通过支付系统完成的自动付款和MQL5云网络。
您错过了交易机会:
- 免费交易应用程序
- 8,000+信号可供复制
- 探索金融市场的经济新闻
注册
登录