适用于MetaTrader 4的技术指标 - 44

Trading is about waiting for the right time. This indicator was created to know what is happening on our charts without having to cover the screen with indicators. In addition, it has several types of alerts that allow us to dedicate our time to other things until something interesting happens. You can use multiple alarms at the same time. It is not a problem.
By default AlterAlert offers us alerts when the following indicators give us a signal:
Moving average (MA crosses) Stochastic Oscillat
FREE
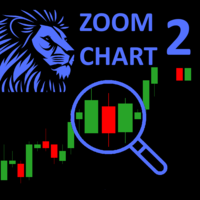
The ZoomChart indicator works with two charts - the current chart on which it is launched and the next one. The indicator translates the second chart to the time where the first one is now. Thus, the second chart depicts the same situation on the first chart (where the indicator is launched), but on a different time-frame. In other words, this indicator serves as a magnifying glass or, on the contrary, reduces the chart to display the situation on a larger time-frame.
The ZoomChar indicator au
FREE

Note: this product is a free limited version of the full featured product Currency Timeframe Strength Matrix . It only includes AUD, CAD, CHF currencies instead of all 8 currencies. It includes only 5S, 1M, 5M time frames instead of all 8 (5S, 1M, 5M, 15M, 30M, 1H, 4H, 1D).
What is it? The Currency TimeFrame Strength Matrix is a simple and comprehensive Forex map that gives a snapshot of what is happening in the Forex market at the very present time. It illustrates the strength and momentum ch
FREE

The indicator can help traders to assess in advance the number of Lots, Balance and Equity, if the price deviates from the current levels. The indicator will be useful for those who trade using Martingale.
Features The indicator belongs to the category of risk management. The indicator helps to assess in advance the account change that would happen in case of possible price change from the current value to a threshold. It also recalculates swap, lock, pending orders, take profit and stop loss.
FREE

This is Demo Version of PipsFactoryDaily This indicator depends on High and Low price of currency in the last day, and then I made some secret equations to draw 10 lines.
Features You will know what exactly price you should enter the market. You will know when to be out of market. You will know what you should do in market: Buy Sell Take profit, and there are three levels to take your profit Support Resistance Risk to buy Risk to sell
Signal Types and Timeframes Used You can use this indicator
FREE

This is Demo version of PipsFactoryWeekly This indicator depends on High and Low price of Currency in last Week and then i made some secret equations to draw 10 lines.
Features: You will know what exactly price you should enter the market . You will know when to be out of market. You will know you what should you do in market: Buy Sell Take profit and there are 3 levels to take your profit Support Resistance Risk to buy Risk to Sell
Signal Types and Frame used: You can use this indicator just
FREE

Support/Resistance Percent Rank
SR Percent Rank helps to see how many times the current close price has been in the past price range. SR Percent makes a loop over x bars into the past and calculates the percentage of times the current closing price has been between the high and the low price in the x bars before that. So we can determine if the current price is moving at supports or resistance that was formed in the past. I use the indicator when creating strategies with the StrategyQuant X pr
FREE

The MACD (Moving Average Convergence Divergence) indicator is one of the most widely used technical analysis tools by traders worldwide. Created by Gerald Appel in the 1970s, the MACD is an indicator that helps investors identify the trend direction, trend strength, and possible trend reversal points. The MACD indicator is composed of a histogram that shows the difference between the 12-period exponential moving average and the 26-period exponential moving average. The top part of the histogram
FREE
An extended version of the indicator for visualizing the time ranges of key trading sessions: Asian, European and American. The main advantage of this indicator is the automatic construction of a price profile for a trading session. The indicator has the functionality to set the start and end time of each trading session, as well as automatically determine the time zone of the trading server. The indicators include the ability to work with minimal CPU usage and save RAM. In addition, the option
FREE

Forex trading support timer: - This is an indicator that supports a trader's trading process. - Before placing a BUY or SELL order, it is advisable to observe what the current time is like, to get the best position when trading. Function of indicator: - Display information about candle closing time of different timeframes (M1,M5,M15,H1), best used when Scalping. - Show market spreads. - Show TimeZone Trading. - Displays the remaining time of a session.
FREE
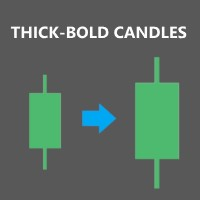
Description: Expand the width of your candles horizontally in MT4 to improve visibility when zooming in or out of the chart. Once attached to the chart, the indicator will automatically double the size of the candles compared to their normal value. Main indicator inputs: Body: size of the candle body Wick: size of the candle wick Additionally, you have the option to change the color of the candle body. We hope you find this free and useful indicator enjoyable!
FREE

Do you need precision? Tick charts show each change in the ask or bid; The chart updates whenever either price changes. Study the markets more deeply, with surgical precision. Tick Chart Window saves all the received ticks and shows them into a seperate window. Get the best entry price in the Market. trade with precision trade good Spread Register In the comment section you will see the highest spread, the lowest spread and the average spread since the indicator was loaded.
FREE

The indicator shows the current situation on 16 indicators and 10 strategies.
Its values are formed based on the evaluation of the specified criteria for each strategy separately.
As a result, we can observe on the chart the strength of all the indicators included in it, as well as additional logic. Advantages: Signals do not redraw their values. The arrow is drawn after confirmation. All types of alerts. Shows weak zones based on the evaluation results. The passing value of the score is dete
FREE
The indicator automatically calculates the balanced price value. It shows in which direction and by how much the balanced price value is currently shifted. Works on all timeframes, on any currency pairs, metals and cryptocurrencies. Can be used when working with binary options. Distinctive features Not redrawn; Simple and fast setup; Clear interpretation of readings; Works on all timeframes and on all symbols; Suitable for trading currencies, metals, options and cryptocurrencies (Bitcoin, Liteco
FREE

EUR INDEX
The Currency Index Project is ONE part of a thorough Forex study. Many people do not know the theoretical basis that drives currency exchange rates to move on the market. With this set of tools you will be able to have a more complete view of the entire market by analyzing not only the single currency of an exchange, but all the exchange rates that make up that currency by looking at a single window!
The indicator faithfully represents the real index of a single currency present in a
FREE

PRO VERSION This free indicator change timeframe of charts(up to 3) at the same time,by clicking a label. If you click the label(shown below),timeframe of charts will change. If you click again,timeframe of charts restore.
You can change the position of the label.
You can change charts up to 3 charts(a paid version enables up to15 charts). You can add second,third timeframe changer label.
This indicator is very useful for speed trading.
There is a more powerful PRO VERSION . The paid versio
FREE

P R I C E F O R C E A N A L Y Z E R This is a complex indicator that calculates the force of the price direction.
V E R Y I M P O R T A N T This is not a stand alone indicator. Use it together with your own strategy. This indicator only confirms your possible position. You can run it in any charts and timeframes but H1 is recommended. Make sure that the pair is volatile at the time of trading. If you don't have a solid volatility-based strategy yet, y
FREE

What is a tool ? This indicator use for comparison of 8 major currency from 28 pairs and multiple timeframes and calculates a score of strength from 0-100. How to use Place the indicator on any pair any timeframe, And entering only the value of X Y position to be displayed in the graph. Pair : Any Timeframe : Any Input Parameter Start X Position : Value of X on chart Start Y Position : Value of Y on chart Visit my products Target Profit Magic Target Profit All The Profit Tracker Currency
FREE

The indicator displays the trading statistics of the analyzed Market signal on the chart. Signal transaction data is presented in an excel (csv) file and can be taken from the Signal>Trading history ( Export to CSV: History ). The copied file must be saved to the directory MT4>File>Open Data Folder>MQL4>Files. Available color management and font output. If the currency names are different on the Signal and User accounts, use the Prefix and Suffix parameters. Utility options Prefix at Signal -
FREE

Indicator is converted from another programming language code by programmer " sbtnc ". MQL version is simplified to be more useful by less settings complexity. There is some clues from programmer about indicator: The indicator tracks and reports the percentage of occurrence of daily tops and bottoms by the time of the day. At certain times during the trading day, the market reverses and marks the high or low of the day. Tops and bottoms are vital when entering a trade, as they will decide if y
FREE

The indicator reads the current spread and displays it on the chart. The maximum value, the minimum value, the value at the time of opening the bar and the maximum value divided by 10 are displayed separately.
The indicator does not remember these values so the data will be lost if there is a change in the timeframe.
The indicator is useful for analyzing market volatility, comparing the spread between brokers and different types of accounts. By default: Red line - maximum spread; Green bar -
FREE

This indicator will mirror the assets in use in another metatrader, being able to choose the timeframe and a template. This is the Metatrader 4 Client, it needs the Metatrader 4 or 5 Server versions: Metatrader 4 Mirror Chart Server: https://www.mql5.com/en/market/product/88644
Metatrader 5 Mirror Chart Server: https://www.mql5.com/en/market/product/88652 Details of how it works in the video.
FREE
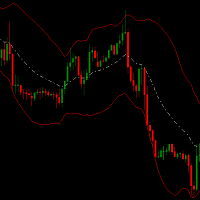
Channel hero indicator is a special channel which helps you to detect oversold/ overbought areas. It can be a complementary indicator for your strategy.
It can be combined with bollinger bands . When price breaks above bollinger bands and upper channel hero band is above bollinger band and also
the white line (middle channel hero line) is above middle BB then this point has big possibility to go up. A good closing point can be when middle channel hero line cross below middle bollinger bands.
FREE

Sends price alerts conveniently to your Android/IOS device. Make sure push notifications are enabled in Metatrader settings and the PC/VPS is online 24/7. Price levels are updated automatically, but you can modify them in global variables, if needed. Suitable for any market instrument, but if notifications are too frequent, increase point value of the indicator parameter.
FREE
Introducing Austin RSI—an innovative indicator designed to elevate your forex trading strategy by applying moving averages to the MetaTrader 4 indicator, RSI.
The Relative Strength Index (RSI) is a popular momentum oscillator that measures the speed and change of price movements. It oscillates between 0 and 100 and is used to identify overbought and oversold conditions in the market. Traders often use RSI to gauge the strength of price movements and anticipate potential trend reversals.
Austi
FREE

Introducing CCI Jurik—a dynamic indicator designed to elevate your forex trading experience by integrating custom moving averages based on the Commodity Channel Index (CCI) with the MetaTrader 4 indicator, CCI.
Jurik moving averages are renowned for their accuracy and reliability in analyzing price movements in the forex market. They offer traders a smoother representation of price action, reducing noise and providing clearer signals for identifying trends and potential reversals.
The Commodi
FREE

This indicator continuously, smoothly changes the color of candlestick edges and bodies, as well as the color of volumes in real time like a lamp. The indicator is easy to use. The palette of colors is diverse. This product is a graphical solution, so it is difficult to describe what it does by text, it is easier to see by downloading it, besides the product is free. The indicator is suitable for bloggers who want to create a beautiful picture of a chart for video editing or traders who want to
FREE
精细调整移动平均线的终极工具 这款先进的工具旨在彻底简化并优化您的移动平均线设置。借助 MA Tuner,您可以通过一个用户友好的面板轻松调整关键参数,包括周期、偏移量、计算方法和价格类型。通过这种方式,您可以即时获取详细的统计数据,了解蜡烛图与移动平均线的交互情况,包括蜡烛图穿越 MA 线的频率,以及它们相对于 MA 线的开盘价和收盘价的位置。 与标准的移动平均线指标相比,MA Tuner 提供了显著的优势。虽然它绘制的 MA 线与标准移动平均线指标相同,但 MA Tuner 让您无需每次调整周期或偏移量时都打开指标窗口。这种设计极大地提高了操作的便捷性和效率,使得您可以更加专注于交易策略的优化,而不必浪费时间在繁琐的设置调整上。MA Tuner 的功能不仅能够帮助您更好地分析市场趋势,还能在实时交易中提供及时的反馈,从而助力您的交易决策。
FREE
Binary Options Assistant (BOA) FLAME Signals Indicator provides signals based on the combination of: RSI, MACD & Stochastic Indicators
Stop missing trades, stop jumping from chart to chart looking for trade set-ups and get all the signals on 1 chart! U se any of the BOA Signals Indicator with the Binary Options Assistant (BOA) Multi Currency Dashboard .
All BOA Signal Indicator settings are adjustable to give you more strategy combinations. The signals can be seen visually and heard audib
FREE

AUD INDEX
The Currency Index Project is ONE part of a thorough Forex study. Many people do not know the theoretical basis that drives currency exchange rates to move on the market. With this set of tools you will be able to have a more complete view of the entire market by analyzing not only the single currency of an exchange, but all the exchange rates that make up that currency by looking at a single window!
The indicator faithfully represents the real index of a single currency present in a
FREE
CAD INDEX
The Currency Index Project is ONE part of a thorough Forex study. Many people do not know the theoretical basis that drives currency exchange rates to move on the market. With this set of tools you will be able to have a more complete view of the entire market by analyzing not only the single currency of an exchange, but all the exchange rates that make up that currency by looking at a single window!
The indicator faithfully represents the real index of a single currency present in a
FREE

The Time End bar by MMD is a simple indicator that shows the number of seconds remaining in the three selected intervals. According to the MMD methodology, the moment when a directional price movement occurs is important. This indicator allows you to use this relationship more effectively in Forex and Futures trading.
Functionality description:
Time Frame 1 Period - defining the first time interval Time Frame 1 Color - specifying the color for the first time interval Time Frame 1 Period - def
FREE

A new interpretation of the classical indicator in the form of an oscillator for a more accurate representation of the situation on the market. Less lagging than the standard Alligator. All settings are fully accessible, such as the type and prices for which it is built. Thanks to the additional parameters, it became possible to fine tune.
Distinctive features Does not redraw. Additional parameters for fine tuning. Works on all timeframes and symbols. Suitable for manual trading and developmen
FREE

CoralDash is a simple symbol shortcut dashboard. The Symbol List has many presets to choose from: Market Watch Open Orders Current Chart Majors A custom list Clicking the symbol has two available actions Set the current chart symbol Filter the list of symbols shown in the dashboard based on one currency (e.g., see all EUR pairs) Click the "PAIR" cell in the header to toggle between the two available actions Click the symbol cell to apply the action For the filter, click the left side to selec
FREE

Many traders use The Bull-Bear Indicator, I decided to combine the two into just one, so the visualization is better, and I am sharing it with you. the trading rules remain the same, you can adjust the period as per your preference.
The Bull-Bear Indicator is a free indicator with several versions widely published on the internet, this is just a version that I put together, I hope you like it. If you want to know the indicators of my authorship, please visit my page here .
FREE
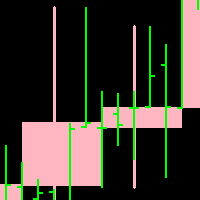
CandleLine:画烛线指标。按照指定的周期,在当前图表上画出该指定周期的烛线。并且,画出来的新烛线与当前图表的烛线一起叠加显示。 注意:当前图表的周期必须小于将要画出来的烛线周期。 自画烛线的具体效果,请观看下面的附件图片。 自画烛线的实体部份线宽,颜色可以设置,可以设置是否绘制烛线的上影线和下影线。 参数: 1.时间周期:指定烛线的时间周期 2.棒数;指定需要画出的烛线数量 3.阳蜡烛线颜色;指定阳烛线的颜色 4.阴蜡烛线颜色;指定阴烛线的颜色 5.柱体线条宽度;指定烛线柱体的线条宽度 6.上下影线条宽度;指定烛线上下影线的宽度 7.背景颜色;指定背景颜色 以上是主图表烛线图给制指标相关内容。欢迎下载试用,感谢!
FREE

Основное удобство донного индикатора в том, что он не назойлив как большинство, он хорошо показывает среднюю цену на текущем графике. индикатор информирует о количестве открытых позиций по текущему инструменту, а так же по всем открытым инструментам в том числе. при расчете средней цены учитывает комиссию и свопы, показывает чистую цену. Отображается на графике внизу экрана, есть возможность менять цвет и размер шрифта.
FREE

Introducing Austin Bands—an innovative indicator designed to enhance your forex trading strategy by applying moving averages to the MetaTrader 4 indicator, Bollinger Bands.
Bollinger Bands are a popular technical analysis tool that consists of a middle band (usually a simple moving average), an upper band (calculated by adding a specified number of standard deviations to the middle band), and a lower band (calculated by subtracting a specified number of standard deviations from the middle band
FREE
Displays current spread in the main window of the chart. Indicator Setting: BigDisplay =true or false to switch on and off.
DisplaySize = 20 is default
DisplayColor = Blue
Display_y = 550 position: staring position Y of background panel
Display_x = 1200 position: staring position X of background panel
Author: Happy Forex (Expert Advisor - your algorithm-driven profit, without stress or work)
FREE

Adaptive MA is a simple modification of the moving averages (MAs) that allows displaying an average value line based on multiple MAs on the chart. The parameters allow you to set any number of MA periods. The number of parameters is equal to the number of moving averages applied in calculation.
At first, it may seem that nothing new has been invented and there is no sense in this approach. However, this impression is deceptive. As we know, the trends have different duration. Have you ever tried
FREE
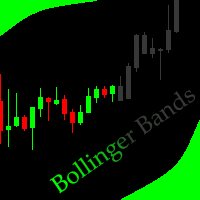
This indicator allows to hide Bollinger Bands (on all MT4 timeframes) from a date define by the user, with a vertical line (Alone) or a panel (with "Hidden Candles"). Indicator Inputs: Period Deviations Shift Apply To Color Style Width Information on "Bollinger Bands" indicator is available here: https://www.metatrader4.com/en/trading-platform/help/analytics/tech_indicators/bollinger_bands ************************************************************* Hey traders!! Give me your feeds! We are
FREE

CHF INDEX
The Currency Index Project is ONE part of a thorough Forex study. Many people do not know the theoretical basis that drives currency exchange rates to move on the market. With this set of tools you will be able to have a more complete view of the entire market by analyzing not only the single currency of an exchange, but all the exchange rates that make up that currency by looking at a single window!
The indicator faithfully represents the real index of a single currency present in a
FREE
TIRED OF HAVING TO CALCULATE THE LOTSIZE EVERY TIME?
This indicator will do it for you, WHATEVER ASSET YOU CHOOSE in 10 seconds !!!
INSTRUCTIONS
The things to do in order to activate this indicator will take around 10 seconds once you understand how to use this indicator properly.
Here are the steps to follow:
Place the indicator on the chart of the asset you want to trade on.
Go to " Inputs ".
Enter where you want to set the stop loss .
Choose risk in $ .
You can also choose whethe
FREE

This indicator calculate the minimum,maximum,average and relative (to points of the bar) spread in the chart applied period. The indicator must be applied to one or more different period on a Pair and analyze the spread for all the Pairs available by the Broker. The csv output for one minute chart is something like this https://gofile.io/?c=K5JtN9 This video will show how to apply the indicator https://youtu.be/2cOE-pFrud8 Free version works only for GBPNZD
FREE

Marginhedged 信息指标。 手数 - 设置计算所需的手数,使用输入字段设置 MARGININIT - 指定手数的初始保证金要求 MARGINHEDGED - 从每组重叠订单中收取的保证金 PERCENT - 以百分比表示的重叠订单收取的保证金 指标设置说明: _color - 设置颜色 使用指标的示例:
在市场上开设了一个手数为 1 的买入头寸,这种情况下的保证金要求对应于 10 美元
如果您开一个手数为 1 的卖出头寸,现在的总保证金要求为 5 美元,
或 50%。
该指标显示给定批次的此信息。 信息指标。 手数 - 设置计算所需的手数,使用输入字段设置 MARGININIT - 指定手数的初始保证金要求 MARGINHEDGED - 从每组重叠订单中收取的保证金 PERCENT - 以百分比表示的重叠订单收取的保证金 指标设置说明: _color - 设置颜色 使用指标的示例:
在市场上开设了一个手数为 1 的买入头寸,这种情况下的保证金要求对应于 10 美元
如果您开一个手数为 1 的卖出头寸,现在的总保证金要求为 5 美元,
或 50%。
该指标显示给定批次的
FREE

Based on a combination of indicators, PS Acid Fulx is an excellent indicator for knowing when to buy or sell on any asset and temporaryity. The indicator myself I have used it as a tool for my analysis when trading Forex. It is a useful and easy-to-understand trend indicator. If you combine it with your own analyses you will surely get a good result in your operation.
FREE

Shows on the chart a two moving averages histogram. It allows to send alerts to MetaTrader platform when the crossovers occurs. You can use it on any timeframe, moving averages settings can be adapted as well as the appearance and colors.
The parameters for the indicator are Fast moving average period Slow moving average period Moving Average Mode Moving Average Price Alert on crossovers Histogram Bar Width Bullish Color Bearish Color
FREE

An improved version of the standard Standard Deviation indicator.
It is now a responsive and smoothed line.
The setup is not straightforward - but I hope you can do it.
It is very easy to understand the readings of this indicator, the meaning is the same as that of the usual Standard Deviation.
//////////////////////////////////////////////// ///////////////////////////////////
I hope this indicator will be very useful to you in successful trading.
Good luck.
FREE

VisualOrders and InfoAccount - an indicator for analyzing your own trading or analyzing someone else's account.
Additionally, there is a possibility to quickly obtain information on the account and the terminal. Information is placed both on the chart and in the Experts tab.
All displayed information is disabled in the settings, allowing the trader to leave only the necessary information.
FREE

free only until the end of the week
The following indicator must be used and contextualized according to your trading methodologies. It provides excellent trading insights and identifies rejection zones on the drawn lines. Several parameters can be customized. The indicator will plot three levels above and below the opening price on D1, W1, and MN1. It will provide the daily ADR and display two additional daily sessions (EUROPE session and USA session). The colors of the various lines can be cu
FREE

This indicator calculates average speed of moving average indicator. Here is parameters: BarsToProcess - indicator calculating period; MaPeriod - period of Moving Average indicator; AveragingPeriod - period (MA values) of the basis of which the average value is calculated; MA_Method, MA_Apply_to - using to set MA indicator parameters; Thats all! Good luck.
FREE

Spin is an intrinsic form of angular momentum carried by elementary particles, composite particles (hadrons), and atomic nuclei.
Spin is one of two types of angular momentum in quantum mechanics, the other being orbital angular momentum. The orbital angular momentum operator is the quantum-mechanical counterpart to the classical angular momentum of orbital revolution and appears when there is periodic structure to its wavefunction as the angle varies.For photons, spin is the quantum-mechanical
FREE

Adaptiv Ma это индикатор средняя линия значение которой выставляется в меню и применяется на тейфрейме Н4. В последствии она адаптируется к выбранному определенному таймфрейму. В меню индикатора задаются следующие параметры 1. Период индикатора 2.Метод определения Ма. 3. Стиль Ма. 4.Толщина линии Ма. 5.Цвет линии Ма.
При переключении между таймфреймами автоматически переключается значение периода Ма для адаптации к новому таймфрейму. Пишите насколько вам была полезен такой индикатор.
FREE
Nombre del Indicador: Two Lines Color 1 Telegran:13 Crow Trading Club
Descripción: Este indicador personalizado para MetaTrader 4, "Two Lines Color 1", es una herramienta de análisis técnico diseñada para ayudarte a identificar oportunidades de trading en los mercados financieros. Este indicador utiliza dos Medias Móviles Simples (SMA) de diferentes períodos y las representa en el gráfico con dos líneas de colores distintos.
Las características clave de este indicador son las siguientes:
Rá
FREE

Magneto Power MA - трендовый осциллятор. Основан на классическом индикаторе moving average, но при этом имеет нестандартный способ интерпретации. Здесь нет никаких фокусов с пересечениями мувингов, только гибридная работа MA и волатильности инструмента. При этом при должной настройке может составить конкуренцию дорогим и сложным аналогам. По гистограмме индикатора легко определить текущую тенденцию, а так же исчерпало себя движение цены или ещё нет. Настройки индикатора аналогичны классическому
FREE

WONNFX create arrow tester. Сonstructor/Tester. Tester for buffer indicators. Converting a buffer indicator into an arrow signal on the chart. Combining two buffer indicators into one arrow signal. Filter by candle color. You can move the arrow signal several bars forward (useful in cases where the indicator gives signals 2-3 bars late
"WONNFX create arrow tester" is a tool designed specifically for traders who use buffer indicators in their trading strategies. This tester converts the buffer
FREE
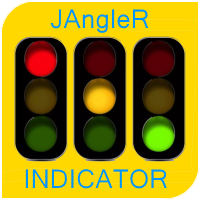
The oscillator indicator " JAngleR " is one of a series of three calculators of the angular deviation of the price chart of a trading instrument.
INPUT PARAMETER: DRAWs =128 - Number of bars to display the indicator in the chart history; Period_IND =14 - calculation period of the indicator in the number of bars; ma_period =1 - Moving Average Period; ma_method =MODE_SMA - moving Method; applied_price =PRICE_CLOSE - applied Moving Average Price. The values of the indicator indicators are degrees
FREE

这个指标可以用来衡量主要货币的相对强弱。在设定的时间周期内,相对较强的货币分值较高,相对较弱的货币分值较低。 指标的设置选项 Strength Period - 更改Strength Period(力度计算周期)会影响到计算的蜡烛数量,从而影响计算结果。较高的值让指标表示的线条较为平滑,而且指标的结果会表现出各个货币更长时间里的相对强度,而不是最近的强度。 Display Options - 设置视觉呈现的偏好(show strength/weakness/kebab) "show strength" 模式,越强的货币分值越高,最弱的货币是0分。 "show weakness" 模式,越弱的货币分值越低,最强的货币是0分。 "show kebab"模式,越强的货币分值越高,平均强度分值为50分。 参照这个指标,你不仅可以用它交易主要货币对,也可以用来交易各种不同的交叉对。 基本上扫一眼能大略看懂目前各种货币的相对强弱。 如果指标没有正确载入,可以多次切换不同周期来刷新。 默认状态下指标的固定最大值和最小值是可以更改的。可以根据喜好改变指标里每种货币表示的线型和颜色。
FREE
Standard deviation with levels is a modification of the Standard deviation indicator, supplemented by the levels of expected Highs and Lows. The levels are plotted using the Support and resistance bands indicator, which determines the High and Low levels nearest to the current indicator value based on the historical values of the extremes.
Parameters standard deviation period - period of the standard deviation indicator. extremum detector period - period of extremum detection. This parameter
FREE

GBP INDEX
The Currency Index Project is ONE part of a thorough Forex study. Many people do not know the theoretical basis that drives currency exchange rates to move on the market. With this set of tools you will be able to have a more complete view of the entire market by analyzing not only the single currency of an exchange, but all the exchange rates that make up that currency by looking at a single window!
The indicator faithfully represents the real index of a single currency present in a
FREE
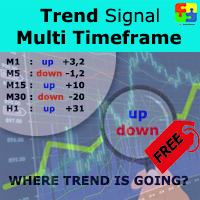
Free version. Only works on EURUSD. Do you want to always know in a quick glance where price is going? Are you tired of looking back and forth between different timeframes to understand that? This indicator might just be what you were looking for. Trend Signal Multitimeframe shows you if the current price is higher or lower than N. candles ago, on the various timeframes. It also displays how many pips higher or lower current price is compared to N. candles ago. Number N. is customizable The dat
FREE
MaSonic MT4 日本語バージョン
このインジケーターはチャート上の任意のポイントをクリックすると、そのポイントを通る移動平均 (MA) をすばやく検索、表示できます。
特徴: 簡単な操作: MA を見つけたい任意のポイントをクリックします。 即時結果: 一致する MA が見つかった場合は表示します。 スリープ機能: 使用していないときにボタンを非表示にして、インターフェースをすっきりさせます。 手動制御: 画面上のボタンを使用して MA を手動で調整します。 MA を固定: MA を発見したら、検索とは関係なくその場所に固定できます。 スキャン ボタン: 1 回のクリックでプロセスを開始します。 今すぐ MA 検索のスピードと使いやすさを体験してください。
---------パラメータ設定---------- MA設定: 移動平均線の種類 MA最小値 MA最大値 マニュアルモードのMA初期値 MAが表示されていない場合に適用されます。 MAの色 MAのスタイル MAの太さ 表示したMAを固定表示、それを消去するキー 検索した MA の固定表示を切り替えるキー。
FREE
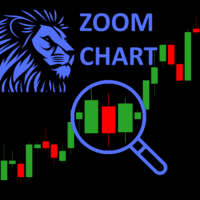
The ZoomChart indicator displays data from other timeframes on the current chart in the subwindow, acting as a magnifying glass or, conversely, shrinking the chart to display larger timeframes.
The ZoomChar indicator automatically tracks the current outermost bar on the chart and moves with the chart as it shifts.
The indicator can display data from another financial instrument, not limited to the main chart instrument.
The robot carries the function of “mirroring” - The ability to convert c
FREE

Arlene Sessions Background is an indicator that draws colored vertical background on the chart depending on your session. You can see the version 1 here: https://www.mql5.com/en/market/product/68822 You can see more of my publications here: https://www.mql5.com/en/users/joaquinmetayer/seller If you only want to paint a session on your chart, you must set the color "none" to deactivate it.
FREE

The Hong Kong Stock Exchange Session's Hours
This indicator facilitates observing the currency pair's quotations during subsequent parts of the stock exchange session live. Before the session starts, a rectangle is drawn on the chart but not filled in with color. It means the extent of the session duration. Before the first bar enters the rectangle of the session, a sound signal or pop-up window will notify us that the session will just start. When the price graph crosses the edge of the sessi
FREE
Parabolic Sar easy mode, remake the original p.sar indicator making it more easy to read for novicians traders and experimented traders looking to reduce the time analizing the charts, you can make your own strategy modificating the periods and fusioning it with others indicators like RSI ,stochastic or what you want,its one indicator runs better on high time charts like H4 or D1.
FREE
CandleCloseCountdown is technically an indicator. Its purpose is to show the time a candle has left on a given timeframe before it closes. All possible time frames of MetaTrader 4 are supported. The way the remaining time is displayed depends on the selected timeframe. For M1 only the seconds are displayed. Above that at all timeframes up to H1 the remaining minutes and seconds are displayed and so on for timeframes above D1.
FREE
Version History Date Version Changes 07/09/2022 1.10 Initial released Description The RedeeCash RSI is your typical RSI indicator with the three latest RSI calculations exposed as global variables for easier integration with scripts and expert advisors. Code Sample To invoke this indicator from an EA or script, call the iCustom metatrader function, iCustom ( Symbol (), PERIOD_CURRENT , "Market/RedeeCash RSI" , 14 , 1 , 0 ); string RSIVarName = StringConcatenate ( Symbol (), "_rsi" ); string RSIP
FREE

Indicator for fast navigation through financial instruments. When you click on the button, you go to the chart of the financial instrument, the name of which was written on the button. In other words, the indicator opens or unfolds an existing chart window. For each chart, you can customize the name of the financial instrument, text color and background color; in total, you can customize symbols buttons that you trade often. The indicator can be installed on any charts for which you need to swit
FREE

NZD INDEX
The Currency Index Project is ONE part of a thorough Forex study. Many people do not know the theoretical basis that drives currency exchange rates to move on the market. With this set of tools you will be able to have a more complete view of the entire market by analyzing not only the single currency of an exchange, but all the exchange rates that make up that currency by looking at a single window!
The indicator faithfully represents the real index of a single currency present in a
FREE
您知道为什么MetaTrader市场是出售交易策略和技术指标的最佳场所吗?不需要广告或软件保护,没有支付的麻烦。一切都在MetaTrader市场提供。
您错过了交易机会:
- 免费交易应用程序
- 8,000+信号可供复制
- 探索金融市场的经济新闻
注册
登录