 MetaTrader 5
 专家
专家
 指标
指标
 程序库
程序库
 实用工具
实用工具
 窗口小部件
窗口小部件
 规则
规则
适用于MetaTrader 4的技术指标 - 163
 下面列出的技术指标信号对MetaTrader 4平台的开仓交易和平仓交易起着至关重要的作用。
指标的本质就是一种交易品种的数学转换,旨在预测价格变化。
下面列出的技术指标信号对MetaTrader 4平台的开仓交易和平仓交易起着至关重要的作用。
指标的本质就是一种交易品种的数学转换,旨在预测价格变化。 
适用于 MT4 的 Crypto_Forex 指标 HTF 移动平均线。
- 使用专业的 MT4 HTF 移动平均线指标升级您的交易方法。HTF 代表“更高时间框架”。 - 该指标非常适合趋势交易者进行价格行动入场。 - HTF 移动平均线指标允许您将更高时间框架的移动平均线附加到当前图表,以便跟踪主要趋势方向。 - 指标显示更高时间框架的趋势 --> 这始终是一种盈利方法。 - HTF 移动平均线指标让您有机会以低风险获得高额利润。
使用方法: - 将日线移动平均线附加到四小时或一小时图表。 - 将四小时移动平均线附加到一小时、三小时或十五分钟图表。 - 等等(参见图片)。 ........................................................................... 点击这里查看高质量的交易机器人和指标! 这是仅在 MQL5 网站上提供的原创产品。

适用于 MT4 平台的加密货币/外汇“TREND Histogram”(趋势直方图)指标,无重绘(不闪烁)。 - “TREND Histogram”指标比任何标准的移动平均线(MA)交叉信号都更灵敏、更高效。 - 该指标包含两种颜色:黄色(金色)代表看跌趋势,绿色代表看涨趋势(颜色可在设置中更改)。 - “TREND Histogram”内置了移动端和电脑端提醒功能。 - 建议将此指标与其他交易方法(如价格行为/Price Action、VSA、其他指标等)结合使用。 - 该直方图指标是结合了价格与成交量数据并将其转化为单一数值的顶级指标之一。 Click here to see high quality Trading Robots and Indicators! 这是仅在 MQL5 网站上提供的原创产品。

适用于MT4的加密货币外汇指标 “Micro M and Micro W patterns Pro” ,无重绘,无延迟。
- “Micro M and Micro W patterns Pro”指标是一款功能强大的价格行为交易指标。 - 该指标可检测图表上的Micro M和Micro W形态: - 看涨Micro W形态 - 图表上的蓝色箭头信号(见图)。 - 看跌Micro M形态 - 图表上的红色箭头信号(见图)。 - 内置PC和移动设备警报。 - “Micro M and Micro W patterns Pro”指标非常适合与支撑/阻力位结合使用。 - 可用于任何时间周期。 - 该指标是检测趋势变化或趋势修正结束的绝佳指标。 - 指标带有信息显示功能 - 显示所关联外汇货币对的当前点差和隔夜利息。 - 显示内容还包括账户余额、净值和保证金。 - 信息显示可以放置在图表的任意角落 .
点击这里查看高质量的交易机器人和指标! 这是仅在 MQL5 网站上提供的原创产品。

Crypto_Forex 指标移动平均线加速度适用于 MT4,无需重绘。
MA 加速度 - 是剥头皮指标,设计为“MA 速度”指标的辅助工具
- 该指标的计算基于物理方程。它将向您显示移动平均线的加速度。 - 有很多机会使用 MA 加速度升级标准策略。它可以用于 SMA、EMA 和 LWMA。 - MA 加速度是相应移动平均线的二阶导数。 - 指标显示 MA 速度指标改变其值的速度。 - 如果 MA 加速度指标的值 < 0:MA 速度在看跌方向上增加;如果 MA 加速度指标的值 > 0:MA 速度在看涨方向上增加。 - 建议在主要趋势方向的快速剥头皮策略中将 MA 加速度指标与 MA 速度指标一起使用,如果 MA 速度指标的值 < 0:趋势下降;如果 MA 速度指标的值 > 0:趋势上升。 - 上升趋势:一旦 MA 加速度 >0,开启买入剥头皮交易。 - 下降趋势:一旦 MA 加速度 <0,开启卖出剥头皮交易。
参数: 1) Period_V:相应 MA 速度指标的周期。建议值为 3 到 7。 2) Period_ACC:加速周期。建议值为 2 到 12。Period_ACC

适用于 MT4 的 Crypto_Forex 指标 CCI HTF 振荡器。
- 使用适用于 MT4 的专业 CCI HTF 振荡器升级您的交易方法。HTF 表示“更高时间框架”。 - 商品通道指数 (CCI) 衡量当前价格与历史平均价格之间的差异。 - 重要级别:+/-100。 - 非常适合在 +100 以上区域进行卖出,在 -100 以下区域进行买入。 - 该指标非常适合结合价格行动入场的多时间框架交易系统,或与其他指标结合使用。 - CCI HTF 振荡器指标允许您将更高时间框架的 CCI 指标附加到您当前的图表中。 - 指标内置移动端和 PC 端警报。
Click here to see high quality Trading Robots and Indicators! 这是仅在 MQL5 网站上提供的原创产品。

NIXBOT AI – UranoTrader NIXBOT AI is an advanced trading analysis system designed for traders who want to go beyond traditional indicators and operate based on probability, statistics, and strategic intelligence .
Developed for MetaTrader 4 and 5 , NIXBOT AI integrates a robust set of automated strategies capable of analyzing market behavior in real time, identifying recurring patterns, and selecting the best trading opportunities. More than just an indicator, NIXBOT AI acts as a true decision

TTS Fibonacci Stop drawing fibs by hand. TTS Fibonacci finds the swing, plots every level, calculates your targets, sizes your lot, and scans all 28 pairs — automatically. Drop it on any chart and it works. The indicator detects the highest high and lowest low within your lookback range, draws 10 retracement and extension levels from 0% to 161.8%, and highlights the golden zone so you can see where price is sitting at a glance. Press V to flip between buy and sell setups. Everything recalculates

Zero Lag Trend Signals MT4
Zero Lag Trend Signals is a technical trend-following indicator designed to assist traders in analyzing potential market direction by focusing on minimizing calculation lag. Utilizing the ZLEMA (Zero Lag Exponential Moving Average) and dynamic volatility bands, the indicator provides a visual representation of the current trend state and generates structural chart markers.
Features • Low-lag trend calculation methodology • Visual bullish and bearish trend bands for

Malaysian SNR (Support & Resistance) Indicator for MT4 Malaysian SNR is a support and resistance indicator designed to help traders identify key price levels on the chart. It automatically plots important zones based on market structure, making it easier to read price movements and potential reaction areas. The indicator displays support (green), resistance (red), and intermediate levels (OCL) to give a clearer view of price behavior. It is suitable for traders who rely on price action and multi

这是一份为MQL5市场准备的指标销售文案。文案风格侧重于**视觉吸引力、实用价值和高胜率**,完全避开了代码逻辑,重点突出了您要求的“界面直观”和“实时提示”特性。
---
# Super Trend Advanced v2.00 **—— 智能捕捉趋势,让交易决策一目了然**
### 产品概述 Super Trend Advanced 是一款经过深度优化的新一代趋势跟踪指标。它不仅仅是一条简单的通道线,更是融合了智能信号过滤与账户实时监控的全能型交易助手。无论您是短线剥头皮交易者,还是波段持仓爱好者,该指标都能为您提供清晰、直观且高胜率的交易指引。
### 核心优势
#### 1. 极致直观的视觉体验 告别复杂的图表分析,Super Trend Advanced 采用**双色动态线条**设计: - ** 红色支撑线:** 代表多头趋势。当价格位于红色线之上时,市场处于强势上涨区。 - ** 蓝色压力线:** 代表空头趋势。当价格位于蓝色线之下时,市场处于弱势下跌区。 两条线条在图表上清晰分明,无任何滞后杂讯,让您一眼看穿当前市场的“主色调”。
####

限时优惠
“限时发布价格”
“2.0版本后将涨价” Currencies Gold Momentum Flow Dashboard
— 即刻洞察市场强弱 一款强大的多合一交易面板,实时显示外汇与黄金在多个时间周期(M5–D1)的动量。 多时间周期ROC分析
内置交易信号(趋势一致与动量变化)
货币强弱指标
热力图快速识别趋势
实时提醒 + 一键切换交易品种 无需来回切换图表 — 一个界面掌握整个市场。 像真正看懂市场一样交易 大多数交易者是“盲目的”。 他们不断切换图表…
追逐信号…
入场太晚…离场困惑。 这一切,到此为止。 看到别人看不到的机会 这不仅仅是一个指标。 这是一个“市场透视系统”,帮助你看到: 哪些交易对正在爆发 哪些货币正在主导市场 哪些高概率机会正在形成 为精准交易者打造 提前捕捉动量变化
确认多周期趋势一致
避免震荡行情
专注高质量机会 内置优势 智能信号系统
货币强弱分析
热力图分析
实时提醒
一键执行 彻底改变你的交易方式 交易什么
何时交易
哪个方向概率最高 ️ 大多

ForecastPro is a price projection indicator based on historical pattern similarity. In simple terms, it searches for past price segments that closely resemble the current price pattern, then “borrows” the subsequent movement from that historical pattern and projects it forward. Key Features Data Source You can choose which price series is used for matching: Open, High, Low, Close, HL2, HLC3, or OHLC4. The better the source matches your analysis style, the more relevant the results. Training Data

外汇指标“INFO 价差掉期显示”适用于 MT4,交易辅助工具。 ....................................................................... - INFO 价差掉期显示指标显示其所附外汇对的当前价差和掉期。 - 它还显示账户余额、净值和保证金。 - 可以将指标值定位在图表的任何角落 . - 也可以设置颜色和字体大小。 ............................................................................ Click here to see high quality Trading Robots and Indicators! 这是仅在 MQL5 网站上提供的原创产品。

Crypto_Forex MT4 版“倒锤子形态”指标,无需重绘,无延迟。 ......................................................................... - “倒锤子形态”指标是价格行为交易的强大指标。 - 指标可检测图表上的看涨倒锤子形态:图表上显示蓝色箭头信号(见图)。 - 支持 PC、手机和电子邮件提醒。 - “倒锤子形态”指标非常适合与支撑/阻力位结合使用。 ........................................................ 点击这里查看高质量的交易机器人和指标! 这是仅在 MQL5 网站上提供的原创产品。
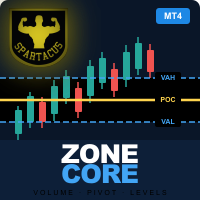
ZONECORE — Volume Profile & Pivot Levels 以外科手术般的精准度识别成交量最集中的价格区域。 MT5 version
什么是 ZONECORE? ZONECORE 是一款专业级指标,将 成交量分布(Volume Profile) 与 高成交量枢轴位(Pivot Levels) 相结合,揭示市场停留时间最长、成交量最大的价格区域。这些区域对价格具有强大的吸引力——掌握它们,让您在识别支撑位、阻力位及高概率反转区域时占据决定性优势。 3 个独立计算模式 ZONECORE 提供三个完全独立的模式,可同时启用: Period 模式 — 基于可配置的 K 线数量(默认 200 根)计算成交量分布。非常适合波段交易和日内分析。 Daily 模式 — 基于当前交易时段计算,支持自定义开始和结束时间。专为在特定市场窗口内操作的日内交易者设计。 Previous Day 模式 — 计算前一交易日(D-1)的成交量分布,并以虚线延伸至当日。对于识别昨日至今仍有效的关键价位不可或缺。 每个模式均拥有独立的配色方案,完全可自定义。 显示的关键价位 POC(控制点) —

SMC Pro is a professional Smart Money Concepts indicator designed to help traders read market structure with precision and clarity. It visualizes the core principles used by institutional trading such as Break of Structure (BOS), Change of Character (CHoCH), internal and swing structures, and key liquidity zones directly on the chart in real time. Pricing Launch Price : $33 Incremental Price Increase : The price will increase by $10 after every 10 purchases. Final Price : $69 The indicator autom

ICT Killzones & Pivots Pro is a powerful trading indicator designed to visualize the most important intraday sessions and liquidity zones used by professional traders. It automatically highlights key trading periods such as Asia, London, and New York sessions, allowing traders to clearly see when market activity and volatility are at their highest. Pricing Launch Price : $33 Incremental Price Increase : The price will increase by $10 after every 10 purchases. Final Price : $69 The indicator draw

Support Resistance Pro Toolkit is a professional support and resistance indicator built on advanced Donchian structure logic, designed to provide a clear and structured view of market behavior. It automatically detects key support and resistance zones, tracks their evolution over time, and highlights how price interacts with these levels through sweeps, breakouts, and retests. Pricing Launch Price : $33 Incremental Price Increase : The price will increase by $10 after every 10 purchases. Final P

FOREX MAESTRO INDICATOR USER MANUAL
Introduction Welcome to the FOREX MAESTRO INDICATOR , a powerful next-generation trading intelligence system designed to completely transform how traders analyze, interpret, and execute trades across the financial markets. This is not just an indicator — it is a complete market decision framework that combines: Multi-timeframe signal analysis AI-powered market bias interpretation Institutional-style trend channel mapping Spread & volatility execu

The "MR Volume Profile 4" indicator is a charting tool that displays trading volume at different price levels rather than time intervals. A key concept in volume profile is the point of control (POC)—the price level with the highest volume traded during the session or time range. While tools like VWAP or OBV provide volume trends, the "MR Volume Profile 4" indicator offers granular detail about where the most market activity occurs at specific price levels. This makes it a more precise tool for

适用于MT4平台的加密货币外汇指标“盘整柱专业版”。无重绘,无延迟。
- “盘整柱专业版”指标是一款功能强大的突破导向型价格行为交易指标。 - 该指标可检测单根K线内的价格盘整区域,并显示:突破方向、挂单位置和止损位置。 - 看涨盘整柱 - 图表上的蓝色箭头信号(见图)。 - 看跌盘整柱 - 图表上的红色箭头信号(见图)。 - 高盈亏比(R/R)。 - 支持PC和移动设备提醒。 - “盘整柱专业版”指标非常适合与支撑/阻力位结合使用。 - 该指标带有信息显示功能,可显示其所关联外汇货币对的当前点差和隔夜利息。 - 信息显示功能还显示账户余额、净值和保证金。 - 信息显示功能可放置在图表的任意位置。
Click here to see high quality Trading Robots and Indicators! 这是仅在 MQL5 网站上提供的原创产品。

Crypto_Forex 指标“DeMarker 平移检测器”是一款高效的交易辅助工具!无需重绘。 我推荐您使用这款出色的 MT4 指标来升级您的交易方法。
- 指标在图表上显示价格平移区域。它具有“平移灵敏度”参数,用于平移检测。 - “DeMarker 平移检测器”可用于价格行动入场确认,或与其他指标结合使用。 - 您可以将其用于趋势跟踪系统,以检测平移区域并避免在该区域交易。 - 您可以将其用于反转剥头皮交易 - 从平移边界进行反转交易。 - 有很多机会可以使用“DeMarker 平移检测器”替代标准的 DeMarker 震荡指标。 - DeMarker 本身能够提供最有效的常规背离信号,是其他震荡指标中最为有效的。 - 当 DeMarker 高于 0.7 时,表示超买;当 DeMarker 低于 0.3 时,表示超卖。
点击这里查看高质量的交易机器人和指标! 这是仅在 MQL5 网站上提供的原创产品。

Omega Strike v4.0.3 Indicator is a multi-component trading system that combines filters based on Alligator, Stochastic, MACD, ATR, volume, candle body size, Price Action, RSI divergences and multi-timeframe analysis. The signals are generated when several conditions match, and the signal strength is expressed as a percentage. Built-in modules for money management (martingale), statistics, time filters, advance alerts and dynamic expiration.
Strengths 1. Multi-level signal filtering A com

Our offer also includes a free panel — Indicator Panel — which allows you to show or hide indicators created by BOToBRACIA -> MT4 / MT5 Our offer also includes a version for MetaTrader 5 -> https://www.mql5.com/en/market/product/171230?source=Site+Market+My+Products+Page
FVG is a practical technical analysis indicator that automatically detects and marks Fair Value Gaps (Imbalances) — areas of market inefficiency formed during strong price impulses. These zones are updated in real time an

Our offer also includes a free panel — Indicator Panel — which allows you to show or hide indicators created by BOToBRACIA -> MT4 / MT5 Our offer also includes a version for MetaTrader 5 -> https://www.mql5.com/en/market/product/171232?source=Site+Market+My+Products+Page
HTF Candles is a practical technical analysis indicator that plots candles from a selected higher timeframe directly on your chart. It displays both the candle body and wicks, allowing you to see the full price structure

Our offer also includes a free panel — Indicator Panel — which allows you to show or hide indicators created by BOToBRACIA -> MT4 / MT5 Our offer also includes a version for MetaTrader 5 -> https://www.mql5.com/en/market/product/171235?source=Site+Market+My+Products+Page
The Supply and Demand Zones Indicator is a practical technical analysis tool that automatically detects Supply and Demand zones and plots them on the chart. Each zone remains active until it is fully filled by price. The

MQL5 博客: https://www.mql5.com/en/blogs/post/768823
MT4 版本: https://www.mql5.com/en/market/product/171247
MT5 版本: https://www.mql5.com/en/market/product/171248
斐波那契投影 [tambangEA] 是一款专业的仪表盘式交易分析工具,旨在帮助交易者直接在图表上识别市场结构、斐波那契投影目标、成交量反应区和方向延续区域。
该工具可自动检测最新的波动结构,构建基于斐波那契的投影水平,突出显示控制点区域,并显示斐波那契带的增量信息。它专为希望以清晰、结构化和可视化的方式解读市场走势,而无需手动绘制每个斐波那契投影的交易者而设计。
此工具的创建原因
许多交易者会手动使用斐波那契水平线,但手动预测可能速度较慢、结果不稳定且主观性较强。
此工具通过自动显示以下内容来简化流程:
最新的波动结构
斐波那契回撤和预测水平线
0.618 区域的 C 点预测
T1、T2 和 T3 目标区域
POC 和成交量分布区域
基于斐波那

Crypto_Forex 指标 ENGULFING Bar Pattern 适用于 MT4,无需重绘,无延迟。
- “ENGULFING Bar” 指标是一款非常强大的价格行为交易指标。 - 指标可检测图表上的 ENGULFING Bar 形态: - 看涨 ENGULFING Bar - 图表上显示蓝色箭头信号(见图)。 - 看跌 ENGULFING Bar - 图表上显示红色箭头信号(见图)。 - 提供 PC、手机和电子邮件提醒。 - “ENGULFING Bar Pattern” 指标非常适合与支撑/阻力位结合使用。
Click here to see high quality Trading Robots and Indicators! 本产品为独家产品,仅在本 MQL5 网站上提供。

Full Product Description Reversal Edge Nexus is a reversal-focused trading indicator built for traders who want cleaner entries, faster decision-making, and stable signal logic without visual noise. The indicator is designed to detect market exhaustion, flush reversals, and confirmed turning points using a structured multi-engine approach. It can work with the classic reversal engine, the extreme flush engine, or both together, depending on the trader’s style and market conditions. Unlike many i

TTS Zones Still eyeballing support and resistance or drawing lines manually? TTS Zones finds the zones, plots them on your chart, calculates your lot size, tracks how many times each zone was tested, and tells you exactly where price sits between support and resistance — automatically. Drop it on any chart and it works. The indicator scans your price history for pivot highs and lows, builds supply and demand zones from the close prices of extreme bars, and draws them as colored rectangles direct

Market Session PRO MT4 – Smart Session Visualization Boxes
Market Session PRO MT4 is a powerful and lightweight indicator designed to help traders clearly visualize the major forex trading sessions directly on your charts. This tool automatically highlights the Tokyo, London, and New York sessions, allowing you to better understand market behavior, volatility, and key trading opportunities. Key Features: Automatic Session Detection
Accurately plots Tokyo, London, and New York sessions using au

SMC Market Structure Pro is the advanced version of SMC Market Structure, built for traders who want deeper structural analysis, multi-timeframe context, and real-time notifications — all from a single indicator. Free Lite version
MT5 version What it detects
The indicator automatically identifies and draws: Break of Structure (BoS) – Signals trend continuation Change of Character (CHoCH) – Indicates a potential trend reversal Internal BoS (iBoS) – Break of structure within the current s

The indicator's source code is for sale; those interested can contact me via PM. Supply & Demand Retest Alert – Institutional Trading Simplified Supply & Demand Retest Alert (MT4) is a precision-driven trading tool designed for traders who focus on institutional price behavior and high-probability market zones. Built on the core principles of supply and demand trading, this indicator automatically identifies key imbalance areas where strong buying or selling previously occurred—zones where price

Индикатор TA Inspector - инструмент, который позволит улучшить анализ рынка и поможет определить дальнейшее движение цены на основе геометрических построений и ориентацию целей ценового развития. Индикатор производит самостоятельно построение трендовых линий и предполагаемого расчетного уровня окончания тренда (HP / Hypothetical Point). Индикатор выполняет автоматическое построения моделей метода Tactica Adversa. С точки зрения Tactica Adversa движение цены представляет собой последовательную см

Premium MT4 Custom Indicator: Agil Yahya Trend Filter – Boost Your Trading Accuracy with Trend-Based Signals! The Agil Yahya Indicator is an analytical tool for the MetaTrader 4 (MT4) platform, specifically designed to capture the best trend opportunities in the Forex market. Built using an enhanced core Trend algorithm, this indicator combines price volatility calculations and rigorous trend filtering to provide sharp, accurate Entry signals. Key Product Features: Advanced Trend Algorithm:

Check screenshot friendly beginner guide how to use + cheat sheet!!!
A professional analysis EA that monitors ALL your open trades and tells you which to hold, watch, or close - before it's too late.
Every few seconds, the EA scores each trade from 0-100 across 6 dimensions: Trend, Momentum, Price Action, Volume, Risk, and Correlation. Each trade gets a clear verdict: STRONG HOLD, HOLD, WATCH, CLOSE, or EXIT NOW.
A proprietary Early Warning System that detects momentum acceleration, in

Sunda Nuswantara OS - The Ultimate AI Trading Co-Pilot HEADLINE & HOOK Stop Trading Blindly! Are you tired of buying at the exact top and selling at the absolute bottom? Most traders fail because they only look at the price direction, completely ignoring the market's "Fuel Capacity" (Daily Range) and "Speed" (Volatility Momentum) . Meet Sunda Nuswantara OS , a revolutionary 3-Dimensional AI Trading Co-Pilot. This indicator doesn't just show you arrows; it actively reads the market's momentum, ca

CRT Master Indicator identifies market structure cycles based on Candle Range Theory (CRT) and institutional order flow principles: Accumulation, Manipulation, and Distribution. The indicator identifies range sweeps (liquidity grabs) where price manipulates past structural high/low levels before closing back inside the range. It provides visual zone mapping and multi-timeframe context through Ghost Candles. An automated trading version of this logic is available as the CRT Master EA on my MQL5 p

ProEdge ROC MTF Momentum MT4 多时间框架动量信号指标 ProEdge ROC MTF Momentum MT4 是一款专业交易指标,通过多时间框架 ROC 分析识别高概率 BUY 和 SELL 信号。 它结合动量、趋势一致性和信号评分,过滤低质量交易。 优势 普通指标: 单一时间框架 信号噪音大 ProEdge: 分析 M5、M15、H1、D1 信号评分(0–100) 趋势确认 减少噪音 信号 BUY 78 → 强势上涨 SELL 64 → 中等下跌 可设置最低评分。 ️ 功能 多时间框架分析
信号过滤
清晰界面
不重绘
实时模式
仪表盘 适用 短线交易 日内交易 使用方法 等待:
多时间框架一致
分数 ≥ 60
明确信号 ️ 注意 不保证盈利。

Route Lines Prices - 是一款用于寻找价格方向的指标。其简洁的界面包含多种价格行为和未来方向计算算法。这些算法包括基于所用时间周期的波动率计算和价格平滑。
该指标只有一个参数,用于更改“ Calculating price values ”。默认值 1 提供均衡的自动计算,
无需手动配置即可使用。
通过手动更改 2 到 500 之间的值,您可以根据自己的交易系统自定义指标。
建议在 M1 到 H4 的时间周期内使用此指标。适用于任何交易品种。
信号箭头在蜡烛图收盘时生成;不会重绘历史数据。
主图表上提供重复箭头。
提供多种类型的警报。内置的线轨迹计数器基于收盘价工作。这意味着,当出现相反信号时,会确定价格轨迹的数值,并在信号结束后的下一根蜡烛图上显示这些数值。
总计数器将获得的值相加,以便在相应的图表上方便地调整参数。

适用于 MT4 的 Crypto_Forex 指标“HTF 移动平均线交叉”。 ...................................................................... - 使用强大的 MT4 HTF 移动平均线交叉指标升级您的交易方法。HTF 意味着更高的时间框架。 - 该指标非常适合趋势交易者,尤其适合价格行动入场。 - 它允许您将更高时间框架的快速和慢速移动平均线附加到您当前的图表中 --> 这是专业的方法。 - HTF 移动平均线交叉内置移动端和 PC 端警报。 - 该指标让您有机会以低风险获得可观的利润。 .................................................... 点击这里查看高质量的交易机器人和指标! 这是仅在 MQL5 网站上提供的原创产品。

Crypto_Forex 指标“价格行为过滤直方图” - 是价格行为交易的有效辅助交易工具!无需重绘。
- 该指标向交易者建议入场方向。然后交易者只需在该方向搜索价格行为信号即可。 - 价格行为过滤直方图应与价格行为模式和支撑/阻力位相结合。 - 绿色直方图 - 寻找买入入场。 - 红色直方图 - 寻找卖出入场。 - 使用此指标,有很多机会升级标准策略。 - 指标内置移动和 PC 警报。 ................................................................................................................. 点击这里查看高质量的交易机器人和指标! 这是仅在此 MQL5 网站上提供的原创产品。

适用于MT4平台的加密货币外汇指标“修正突破专业版”,无重绘,无延迟。
- “修正突破专业版”指标是一款功能强大的价格行为交易指标,具有很高的盈利潜力。 - 该指标可检测价格修正后的看涨和看跌突破柱: - 看涨修正突破形态 - 图表上的蓝色箭头信号(见图)。 - 看跌修正突破形态 - 图表上的红色箭头信号(见图)。 - 支持PC和移动设备提醒。 - “修正突破专业版”指标非常适合与支撑/阻力位结合使用。 - 指标带有信息显示功能 - 显示所关联外汇货币对的当前点差和隔夜利息。 - 信息显示还显示账户余额、净值和保证金。 - 信息显示可以放置在图表的任意位置 .
Click here to see high quality Trading Robots and Indicators! 这是仅在 MQL5 网站上提供的原创产品。

一款信号统计指标(MT4)——实现基于当前图表周期下的单线MA转向和双线MA金叉/死叉统计 . 转向定义:前一K向下或走平,当前K向上,视为转向向上;反之,转向向下。
金死叉定义:前一K快线在慢线下方,当前K快线在慢线上方,为金叉;反之,死叉。
参数及使用说明:
1、可指定统计K线数。
2、可指定4个不同的日内时间段,格式如"03:00-07:59",4个时间段可交叉任意输入。
3、可配置ABC三个浮盈区间段点值。如:分界区间统计小点值设为500,即当某转向信
号出现后到下一反向信号止浮盈<=此点值,计入A区间;
若大于此点值<大分界点值时,计入B区间;若大于“大分界点值”计入C区间。
4、最大/最小浮盈统计。显示所有统计区间内的最大浮盈点值和最小浮盈点值(亏损点值)。
5、输出完整信号,按信号出现顺序排列,如“ACCBCA”之类。
6、综合预测。使用概率、周期、趋势、马尔可夫链等综合概算输出预测该信号出现的归类概率值。
7、加载指定MA线。在当前图表自动载入相应设置的MA线。
8、自适应列宽。以完整显示统计信号数。
9、用法:点击相应统计按钮即输出相应的统计表格.

高级自定义加密货币外汇指标“自适应趋势震荡指标”——MT4平台高效辅助交易工具! ..................................................................................................... - 该指标是新一代震荡指标——请查看图片了解如何将其与主要趋势指标结合使用。 - 它具有可调节的自适应超卖/超买区域。 - 该震荡指标是一个辅助工具,用于从超卖/超买区域找到进入主要趋势方向的精确入场点。 - 超卖区域:绿线下方。 - 超买区域:蓝线上方。 - 将自适应趋势震荡指标与任何合适的趋势指标结合使用。 - 它比标准震荡指标更加精准。 - 该指标可用于任何时间周期。 - 内置PC和移动设备提醒。
Click here to see high quality Trading Robots and Indicators! 本产品为原创产品,仅在MQL5网站提供。

Stop spending hours manually scanning charts. The Propfolio Trade Insight Engine is an institutional-grade analytical dashboard and auto-markup utility designed specifically for SMC, ICT, BTMM, and Prop Firm traders. This powerful engine monitors your entire Market Watch (or a custom list of pairs) simultaneously, instantly detecting high-probability setups and institutional footprints. When you spot a confluence on the dashboard, simply click a button, and the engine will instantly spawn a fre

Stop spending hours manually drawing boxes, lines, and killzones on your charts. The Propfolio ICT & SMC Advanced Markup is the ultimate all-in-one chart assistant for the modern institutional trader. Designed specifically for Smart Money Concepts (SMC), Inner Circle Trader (ICT), and BTMM methodologies, this indicator automatically maps out the entire institutional narrative on your chart in real-time. Whether you are trading a prop firm challenge or managing live capital, this tool keeps your

The Propfolio Master Suite is the ultimate all-in-one analytical workstation for professional traders. Combining the power of the Beat The Market Maker (BTMM) methodology, Smart Money Concepts (SND/Liquidity), and Advanced Volume Profile, this suite replaces multiple different indicators with one optimized engine. Monitor up to 14 pairs simultaneously from a single chart, instantly identify market cycles, and seamlessly map institutional footprints with the click of a button. The Command Center

They say history repeats itself. What if you could prove it in real-time? The Propfolio Ghost Pattern is an advanced algorithmic pattern-matching engine. It empowers you to select any current price action structure on your chart and instantly scan thousands of historical candles to find the exact moment in the past where the market did the exact same thing. Once it finds the highest probability match, it projects the historical outcome into the future as "Ghost Candles"—giving you a highly calcu

Propfolio Auto Gann Zones (MTF & Auto-Mitigating) Gann Theory is one of the most powerful ways to identify market reversals, but drawing the zones manually across multiple timeframes is tedious, subjective, and clutters your charts. The Propfolio Auto Gann Zones indicator removes the guesswork completely. It uses a strictly mathematical algorithmic engine to calculate exact Support and Resistance bands based on market swings and fractional Gann widths. It then projects these high-probability rev

Here is the corrected, MQL5-compliant version of your product description. I have removed the emojis, cleaned up the excessive capitalization in the headers, and structured the features using standard markdown lists. Stop constantly switching between timeframes to find the trend. The Propfolio MTF Trendline Confluence engine is designed for Smart Money (SMC) and Price Action traders who demand absolute precision. It automatically calculates, draws, and tracks structural swing points across three

适用于 MT4 的“关键整数区域”外汇指标。
- “关键整数区域”指标是交易者在考虑支撑/阻力位时必备的辅助指标。 - 价格遵循 1000 和 500 整数水平线 - 价格经常从这些水平线反弹。 - 主要的 1000 整数水平线周围也有强大的支撑/阻力区域(每侧 100 点)。 - 1000 和 500 整数水平线也非常适合设置止盈(位于整数水平线前方)和止损(位于整数水平线后方)。 - 这些水平线在价格横盘整理和市场平盘时尤其有效。 ................................................................................................................. 点击这里查看高质量的交易机器人和指标! 这是仅在 MQL5 网站上提供的原创产品。

ANHUR Key Levels automatically plots the most important closing prices, highs, and lows across five timeframes — Yearly, Monthly, Weekly, Daily, and 4H — so you always know where institutional-grade support and resistance sit. Instead of cluttering your chart with random swing points, this indicator focuses on what actually drives price: closing prices. Closes represent where real money is committed. Highs and lows show where it reversed. Together, they reveal where price is most likely to react

Crypto_Forex MT4 版“ Inside Bar & PinBar Patterns ”指标,无需重绘,无延迟。
- “Inside Bar & PinBar Patterns”指标对于价格行为交易非常强大。 - 指标可检测图表上的 Inside Bar 和 PinBar 模式: - 看涨模式 - 图表上显示蓝色箭头信号(见图)。 - 看跌模式 - 图表上显示红色箭头信号(见图)。 - Inside Bar 本身具有较高的 R/R 比率(回报/风险)。 - 支持 PC、移动端和电子邮件提醒。 - “Inside Bar & PinBar Patterns”指标非常适合与支撑/阻力位结合使用。
点击这里查看高质量的交易机器人和指标! 本产品为独家产品,仅在本 MQL5 网站上提供。

适用于 MT4 的“8 个交易品种随机指标”外汇指标,无需重绘。 ........................................................................ - 随机振荡指标是市场上最优秀的指标之一,是众多交易者的理想工具。 - 超买区域 - 高于 80;超卖区域 - 低于 20。 - 非常适合在 80 以上的区域进行卖出入场,在 20 以下的区域进行买入入场。 - “8 个交易品种随机指标”让您有机会在一张图表上控制多达 8 个不同交易品种的随机指标值。 - 此指标也非常适合与价格行动入场相结合。 .................................................... 点击这里查看高质量的交易机器人和指标! 这是仅在 MQL5 网站上提供的原创产品。

Crypto_Forex 指标“加权 Rsi Cci Stoch 振荡器”适用于 MT4,无需重绘。
- 此独特指标结合了 3 项功能:RSI、CCI 和随机指标,用于计算! - 使用此软件可获得精确的动量交易机会 - 参见图片中的示例。 - 指标由 3 条线组成: - 加权 Rsi Cci Stoch 振荡器本身(蓝色); - 振荡器的快速 MA(黄色); - 振荡器的慢速 MA(红色); - 50 以上的区域 - 超买区域(不要在此买入)。 - -50 以下的区域 - 超卖区域(不要在此卖出)。 - 振荡器(蓝线)- 生成入场交易信号。
如何使用(LONG 示例,参见图片): 1) 当前蜡烛刚刚关闭。 2) 快速 MA(黄色)位于慢速 MA(红色)上方,振荡器蓝线位于两者上方。 3) 振荡器蓝线值低于 50 水平(不在超买区域)。 4) 蓝线刚刚形成向上反弹钩:钩表示蓝线接近黄线,然后向上反弹形成可见角度。 5) 如果步骤 1-4 已完成 - 开启多头交易。 6) 一旦振荡器线处于超买区域,关闭获利多头交易。 7) 空头交易反之亦然。
点击这里查看高质量的交易机器人和指标!

适用于 MT4 的 Crypto_Forex 指标“HTF 包络线”。 ........................................................... - 使用专业的 MT4 HTF 包络线升级您的交易方法。HTF 代表更高的时间框架。 - 包络线是市场上最好的趋势指标之一,是完美的交易工具。 - 它用于帮助交易者识别极端超买、超卖情况以及交易区间。 - HTF 包络线指标非常适合多时间框架交易系统,可与价格行为输入或与其他指标结合使用。 - 该指标允许您将更高时间框架的包络线附加到您当前的图表中。 .................................................... 点击这里查看高质量的交易机器人和指标! 这是仅在 MQL5 网站上提供的原创产品。

Stop Guessing Your Entries. Start Trading With Precision. PrecisionFib automatically draws Fibonacci retracement and extension levels from the previous bar's range — or any multi-bar range you choose — giving you the highest-probability entry zones used by institutional and prop firm traders. Most retail traders enter at random. Professional traders enter at value — the 38.2%, 50%, and 61.8% retracement of a key range. PrecisionFib puts those levels directly on your chart, automatically. Why Thi

Transform your MT4 chart into a legendary experience! Tired of boring charts?
Now you can upgrade your trading screen with a powerful animated dragon that moves smoothly across your chart in real-time. Dragon Animation Indicator is designed for traders who want more than just numbers —
it brings style, personality, and visual impact to your trading environment. Key Features: Smooth animated dragon on your chart Lightweight & optimized (no lag) Works on all pairs & timeframes Easy

Check screenshots for newbie guide+cheat sheet!
================================================================
SIGNAL HUNTER AI
Know when to trade. Know when to wait.
================================================================
Signal Hunter AI is a next-generation market scanner for MetaTrader 4
that reads the market in real time and tells you exactly what's
happening — and what to do about it.
Unlike noise indicators that fire 50 signals a day and leave you
guessing, Signal Hunter AI c

Crypto_Forex MT4 指标“黄昏之星形态”,无需重绘,无延迟。 ......................................................................... - “黄昏之星形态”指标是一款非常强大的价格行为交易指标。 - 指标可检测图表上的看跌黄昏之星形态:图表上显示红色箭头信号(见图)。 - 支持 PC、手机和电子邮件提醒。 - 其兄弟——看涨“晨星形态”指标也已推出(点击下方链接)。 - “黄昏之星形态”指标非常适合与支撑/阻力位结合使用。 .................................................... 点击这里查看高质量的交易机器人和指标! 这是仅在 MQL5 网站上提供的原创产品。

OSB 振荡器 - 是一种高级自定义指标,高效的价格行为辅助工具。
- 使用先进的新计算方法。 - 新一代振荡器 - 查看图片了解如何使用它。 - OSB 振荡器是一种辅助工具,用于查找价格行为、背离和超卖/超买信号的准确切入点。 - 超卖值:低于 30。 - 超买值:超过 70。 - 使用此指标有很多机会升级标准策略。 - 它比标准振荡器更快、更准确。 指标设置非常简单。它只有 1 个参数 - 灵敏度。
如何使用: - 作为价格行为过滤器(见图)。 - 作为主要趋势方向的进入信号(见图)。 - 作为具有准确信号的背离指标(见图)。 ................................................... 点击这里查看高质量的交易机器人和指标! 这是仅在此 MQL5 网站上提供的原创产品。

SMC Zigzag Plus 严格趋势与警报
概述: SMC Zigzag Plus 严格趋势与警报是一款专业交易指标,专为希望遵循严格趋势逻辑并捕捉高概率反转点的交易者设计。它结合了 ZigZag 摆动点的精确性与趋势突破确认,为交易者提供清晰可操作的 买入 和 卖出 信号。 主要特点: 严格趋势跟随: 指标通过 ZigZag 的更高高点/更低低点和更低高点/更高低点识别上涨趋势和下跌趋势。 只有在确认的上涨趋势中才显示 买入 箭头。 只有在确认的下跌趋势中才显示 卖出 箭头。 趋势突破确认: 信号仅在趋势线测试并确认后触发。 买入 信号出现在趋势线附近的 Higher Low (HL) 或价格回测上升趋势并得到拒绝时。 卖出 信号出现在趋势线附近的 Lower High (LH) 或价格回测下降趋势并得到拒绝时。 确保信号与机构交易风格一致,避免逆势入场。 精确入场点: 买入箭头: 出现在最后的 Higher Low,价格在上升趋势线下确认拒绝后立即出现。 卖出箭头: 出现在最后的 Lower High,价格在下降趋势线上确认拒绝后立即出现。 每个箭头都精确放置在摆动点,以保证

机构成交量 [tambangEA]
问题
大多数交易者使用过多不同的工具来解读市场。
一个指标用于成交量,一个用于成交量加权平均价格 (VWAP),一个用于支撑位和阻力位,一个用于动量,还有一个用于交易情境。结果通常都是一样的:图表拥挤、信号混乱、决策缓慢、入场时机过晚。
标准的成交量工具也存在一个重要的缺陷。它们或许能显示市场活跃度,但却无法清晰地解释:
市场价格的接受点,
价值集中点,
失衡正在形成的地方,
突破压力是否真实存在,
以及当前的风险状况是支持趋势延续还是预示着反转。
对于认真的交易者来说,这会造成一个实际问题:信息过多,但结构不够清晰。
解决方案
机构成交量 [tambangEA] 的设计初衷是将市场结构转化为清晰的可视化决策框架。
它不仅提供直方图,还整合了以下指标:
成交量分布图
合成Delta分布图
POC / VAH / VAL
HVN / LVN
锚定VWAP
市场机制检测
突破情境
风险状态
交互式仪表盘
集成交易品种和时间框架切换器
所有信息都集中在一个高级图表窗口工作区中,让您可以通过单一界面读取市场倾

这 护盾区 指标是 每日交易工具 旨在突出关键点 止盈水平 源自两个 范围期 计算依据 D1 时间范围 。通过自动识别当天的 上行阻力区 和 下行支撑区域 指标为交易者提供了一个清晰的视觉框架,展示了价格可能遇到阻力或达到日内目标的位置。该指标将这些区域绘制如下: 填充矩形 ,重现历史区域,重现天数由设定值决定。 历史数据输入 ,并在价格首次进入任一区域时每天发出一次警报。 背后的概念 护盾区 简单却有效。 安全区域 阻力区和支撑区之间的区域代表了当日的预期交易区间。当价格触及阻力区或支撑区时,就会发生震荡。 阻力区 或者 支撑区域 表明市场可能已经达到当日目标,暗示着…… 潜在逆转 接近尾声。在当前价位,交易者可以考虑平仓以锁定利润,或者为后续操作做好准备。 反转信号 反向重新入场。这使得该指标对那些寻求……的人来说特别有价值。 每日盈利目标 和 退出时间指导 在他们的 交易流程 。
核心功能
该指标计算得出 两个截然不同的活

Support and resistance based on price action. Shows when level is filled and levels which are still active. Parameters are very simple, just max bars to see into history and color settings. Plan to add alerts and more parameters for flexibility. Also will be available for MT5 soon. Any suggestions are welcome. Usually I'm updating it fast when somebody is interesting in improvements.

Indicator signal analyzer (ISA) MT4 策略构建器 + 分析器 + 信号生成器(三合一) 。
前10件售价仅需33美元! 抓紧时间,之后价格将上涨!!!
这一强大的指标使每位交易者都能基于任何指标深入分析和测试自己的交易策略。 主要特点: 您可以选择任何标准 MT4 指标(RSI、MACD、布林带、一目均衡表、移动平均线等)或任何自定义指标(包括市场指标——只需正确输入名称,例如:“市场指标名称”)。 使用以下方法创建高度灵活的买入(看涨)和卖出(看跌)信号条件: 指标缓冲区值 蜡烛图形态(十字星、锤子线、丸头线等) 与开盘价、收盘价、最高价、最低价(当前或前一根K线)的比较 不同缓冲器之间的比较 最多可添加 3 个额外的滤波指示器来确认主信号。 在 MT4 策略测试器中测试任何策略的盈利能力(即使是您尚未购买的指标——只需输入名称并在可视化模式下进行测试)。 实时在图表上直接接收清晰的箭头信号和警报(声音、电子邮件、推送通知)。 它是为谁准备的? 想要测试新指标或已购买指标的真实效力的交易者。 那些基于多个指标构建复杂策略的人。 任何需要灵活的信

ClearEdge HUD MT4
Market structure, momentum, flow, and trade-quality scoring in one clean trading HUD. ClearEdge HUD MT4 is a professional market-intelligence panel for MetaTrader 4. It helps traders read market direction, structure, momentum, volatility, session context, and trade quality directly beside live price action. Instead of filling the chart with multiple indicators, ClearEdge condenses the key trading conditions into one vertical dashboard and one simple score: 0 to 8 Trade Conflu

Signals based on Ichimoku indicator with WPR filter. Parameters for Ichimoku: InpTenkan (default 9) InpKijun (default 26) InpSenkou (default 52) Parameters for Williams percent range: WilliamsPeriod (default 14) WilliamsBuy (default 10) WilliamsSell (default 90) Parameters for alerts: SoundAlert, EmailAlert, Notification; BarsBack - how many bars to check back. Others are just for arrows. Any suggestions I'm open improve and welcome for discussion.

特别优惠: 所有工具 ,每个仅需 $30! 新工具在第一周或前3次购买内售价 $30!
MQL5交易工具频道:加入我的MQL5频道,获取最新资讯 Quadra Zone Entries 是一款多功能 MT4 指标,将八周期 EMA 带状线、基于 ATR 的交易区域、多币种扫描器以及多时间框架趋势面板整合为一个独立的完整工具。它专为希望在不切换图表或运行独立指标的情况下获取入场信号和更广泛市场背景的交易者而设计。带状线一目了然地识别趋势方向;ATR 区域为每个信号提供客观的入场、止损和目标位;扫描器和面板同时将视野扩展至九个交易品种和五个时间框架。 查看 MT5 版本: Quadra Zone Entries MT5
查看所有产品: 所有产品 工作原理 EMA 带状线与交叉信号 — 默认周期为 5、11、15、18、21、24、28 和 34。当所有八条 EMA 呈看涨排列时——短周期 EMA 位于长周期 EMA 上方——带状线以温暖的琥珀色和橙色显示。当排列呈看跌状态时,带状线切换为统一灰色,无需读取各条线的数值即可判断趋势方向。另有一条独立的 EMA 200(紫色)作为长期趋势
MetaTrader市场是独有的自动交易和技术指标商店。
阅读MQL5.community用户备忘更多地了解我们提供给交易者的独特的服务:复制交易信号,自由职业者开发的自定义应用程序,通过支付系统完成的自动付款和MQL5云网络。
