适用于MetaTrader 4的技术指标 - 154
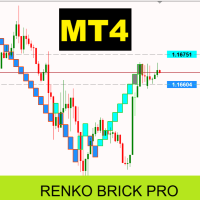
Renko Brick Pro - Advanced Renko Indicator for MT4 Professional Renko bricks with intelligent ATR sizing and ready-to-use EA integration buffers. Renko charts eliminate market noise by creating bricks only when price moves a specific amount. Unlike traditional price charts, each brick represents the same price movement, giving you cleaner trend identification and better entry points. This indicator brings true Renko analysis to MT4 with intelligent ATR-based brick calculations that automatically

适用于 MT4 的 Crypto_Forex 指标“HTF 布林带”。
- 使用适用于 MT4 的专业指标“HTF 布林带”升级您的交易方法。HTF 代表“更高时间框架”。 - 布林带是市场上最优秀的指标之一,是完美的交易工具。 - 大约 90% 的价格波动发生在两个布林带之间。 - HTF 布林带指标非常适合多时间框架交易系统,可设置价格波动入场点,或与其他指标结合使用。 - 此指标允许您将更高时间框架的布林带附加到您当前的图表中。 ................................................................................................................. // 优秀的交易机器人和指标可在此处获取: https://www.mql5.com/en/users/def1380/seller 这是仅在 MQL5 网站上提供的原创产品。

Edge Finder 11 i s your all-in-one visual trading assistant, designed to cut through the market noise and highlight high-probability trading opportunities at a glance. How It Works (The Core Idea): Instead of overloading your chart with complex numbers, Edge Finder 11 uses a unique, color-coded system to paint the market picture clearly. Trend & Momentum Visualization: The indicator analyzes the market and dynamically colors the price bars. Specific colors instantly tell you if the trend is st
This indicator represents classic approach to MACD vs price chart divergence with some visual utility and alerts. It can draw lines to define the divergence on both chart or separate window. All is adjustable. The parameters are as follows. MACD: FastEMA, SlowEMA and SignalSMA. Additional: DrawIndicatorLines (to show values on separate window), DrawPriceLines (to show it on chart itself) and DoAlerts (to allow indicator to alert when signal comes).

以太脉冲——市场的以太脉动
以太脉冲是对箭头指标的全新诠释。 它不仅对市场波动作出反应——更能感知市场节奏的变化,精准提示趋势即将转向的时刻。 告别冗余箭头、噪音干扰与延迟——呈现纯粹的动量动态。
️ 以太脉冲的工作原理
以太脉冲基于三大核心组件的协同作用:
1. 趋势引擎(21/55 EMA)
确定市场主方向。 当快EMA穿越慢EMA时,即预示趋势结构转变。 指标由此捕捉新行情启动的临界点。
2. 动能核心(MACD + RSI融合)
整合动量指标(MACD)与内部平衡指标(RSI)。 仅当两指标达成一致时触发信号,有效过滤噪音与随机波动。
3. 波动性防护
验证K线是否具备足够振幅。 自动忽略微幅波动与横盘整理,避免干扰判断。
信号逻辑
买入信号(上箭头)——EMA21高于EMA55,MACD>信号线,RSI>50,且K线收盘价高于EMA。 卖出信号(下箭头)——EMA21低于EMA55,MACD<信号线,RSI<50,且K线收盘价低于EMA。
箭头仅在趋势转向瞬间出现, 使信号虽稀少却尽可能精准。
Harmonic based indicator. Recognizes several patterns: ABCD, 3 Drives, Gartley, Butterfly, Bat, Atlternative Bat, Deep Bat, Crab, Deep Crab, Cypher and Shark. Able to set SL and three levels of TP based on Fibonacci Levels. Three types of alerts are available: PopUp, Email and Push. Trade advices on chart and stats also printed for visual estimation. All patterns are formed by not repainting ZigZiag. Parameters for it are classic: InpDepth, InpDeviation,InpBackstep. MinComplete means the level
技术说明 Nexus Signal System 是一款 MT4 指标,结合了 12 个技术指标来生成交易信号。该系统在确认信号前会分析多种因素的共振(趋势、动量、成交量、支撑/阻力区),与只使用单一指标的工具相比,可减少假信号的数量。 分析标准(评分 0–15 分): 图形形态识别(Pin Bar、吞没形态) 多时间框架分析(高时间框架趋势确认) ADX 市场状态(避免无趋势市场) 支撑/阻力区(自动识别波段点) 均线 20/50/200(趋势对齐) RSI 14 周期(动量指标) 相对成交量(机构确认) ATR(波动率) 功能特点: 带透明评分的信号(0–15 分) 自动检测支撑/阻力区并在图表上显示 初步信号(当前K线)与确认信号(已收盘K线) 止损和止盈通过 ATR 计算 实时市场信息面板 8 种颜色主题可供视觉定制 56 个可配置参数,可适应您的交易风格 使用方法: 安装: 在 MetaEditor 编译并加载到图表 关键参数: Min_Signal_Score :设置最低信号质量阈值(默认 6.5/15) MTF_Timeframe :确认用时间框架(默认 H4) Colo
技术说明 Nexus Signal System 是一款 MT4 指标,结合了 12 个技术指标来生成交易信号。该系统在确认信号前会分析多种因素的共振(趋势、动量、成交量、支撑/阻力区),与只使用单一指标的工具相比,可减少假信号的数量。 分析标准(评分 0–15 分): 图形形态识别(Pin Bar、吞没形态) 多时间框架分析(高时间框架趋势确认) ADX 市场状态(避免无趋势市场) 支撑/阻力区(自动识别波段点) 均线 20/50/200(趋势对齐) RSI 14 周期(动量指标) 相对成交量(机构确认) ATR(波动率) 功能特点: 带透明评分的信号(0–15 分) 自动检测支撑/阻力区并在图表上显示 初步信号(当前K线)与确认信号(已收盘K线) 止损和止盈通过 ATR 计算 实时市场信息面板 8 种颜色主题可供视觉定制 56 个可配置参数,可适应您的交易风格 使用方法: 安装: 在 MetaEditor 编译并加载到图表 关键参数: Min_Signal_Score :设置最低信号质量阈值(默认 6.5/15) MTF_Timeframe :确认用时间框架(默认 H4) Colo

Crypto_Forex MT4 版“修正突破形态”指标,无需重绘,无延迟。
- “修正突破形态”指标是价格行为交易的强大指标。 - 指标可检测价格修正后的看涨和看跌突破条: - 看涨修正突破形态 - 图表上显示蓝色箭头信号(见图)。 - 看跌修正突破形态 - 图表上显示红色箭头信号(见图)。 - 支持 PC、手机和电子邮件提醒。 - “修正突破形态”指标可与支撑/阻力位结合使用。 ................................................................................................................. // 优秀的交易机器人和指标可在此处获取: https://www.mql5.com/en/users/def1380/seller 本产品为独家产品,仅在 MQL5 网站上提供。
VolumeRejectionSignals v5.0 高级成交量分析指标 总体描述
VolumeRejectionSignals v5.0 是一款先进的技术指标,旨在通过对成交量拒绝的深入分析,精确识别价格的重要波动。
通过结合订单流动态与市场结构,它能够检测出买方或卖方压力减弱的区域,从而提前预判趋势反转或趋势加速。 智能评分系统
该指标基于加权评分系统,对每个信号的质量进行 0 至 100% 的评估。
信号被划分为三类: 标准型: 50–65% 强力型: 65–80% 高级型: 80% 及以上 这种分级方式有助于评估信号的可靠性,并根据信心水平调整交易策略。 过滤与自定义
VolumeRejectionSignals v5.0 提供多种可配置过滤器,可根据市场环境优化信号检测: 趋势过滤(上升、下降或中性) 波动率过滤(避免过于平静或过度波动的市场) 交易时段过滤(伦敦、纽约、亚洲) 成交量强度过滤(筛选最显著的拒绝信号) 内置多周期分析功能,可跨多个时间周期验证信号,提高分析的稳健性与一致性。 警报与可视化界面
信号实时生成,并配备完全可自定义的警报(声音、视觉或推送通
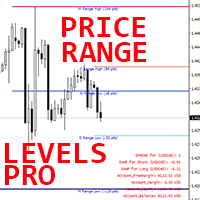
适用于 MT4 的外汇指标“价格区间水平专业版”。
- “价格区间水平专业版”指标是一款非常实用的专业辅助交易工具。 - 它显示价格可能达到的每日、每周和每月最可能水平(价格区间水平)。 - 每日区间适合日内交易者。 - 每周和每月区间适合波段交易者和长线交易者。 - 指标非常适合规划您的止盈目标或设置止损。 - 它具有信息显示功能 - 显示与其关联的外汇对的当前点差和隔夜利息。 - 显示屏还显示账户余额、净值和保证金。 - 您可以在图表的任何角落找到信息点差隔夜利息显示: 0 - 左上角,1 - 右上角,2 - 左下角,3 - 右下角。
// 优秀的交易机器人和指标可在此处获取: https://www.mql5.com/en/users/def1380/seller 这是仅在 MQL5 网站上提供的原创产品。
Indicator Title: Supply and Demand Zones Short Description: This indicator for MetaTrader 5 automatically identifies and draws supply and demand zones on the price chart, providing key visual information for trading decisions. Based on the analysis of price action and candle structure, the indicator highlights areas where the price is likely to react. Detailed Description: The Supply and Demand Zones indicator analyzes price history to identify specific candlestick patterns that suggest the pr
REAL VERSION IS OUTDATED, FOR REAL VERSION... WHATSAPP [+254757868747] I SEND THE FILE DIRECTLY Premium Smart Money Concepts (SMC) Indicator – BOS | CHoCH | FVG | OB | Liquidity Zones - Break of Structure (BOS) and Change of Character (CHoCH) - Fair Value Gaps (FVG) with auto zones - Order Blocks (OB) detection - Liquidity zones and inducement markers - Alerts for key SMC signals - Clean chart visuals – customizable and beginner-friendly - Works on any pair, any timeframe
- Trusted

你好,本次上架产品为内测产品,仅为内部测试,购买前务必与买家沟通,感谢你的关注,后续我们会上架一整套交易系统,谢谢。 谢谢。 谢谢。 谢谢。 谢谢。 谢谢。 谢谢。 谢谢。 谢谢。 谢谢。 谢谢。 谢谢。 谢谢。 谢谢。 谢谢。 谢谢。 谢谢。 谢谢。 谢谢。 谢谢。 谢谢。 谢谢。 谢谢。 谢谢。 谢谢。 谢谢。 谢谢。 谢谢。 谢谢。 谢谢。 谢谢。 谢谢。 谢谢。 谢谢。 谢谢。 谢谢。 谢谢。 谢谢。 谢谢。 谢谢。 谢谢。 谢谢。 谢谢。 谢谢。 谢谢。 谢谢。 谢谢。 谢谢。 谢谢。 谢谢。 谢谢。 谢谢。 谢谢。 谢谢。 谢谢。 谢谢。 谢谢。 谢谢。 谢谢。 谢谢。 谢谢。 谢谢。 谢谢。 谢谢。 谢谢。 谢谢。 谢谢。 谢谢。 谢谢。 谢谢。 谢谢。 谢谢。 谢谢。 谢谢。 谢谢。 谢谢。 谢谢。 谢谢。 谢谢。 谢谢。 谢谢。 谢谢。 谢谢。 谢谢。 谢谢。 谢谢。 谢谢。 谢谢。 谢谢。 谢谢。

FX Trend Matrix Pro Your all-in-one multi-symbol trend, correlation, and signal analysis system. Overview FX Trend Matrix Pro is a professional multi-symbol dashboard that combines trend direction, currency correlation, and signal detection into one structured matrix view.
Instantly see how trends align across symbols and timeframes — revealing the strongest trading opportunities in real time. ️ Key Features Multi-timeframe trend matrix (M1–W1) Currency correlation mapping (positive &

Crypto_Forex MT4 版“双锤形态”指标,无需重绘,无延迟。
- “双锤形态”指标是一款非常强大的价格行为交易指标。 - 指标可检测罕见但有效的形态:图表上出现看涨双锤形态。 - 看涨双锤形态 - 图表上出现蓝色箭头信号(见图)。 - 内置电脑和手机端提醒。 - “双锤形态”指标非常适合与支撑/阻力位结合使用。 ................................................................................................................. // 优秀的交易机器人和指标可在此处获取: https://www.mql5.com/en/users/def1380/seller 这是仅在 MQL5 网站上提供的原创产品。

Big Bull mt4 is a powerful arrow trend indicator for MetaTrader 4, designed to accurately identify market directions and key reversal points without redrawing. The indicator combines price channel analysis, ATR volatility, and adaptive SMA filters to generate clear trading signals with confirmation in the form of arrows and trend lines.
It is ideal for traders who value a clean chart, timely signals, and reliable entry points.
Features and benefits
No redrawing — signals remain on the ch

Crypto_Forex MT4 指标 Heiken Ashi Histo Filter - 是一款出色高效的辅助交易工具!无需重绘!
- 采用先进的全新计算方法 - “计算价格”参数提供 10 个选项。 - 非常适合与价格行为模式结合使用: - 绿色直方图 - 寻找看涨形态进行买入。 - 洋红色直方图 - 寻找看跌形态进行卖出。 - 使用此指标,即使是标准策略也能获得大量升级机会。 - 指标内置移动端、PC 端和邮件提醒。 ................................................................................................................. // 优秀的交易机器人和指标可在此处获取: https://www.mql5.com/en/users/def1380/seller 这是仅在 MQL5 网站上提供的原创产品。

Crypto_Forex 指标“RVI 和 2 条移动平均线”适用于 MT4 平台。无需重绘。
- Relative_Vigor_Index (RVI) 本身是一个技术动量指标,在趋势市场中非常有用。 - “RVI 和 2 条移动平均线”指标允许您查看 RVI 振荡指标的快速和慢速移动平均线。 - 指标非常适合动量交易,尤其是在大时间框架下:日线、4 小时线、1 小时线、30 分钟线。 - 该指标可通过参数轻松设置,适用于任何时间框架。 - 您可以在图片上看到买入和卖出入场条件。 - 买入入场条件: (1)- 快速黄色移动平均线高于慢速蓝色移动平均线;(2)- 红色 RVI 线高于快速黄色移动平均线;(3)- 红色 RVI 线从快速黄色移动平均线向上反弹。 - 卖出入场条件: (1)- 快速黄色移动平均线低于慢速蓝色移动平均线;(2)- 红色 RVI 线低于快速黄色移动平均线;(3)- 红色 RVI 线从快速黄色移动平均线向下反弹。
// 优秀的交易机器人和指标可在此处获取: https://www.mql5.com/en/users/def1380/seller 本产品为独家产
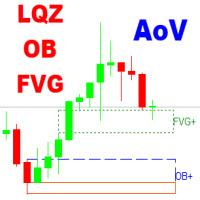
The Area of Value Detection indicator automatically identifies and highlights key institutional price zones, including Liquidity areas, Order Blocks, and Fair Value Gaps (FVG). It is designed to help traders visualize market imbalances and potential points of interest (POIs) used by smart money participants.
Main Features Liquidity Zones: Detects clusters of equal highs/lows and liquidity pools where stop orders are likely accumulated.
Order Blocks: Highlights potential bullish and bearish or
毫秒级币种强弱心电图指标,经过实盘测试,参考该指标做交易,一周盈利达到50%到100%之间,本指标限量10份,售完即止。可以通过以下, 一周实盘观摩账号,来确认该指标的可靠性: 账号:1100132996 服务器:ICMarketsSC-Live11 观摩密码:Huangtao102078 核心原理为,将市场上所有币种强弱,进行毫秒级量化,以及核算,并用图形指标展现出来,以便于观察每个细节,选择最优币种对,进行交易,确保选择的是,最大和最小币种,进行对冲,从而减少风险,提高盈利,市场上每个毫秒级动向,以及事件发生,都看得清清楚楚,明明白白,更大的优点在于,弥补了市面上的指标,最小周期为1分钟,没有办法再比1分钟更小的周期指标了,而本指标,解决了1分钟以下的周期问题。

Трендовый индикатор. Стрелки не перерисовываются, не запаздывают и не пропадают. Подходит для работы на любом инструменте и любом таймфрейме.Подходит как дополнение к любой стратегии и стилю торговли. Рекомендовано использовать данный индикатор по принципу трёх окон. Пример: пара XAUUSD, открываем три окна данного инструмента ТФ М5,М15,Н1....первый сигнал ждем на старшем ТФ, в нашем случае Н1, второй на М15 и далее на М5. Три сигнала совпали в одном направлении входим в сделку и т.д. Выходим из
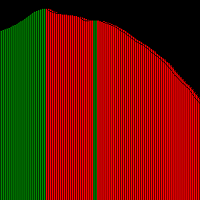
This technical indicator is suitable for foreign exchange and precious metal trading, featuring low noise. Red indicates a downtrend, while green represents an uptrend. Utilizing advanced technology and years of trading experience, it eliminates noise to form smooth curves, making it ideal for trend-following traders. It provides clear trend identification and offers straightforward entry and exit conditions for traders. Source code is available upon request. For further assistance or other serv

This is a professional trader's breakthrough system indicator that can be used for trading in various categories. Using the Hull moving average to create trend charts and provide price pressure and support positions, it provides traders with trading references for each cycle. Welcome to use it, if you have any questions, please contact us. The last 50 candlesticks for price pressure and support settings can be reset according to your needs

NeuroSlope is a precision-tuned market strength indicator that enhances RSI analysis using adaptive neuro-style smoothing. It intelligently filters out noise and volatility spikes while maintaining the RSI’s natural rhythm, creating a clean, flowing signal that better reflects underlying price momentum. The dual-histogram structure — the smart smoothed RSI (blue) and its advanced slope curve (yellow) — provides a clear visual framework for identifying directional bias, shifts in market strength,

OSB Pro 震荡指标 - 是一款高级自定义指标,高效的价格行为辅助工具。
- 采用先进的全新计算方法。 - 新一代震荡指标 - 参见图片了解如何使用。 - OSB Pro 震荡指标是一款辅助工具,用于精准定位价格行为和超卖/超买趋势信号的入场点。 - 超卖值:低于 30。 - 超买值:高于 70。 - 使用此指标,即使是标准策略,也能获得大量升级机会。 - 它比标准震荡指标更快、更精准。 - 指标具有信息显示功能 - 显示当前外汇对的点差和隔夜利息。 - 信息显示还显示账户余额、净值和保证金。 - 信息显示可放置在图表的任意位置: 0 - 左上角,1 - 右上角,2 - 左下角,3 - 右下角。
使用方法: - 用作价格行为过滤器(见图)。 - 用于进入主要趋势方向的入场信号(见图)。
// 优秀的交易机器人和指标可在此处获取: https://www.mql5.com/en/users/def1380/seller 本产品为独家产品,仅在本 MQL5 网站上提供。
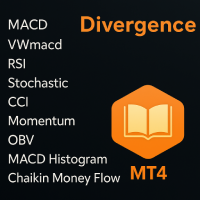
Multiple Divergence Detection System for MT4
多指标「背离」识别与可视化工具(Regular / Hidden,10个指标源,轻量高效) ________________________________________ 核心价值 • 一图整合:自动检测并可视化 常规背离(Regular) 与 隐藏背离(Hidden),在价格与指标之间绘制连线、标注顶部/底部标签,清晰直观。 • 多源共振:内置 MACD / MACD Histogram / RSI / Stochastic / CCI / Momentum / OBV / VWMACD / CMF / MFI 指标,可设定最小合成数量过滤噪音,聚焦更“强”的背离。 • 显示可控:支持是否显示连线/枢轴、标签显示全称/首字母/不显示、仅显示最近一组等,面向盘中观察更友好。 • 轻量高效:限定最大回看、线段/标签数量,适合多周期、多品种并行运行。 ________________________________________ 推荐品种与市场类型 • 更适合震荡/非趋势型

MT4 ATR Stops指标介绍: 这是一个基于平均真实波幅(ATR)的动态支撑阻力指标,通过计算价格的波动性,在K线图上绘制出通道,并以直观的颜色和点状信号提示交易时机。 开仓与平仓位置 1. 开多仓(做多) 信号特征:K线颜色变为绿色,且图表上出现一个绿色的圆点。 逻辑:价格突破了由ATR计算出的动态上轨阻力,表明短期上升动能强劲。 2. 开空仓(做空) 信号特征:K线颜色变为红色,且图表上出现一个红色的圆点。 逻辑:价格跌破了由ATR计算出的动态下轨支撑,表明短期下跌动能强劲。 3. 平仓(多单或空单) 信号特征:当出现与您当前持仓方向相反的信号时,即为平仓时机。 平多仓:当出现红色K线和红点(即开空仓信号)时,应平掉多单。 平空仓:当出现绿色K线和绿点(即开多仓信号)时,应平掉空单。 指标特性总结 核心设置:使用ATR周期10和移动平均周期2来构建一个反应灵敏的动态通道。 视觉直观:通过Display
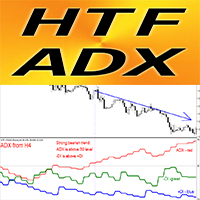
适用于 MT4 的 Crypto_Forex 指标 HTF ADX。
- 使用专业的 MT4 HTF ADX 指标升级您的交易方法。HTF 表示“更高时间框架”。 - ADX(红线)用于衡量趋势强度 - 如果 ADX 值高于 20 且呈上行趋势,则趋势强劲。 - 如果 +DMI(蓝线)高于 -DMI(绿线):价格正在上涨,ADX 衡量上涨趋势的强度。 - 如果 -DMI(绿线)高于 +DMI(蓝线):价格正在下跌,ADX 衡量下跌趋势的强度。 - 如果 ADX(红线)低于 20,则市场处于平盘状态。 - 此指标非常适合多时间框架趋势交易 - 您可以将更高时间框架的 ADX 附加到您当前的图表中。
// 优秀的交易机器人和指标可在此处获取: https://www.mql5.com/en/users/def1380/seller 这是仅在 MQL5 网站上提供的原创产品。

适用于 MT4 的“ DeMarker for 8 Symbols ”外汇指标,无需重绘。
- DeMarker 振荡指标曲线指示指标计算期间当前价格相对于先前高点和低点的位置。 - DeMarker 提供最高效的常规背离信号。 - 它非常适合在超买区域(高于 0.7)进行常规背离卖出入场,以及在超卖区域(低于 0.3)进行常规背离买入入场。 - “DeMarker for 8 Symbols” 允许在一张图表上控制多达 8 个不同符号的 DeMarker 值。 - 该指标也非常适合与超卖/超买区域的价格行为入场相结合。
// 优秀的交易机器人和指标可在此处获取: https://www.mql5.com/en/users/def1380/seller 这是一款仅在 MQL5 网站上提供的原创产品。

"CPD-Pro"-"烛台图案检测器Pro"
(专业蜡烛图案探测器,多级过滤)
主要特点:
1. 蜡烛图案的综合识别(39种):
*强逆转:锤,绞死,吸收,晨/晚星,流星,乌云
*弱逆转:镊子,皮带抓地力,三只乌鸦
*延续模式:垫举行,三种方法,Tasuki窗口
*未分类:闪避模式,反击
2. 多级过滤系统:
*区域水平(多帧H1/H4/D1/W1/MN1)-动态支撑/阻力区域
*圆形水平-可调节间距的心理价格水平
*银行水平-基于格林尼治标准时间的交易时段收盘价
*Fvg(公允价值缺口)-自动填充跟踪的市场效率低下
3. 先进的技术过滤器:
*RSI过滤器-超买/超卖区域过滤
*EMA滤波器-基于快速/慢速EMA交集的趋势滤波器
*CCI分歧-用视觉接触点识别分歧
*RSI差异-识别价格和指标差异
4. 智能验证系统:
*异常蜡烛过滤器(排除极端尺寸)
*检查水平的触摸,考虑到模式的方向
5. 灵活的通知系统:
*声音警报与时间限制
*推送通知到移动设备
*电子邮件分发
指标的优点:
综合方法-在一个系统中结合价格行动、水

Presenting "Market Analyzer" — a convenient and reliable indicator‑informer for MetaTrader 4 that quickly shows the prevailing market force across multiple timeframes. The indicator combines trend and momentum indicators (EMA, ADX, MACD, RSI) with a volatility filter (ATR), aggregates signals with configurable weights, and outputs an overall score and a simple trading suggestion: "Trade Up", "Trade Down", or "No Signal".
Why choose this indicator:
Compact and informative — all key market para

Gold Rush FVG (Multiple Time Frame) - Professional Fair Value Gap Indicator Product Description Discover hidden trading opportunities with Gold Rush FVG , a powerful visual tool that automatically identifies Fair Value Gaps on your charts across multiple timeframes. Fair Value Gaps are price 'imbalances' that occur when the market moves so quickly that it leaves "gaps" in normal trading activity. These gaps often act as magnets, with price returning to fill them later - creating the potential fo

适用于MT4平台的加密货币外汇指标“吞没形态和盘整形态”,无重绘,无延迟。
- “吞没形态和盘整形态”在价格行为交易中非常有效。 - 该指标可检测图表上的吞没形态和盘整形态: - 看涨吞没形态 - 图表上的绿色箭头信号。 - 看跌吞没形态 - 图表上的橙色箭头信号。 - 看涨盘整形态 - 图表上的蓝色箭头信号。 - 看跌盘整形态 - 图表上的红色箭头信号。 - 盘整形态本身具有较高的盈亏比(R/R)。 - 支持电脑、手机和邮件提醒。 - “吞没形态和盘整形态”非常适合与支撑/阻力位结合使用。
// 这里提供优秀的交易机器人和指标: https://www.mql5.com/en/users/def1380/seller 这是仅在 MQL5 网站上提供的原创产品。
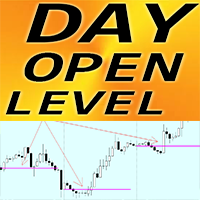
适用于MT4平台的加密货币外汇指标:日内开盘价位
- “日内开盘价位”指标是一个非常实用的辅助指标。 - 日内开盘价位非常重要,因为价格经常会在一天中回到该区域。 - 该指标显示每日的开盘价位。 - 它对日内交易者设置目标价位或用作支撑/阻力位非常有用。 - “日内开盘价位”指标可用于日内反转交易。 .............................................................................................................. // 更多优秀的交易机器人和指标请访问: https://www.mql5.com/en/users/def1380/seller 本产品为MQL5原创产品,仅在MQL5网站提供。
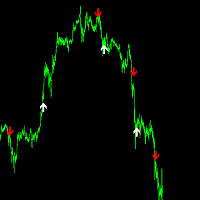
The 5-minute trend buying and selling point reference for gold has an accuracy rate of 90%. All signals are not redrawn, Parameters need to be adjusted for different varieties and periods. The default value for gold trading is the 5-minute period. You can carefully study what direction guidance is suitable for you. We hope you can make money and it is worth referring to for professionals and novice traders. Stop loss is at the end of the line, real-time signal. Welcome to use it. If you have an

Trend Oscillator Pro 是一款高级自定义加密货币外汇指标,高效的交易工具!
- 采用先进的全新计算方法 - “计算价格”参数提供 20 个选项。 - 迄今为止最平滑的震荡指标。 - 绿色代表上升趋势,红色代表下降趋势。 - 超卖值:低于 5,超买值:高于 95。 - 即使是标准策略,也能通过此指标进行大幅升级。 - 内置 PC 和移动设备提醒功能。 - 指标带有点差信息显示 - 显示所关联外汇货币对的当前点差和隔夜利息。 - 还显示账户余额、净值和保证金。 - 可以将点差信息显示放置在图表的任意位置: 0 - 左上角,1 - 右上角,2 - 左下角,3 - 右下角。
// 这里提供优秀的交易机器人和指标: https://www.mql5.com/en/users/def1380/seller 这是仅在 MQL5 网站上提供的原创产品。

GalaxyReversalPro — Trend Signal Indicator
GalaxyReversalPro is a signal-based trend indicator designed for traders who value simplicity, accuracy, and reliability.
It’s extremely easy to use and requires no additional setup.
The tool helps you enter new trends early and exit before corrections begin — maximum precision with minimal risk.The algorithm is based on structural-impulse analysis: it tracks local highs and lows, detects breakouts of key levels, and confirms trend reversals only af

Fibo AUTO Pro:重新定义斐波那契分析——更智能、更直观、更高效 产品概述 Fibo AUTO Pro 是一款专为现代交易者设计的专业级技术分析指标。它基于经典的斐波那契回调理论,进行了全面的智能化增强,旨在解决传统绘图工具在效率、可视化和精准度上的痛点。Fibo AUTO Pro 不仅仅是一个画线工具,更是您洞察市场关键价位、制定精密交易策略的智能伙伴。 核心功能详解 极致灵活的个性化配置 自定义关键水位 :不再受限于默认的斐波那契比率。您可以根据自己的交易策略,轻松添加(如0.886, 0.906)、删除或修改任何回调线与扩展线,打造完全属于您个人的分析模板。 视觉风格自定义 :支持对每一条水平线的颜色、线型和粗细进行独立调整,让最重要的支撑阻力位(如核心的0.618)在图表上脱颖而出。 智能多色视觉系统 自动分区着色 :Fibo AUTO Pro 会自动为不同的斐波那契水平(如0.382, 0.5, 0.618, 0.786)分配鲜明且协调的颜色。这种视觉编码让您在任何时间周期下,都能瞬间识别不同级别的价位,极大提升了图表的多维度信息可读性。 直接价格显示 告别悬停与计
Mean Reversion Probability – 统计性均值回归指标 简短说明
机构级指标,根据历史超延伸分析,计算价格回归到200周期均线(MA200)的统计概率。以量化精度识别市场疲劳区域。 主要功能
高级统计分析 – 基于500+历史延伸数据计算真实概率
概率评分 (0–99%) – 精确量化回归均线的可能性
疲劳检测 – 测量超延伸的持续时间与强度
多资产标准化 – 自动适配外汇、指数、黄金、加密货币、差价合约
智能警报 – 罕见但高度可靠的信号(概率 >80%,持续时间 >15 根K线)
专业级界面 – 清晰、结构化的机构风格设计 方法学
指标实时分析: 价格与MA200的标准化距离(以ATR计) 自上次回归以来的延伸时长 达到最大延伸的时间 与历史平均值比较 概率计算: 距离评分(最高60%):当前值与历史比值 持续评分(最高40%):延伸时间与平均时间比 疲劳加成(+15%):当持续时间 >1.5×最大延伸时间 极端加成(+10%):当距离 >2.5 ATR 推荐用法
机构级策略: 等待概率 >70% 且 距离 >1.5 ATR 通过较长延伸时间确认(绿色
WBP 图表信号 – 多时间框架买卖压力指标 描述:
WBP 图表信号是一款高级指标,通过分析成交量、点差和价格行为来衡量市场压力。适用于寻求精确信号和多时间框架确认的交易者,具有机构级分析风格。 主要功能: 加权买入压力 (WBP): 专有算法结合 VWAP、MA200、成交量强度、流动性因素和动量 多时间框架分析: 自动高时间框架确认,提高信号可靠性 实时多品种扫描: 同时监控6大货币对 精准信号过滤: 7种确认过滤器,包括背离、成交量、趋势及高时间框架确认 专业仪表盘: 实时显示 WBP 值、信号及高时间框架分析 机构级计算: 成交量对数刻度、VWAP 权重及信念因子 信号系统: 买入: 强买 > 75,适中买 > 65 卖出: 强卖 < 25,适中卖 < 35 指标窗口显示箭头;可自定义声音提醒 技术规格: 单独指标窗口,5个缓冲区 可调阈值与确认参数 适用于所有时间框架和品种 无重绘 – 信号在K线收盘确认 优化性能 参数: VWAP 周期 20,MA 趋势 200,EMA 平滑 5,确认柱 2,多重过滤器 适用场景: 日内交易、波段交易、机构成交量分析、多品种市场压力监控

ARB 是一种指标,用于通过自适应 ATR 通道系统和精确的多因素评分模型(0–100)识别高概率的突破机会。
它结合了波动率、成交量、动能以及多周期趋势分析,提供经过筛选、直观且可实时操作的交易信号。 运行原理 该指标基于 Adaptive Range Breakout(自适应区间突破) 的概念,这是一种现代化的突破交易方法,可根据市场波动率(ATR)和价格的动态结构自动调整阈值。
每个信号都会通过加权评分来评估其质量和可靠性,然后再确认。 评分系统组成(0–100) 每个因素都会对总体评分作出贡献,以评估信号强度: 因素 权重 描述 通道中的位置 40% 测量价格在当前 ATR 区域中的位置 接近突破程度 25% 评估价格距离关键阈值的远近 成交量确认 15% 将当前成交量与移动平均值进行比较 高级别趋势(HTF) 15% 检查是否与更高级别周期的趋势一致 近期动能 5% 融入短期价格运动的动量变化

适用于MT4平台的加密货币外汇指标:HTF OsMA震荡指标。
- HTF OsMA是市场上最佳趋势指标之一。HTF代表更高时间框架(Higher Time Frame)。 - 该指标非常适合采用价格行为入场的多时间框架交易系统,或与其他指标结合使用。 - HTF OsMA指标允许您将更高时间框架的OsMA信号附加到当前图表上——这是一种专业的交易方法。 .............................................................................................................. // 更多优秀的交易机器人和指标请访问: https://www.mql5.com/en/users/def1380/seller 本产品为MQL5独家原创产品。

适用于MT4平台的“回测柱状图”加密货币外汇指标,无重绘。
- “回测柱状图”指标可用于在强支撑/阻力位回测后寻找进入主要趋势方向的入场信号。 - “回测柱状图”有两种颜色:红色代表下跌趋势,绿色代表上涨趋势。 - 当您看到连续稳定的同色柱状图时,意味着新的趋势正在形成。 - 回测信号表现为柱状图中第一列颜色与当前趋势相反,第二列颜色与当前趋势一致(参见图片)。 - 该指标内置移动端和PC端提醒功能。
指标使用方法: - 买入信号:持续稳定的绿色柱状图(上涨趋势)+ 一列红色柱状图(回测)+ 一列绿色柱状图(在此处开立多头头寸)。 - 卖出信号:持续稳定的红色柱状图(下跌趋势),柱状图上出现一根绿色柱(回测),再出现一根红色柱(在此处开立空头头寸)。
// 优秀的交易机器人和指标可在此处获取: https://www.mql5.com/en/users/def1380/seller 这是仅在 MQL5 网站上提供的原创产品。

MA Ribbon PRO – Dynamic Trend Map with Real-Time Direction & Strength (MT4) See the trend instantly!
MA Ribbon PRO shows live direction (Long / Short) and strength (Weak / Medium / Strong) with color-coded precision.
A compact info panel updates on every tick – fast, clear, and intuitive. Why traders love it Real-Time Direction: Instantly displays Long / Short based on current price vs. the main MA. Readable Momentum: “Strength” measures ribbon expansion or contraction over time. Clean Visua
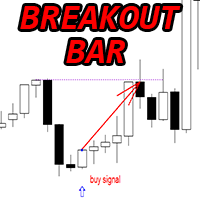
适用于MT4平台的加密货币外汇指标“突破柱形态”,无重绘,无延迟。
- “突破柱形态”指标是一款功能强大的价格行为交易指标。 - 该指标可检测图表上的突破柱形态: - 看涨突破柱形态 - 图表上的蓝色箭头信号(见图)。 - 看跌突破柱形态 - 图表上的红色箭头信号(见图)。 - 支持电脑、手机和邮件提醒。 - “突破柱形态”指标非常适合与支撑/阻力位结合使用。 .............................................................................................................. // 更多优秀的交易机器人和指标请访问: https://www.mql5.com/en/users/def1380/seller 本产品为MQL5独家原创产品。

Hi Traders,
On purchase this tool we will give lifetime free updates for this tool
you can contact me how to use this tool better or your suggestion for improvement
This tool will work on any accounts
Where When Enter Exit – Trade Plotter helps traders easily see, track, and review their sell trades directly on the chart.
It clearly shows where you entered, when you exited, and why , so you can quickly learn from every trade. Key Features Auto Plot Entries & Exits

Galaxy Force Analyzer - is an intelligent indicator for analyzing market volume and strength. It combines data from indicators like Force, OBV, MFI, AD, and others with advanced algorithms for acceleration and filtering to show the energy of price movement — the moment when a trend gains strength or begins to weaken. The indicator doesn’t just display volume — it measures impulse power, acceleration, and the speed of pressure changes between buyers and sellers.
Signals: Everything on the chart

PinBar Dashboard Pro - Multifunctional Pattern Scanner Overview PinBar Dashboard Pro is a professional tool for traders that provides real-time scanning of 4 key price patterns on 6 timeframes for a variety of trading instruments. It is an ideal solution for quick market analysis and finding trading opportunities.
Key Features Multifunctional Scanning 4 Patterns: PinBar, Engulfing, Doji, InsideBar
6 timeframes: M30, H1, H4, D1, W1, MN1
Unlimited number of symbols (up to 64 instrument

适用于MT4平台的“随机指标(带警报)”加密货币外汇指标,无重绘。
- 随机震荡指标是市场上最好的指标之一,是众多交易者的理想工具。 - 内置PC和移动端警报功能,可触发超卖/超买区域的入场和出场警报。 - 内置PC和移动端警报功能,可触发随机指标和信号线交叉警报。 - 警报触发阈值可调。 - 超买区域:高于80;超卖区域:低于20。 - 该指标适用于任何时间周期。 - 该指标也非常适合与价格行为技术结合使用。 .............................................................................................................. 点击这里查看高质量的交易机器人和指标! 本产品为MQL5独家原创产品。

The proposed indicator is based on the method of William D. Gann (1878-1955), which uses the relationship between price and time. In this method, the relationship is expressed as follows: Price = Time squared or P = t ² This relationship between price and time can be represented graphically. To do this, a significant Low and a significant High are taken from the chart. A parabola is then constructed using the “Parabolic_Gann” indicator. Next, a new parabola is constructed from the base that ap

NGC Quark
I tested this indicator on a 1-year timeframe (January 2024 – January 2025), on M15, with Take Profit of 5 pips, without Stop Loss, on the EURUSD pair.
Out of 351 trades, only 12 were lost.
Signals are shown by blue circles (Buy) and red circles (Sell).
The indicator works on all currency pairs and all timeframes.
I recommend M15 – D1 intervals.
Exits, from a few pips (as in the example above) or TMA NRP lines, Support, Resistance lines, etc.
- For this indicator to work, you n
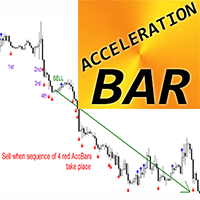
适用于MT4平台的加密货币外汇指标加速柱 - 能够捕捉巨大趋势。
- “加速柱”指标是趋势交易的强大工具,可最大限度地减少市场横盘整理的影响。 - 看涨加速柱(蓝色)是指图表上最高价高于前5根K线最高价且最低价低于后5根K线最低价的K线。 - 看跌加速柱(红色)是指图表上最低价低于前5根K线最低价且最高价高于后5根K线最高价的K线。 - 支持电脑、手机和邮件提醒。
趋势交易: - 买入信号 - 当图表上出现连续4根看涨加速柱时。 - 卖出信号 - 当图表上出现连续4根看跌加速柱时。
// 更多优秀的交易机器人和指标请访问: https://www.mql5.com/en/users/def1380/seller
本产品为MQL5独家原创产品。

RET System Channel Indicator
1 of 10 indicators used in the RET System to achieve Reversal Anticipation Purpose : Dynamic support/resistance zones. Visual : Envelope bands adapting to price volatility. Use : Identify overbought/oversold levels and project reaction zones.
RET System Channel Strengths : Detects choppy/range-bound zones Confirms trade setups Identifies high-probability setups (outside bands) Acts as a profit target tool Defines short-term currency price ranges Weaknesses :
We have always believed that the most efficient and intuitive methods can bring good results. M1 Breaking Point: An Intuitive Trading Indicator System
M1 Breaking Point is an exceptionally intuitive trading indicator system, meticulously engineered for the M1 timeframe. It functions seamlessly as a standalone system for scalping or minor trend trading on fast-moving one-minute charts, and also integrates effortlessly into your existing trading strategy to enhance decision-making efficiency.
W
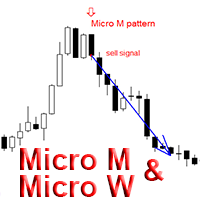
适用于MT4平台的加密货币外汇指标“微型M和微型W形态”,无重绘,无延迟。
- “微型M和微型W形态”指标是一款功能强大的价格行为交易指标。 - 该指标可检测图表上的微型M形态和微型W形态: - 看涨微型W形态 - 图表上的蓝色箭头信号(见图)。 - 看跌微型M形态 - 图表上的红色箭头信号(见图)。 - 内置PC和移动设备警报。 - “微型M和微型W形态”指标非常适合与支撑/阻力位结合使用。 - 可用于任何时间周期。 - 该指标是检测趋势变化或回调结束的绝佳工具。
// 更多优秀的交易机器人和指标请访问: https://www.mql5.com/en/users/def1380/seller 本产品为MQL5官方网站独家销售的原创产品。

银行交易时段线指标
银行交易时段线指标会自动突出显示价格波动的时段。 它能帮助精明的交易者清晰地标记和追踪银行进行交易的关键机构交易时段——亚洲、伦敦和纽约,并提供完全自定义的交易时段线,方便您在图表上进行标记。
专为需要清晰、精准地追踪波动周期的交易者而设计。
为什么选择银行交易时段线?
因为每一次重大价格波动都始于并结束于机构银行的交易时段。 该工具能让您直观地了解银行的交易时段,从而让您只在市场更有可能波动时进行交易,避免在市场不太可能波动时进行交易。 它能帮助交易者仅在流动性发生变化时才与银行进行交易,而这些变化恰好发生在银行构建、锁定和释放价格的时段内。 非常适合识别基于交易时段的虚假突破、流动性扫荡和机构足迹。
功能
在图表上自动绘制交易时段垂直线。 自定义每个交易时段:开始和结束时间。 自定义每条交易时段线:颜色、大小/粗细和线条样式。 为线条添加标签(例如:纽约开盘/收盘等)。 适用于任何时间周期和交易品种。 动态时间转换——自动调整至您的经纪商时区。 简洁的视觉界面——专为专注于价格行为的专业交易者打造。
使用方法
将指标添加到您的图表。 设置您经纪
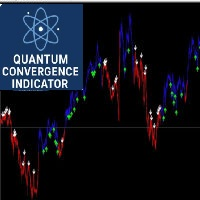
Strategy Overview The Quantum Convergence Indicator is an advanced multi-dimensional trading system that identifies high-probability entry points by analyzing the convergence of multiple market dimensions. This sophisticated algorithm detects when price action, momentum, and volatility align to create optimal trading opportunities. Key Features Multi-Dimensional Analysis Trend Dimension : Analyzes market direction using dual momentum oscillators Momentum Dimension : Measures market strength and

RET System High Low Indicator The RET System High Low indicator is 2 of 10 indicators part of the Reversal Edge Trading Suite , built to help traders identify exhaustion zones, reaction levels, and reversal points with precision.
It maps the market’s structural extremes —the key highs and lows where momentum often fades or reverses—allowing you to anticipate shifts before they happen. By combining level-to-level logic with trend awareness, this tool helps traders avoid chasing price and inste

Looking for a trading tool based on the CCI indicator that can display crossovers arrows on all time frames? Introducing trading indicator : All Time Frame Double CCI Model T ready to help you achieve daily profits. This tool is created using the intersection of two CCI (Double CCI) indicator lines: the main CCI and the signal CCI. Using this tool makes it easier to observe the real-time dashboard and intersections of multiple timeframes simultaneously. Viewing both higher and lower timeframes

RET Momentum is 3 of 10 indicators designed to help traders identify the acceleration phase of market moves — where reversals turn into trends and trends begin to exhaust.
It forms part of the RET System , working in sync with the RET Channel , High Low , and Exhaustion indicators to confirm R eversal Anticipation setups and avoid premature entries. This tool measures real-time momentum flow through proprietary candle calculations, color shifts, and smooth transitions — making it easier t

Looking for a trading tool based on the CCI indicator that can display crossovers arrows on all time frames? Introducing trading indicator : All Time Frame Double CCI Model S ready to help you achieve daily profits. This tool is created using the intersection of two CCI (Double CCI) indicator lines: the main CCI and the signal CCI. Using this tool makes it easier to observe the real-time dashboard and intersections of multiple timeframes simultaneously. Viewing both higher and lower timeframes
Based on over 10 years of trading experience, we have compiled technical indicators and real-time signals that are suitable for gold trading in various cycles without redrawing. However, we need to set parameters. The default parameter now is one minute cycle gold trading, and the signal is very reliable, with 3 to 5 signals per day. Of course, you can also adjust the parameters to find the one that suits you. After thorough research, we can achieve 100% stable profit. Wishing everyone a prospe
Signal Histogram 是一款适用于 MetaTrader 4 平台的可靠技术指标,旨在通过比较收盘价和移动平均线来直观地识别当前趋势。该指标在一个单独的窗口中显示直方图:绿色柱表示价格高于平均线,红色柱表示价格低于或等于平均线。这种方法可以帮助您快速评估趋势方向并识别潜在的反转点。该指标会在价格与移动平均线的交叉点生成交易信号,这对于短线交易和日内交易尤为有效。所有信号均为非重绘信号,因为它们仅在K线收盘后生成,从而确保了稳定性,并能够根据历史数据客观地评估指标表现。为了提高准确性,Signal Histogram 使用了时间过滤器:您可以自定义交易时段窗口,排除波动较大的时段,专注于最活跃的市场板块。这使得该指标特别适合偏好在特定时段进行交易的交易者。该指标支持推送通知和提醒,即使您不在电脑前,也能确保您不会错过任何重要事件。
Signal Histogram 的主要优势之一在于,您可以在同一图表上安装多个实例,并分别设置不同的周期,例如 20、50 和 100(参见截图 #2)。这样可以同时显示价格相对于短期、中期和长期趋势的表现。例如,如果价格高于所有三条线,通常
RET System Fast Bias The RET Fast Bias indicator is number 4 of 10 tools in the RET System , revealing when short-term momentum begins to shift against or with the dominant trend.
It helps traders identify the first signs of bias change — when short-term energy confirms, opposes, or precedes the larger market move. Built around Reversal Anticipation , Fast Bias is designed to show when price action is about to change direction before it does. What It Does Displays short-term market bias di

Trend Flow Entry Pro is a simple yet powerful trend-following indicator designed to help you enter the market at optimal pullback points.
The system displays an Entry Signal at the top-right corner of the chart.
When both indicators are blue, a Buy signal is triggered — ideal for long entries.
When both are red, it signals a Sell opportunity — perfect for short trades.
These signals appear only when the market is trending clearly, helping you ride the wave with confidence and avoid sideways

The Reflection Angle indicator is a high-precision professional tool that delivers over 90% accuracy across all timeframes . It’s designed to detect price reversals and pinpoint ideal entry points with exceptional reliability. Key Features: Works flawlessly on all timeframes with no signal delays. Performs best during high-liquidity sessions such as London and New York . Ideal for news events and volatile market conditions . Proven signal accuracy exceeding 90% in real trading tests. Recom

Toukou Indicator – Your Winning Edge for Gold and Forex Trading The Toukou Indicator is a powerful trading tool designed to maximize profits in Gold (XAUUSD) and the Forex market .
Built on advanced algorithmic logic, it accurately identifies ideal entry and exit zones , adapting dynamically to changing market conditions. ️ Key Features: Smart Trend Detection: Instantly identifies bullish and bearish market phases. Accurate Buy & Sell Signals: Generated only under the most favorable tr

GainLossView – Smart Profit Tracker for Every Trader GainLossView is a powerful yet lightweight indicator designed to give you real-time visual control of your trading performance — directly on the chart.
Whether you trade manually or with Expert Advisors , GainLossView keeps you fully aware of your daily gains, current losses, and total balance with clean, instant updates. Why Traders Love GainLossView GainLossView turns your chart into a live performance dashboard.
It helps you stay conn
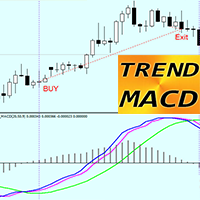
MT4 趋势 MACD 指标——一款强大高效的交易工具!
- 此指标非常适合专注于捕捉价格大幅波动的趋势交易者。 - 趋势 MACD 指标由三条线组成:绿线——指示主要趋势方向,蓝线和洋红色线——分别指示入场点和出场点。 - 该指标有助于最大化利润——避免过早平仓。 - 该指标内置手机和电脑端提醒功能。
如何使用该指标进行买入交易(参见图片): 1) 检查蓝线和洋红色线是否均位于绿线之上。 2) 当蓝线位于洋红色线之上时——买入。 3) 当蓝线位于洋红色线之下时——平仓。 4) 卖出交易的操作步骤与之相反。
// 这里提供优秀的交易机器人和指标: https://www.mql5.com/en/users/def1380/seller 这是仅在 MQL5 网站上提供的原创产品。
MetaTrader市场提供了一个方便,安全的购买MetaTrader平台应用程序的场所。直接从您的程序端免费下载EA交易和指标的试用版在测试策略中进行测试。
在不同模式下测试应用程序来监视性能和为您想要使用MQL5.community支付系统的产品进行付款。
您错过了交易机会:
- 免费交易应用程序
- 8,000+信号可供复制
- 探索金融市场的经济新闻
注册
登录