

MQL5取引ツール(第20回):統計的相関分析と回帰分析を用いたCanvasグラフ作成
 629
629
 0
0

はじめに
第19回では、MetaQuotes Language 5 (MQL5)を使用して、チャート描画用のインタラクティブなツールパレットを構築しました。このツールパレットには、ドラッグ可能なパネル、リサイズ機能、テーマ切り替え機能、およびさまざまな分析ツール用のボタンを実装しました。第20回となる今回は、2つの変数間の統計的相関および線形回帰分析を可視化する、Canvasベースのグラフ描画ツールを作成します。本ツールは、ドラッグおよびリサイズ可能なインターフェース、動的な目盛り表示、統計情報の表示機能を備えています。さらに、回帰直線、散布点、および傾きや決定係数などの統計指標を表示することで、ペアトレード分析に役立つ視覚的な情報を提供します。本記事では以下のトピックを扱います。
記事を読み終える頃には、市場分析に活用できるインタラクティブな回帰分析チャートを構築できるようになります。それでは始めましょう。
Canvasグラフにおける統計的相関と回帰分析
相関とは、2つの変数(たとえば銘柄価格)の関係の強さと方向性を表す指標です。一般的には、-1(負の相関)から1(正の相関)の範囲を持つピアソン相関係数が用いられます。一方、線形回帰は、データポイントに最も適合する直線を求め、その傾きと切片を利用してトレンドを予測する手法です。Canvasグラフでは、相関関係は散布図として、回帰分析は回帰直線として視覚化されます。また、回帰モデルの適合度を示す決定係数を併せて表示することで、ペア間の依存関係や乖離をより容易に把握できます。このようなグラフィカルな表現をドラッグ可能なCanvas上で実現することで、市場における銘柄間の関係をインタラクティブに探索できるようになります。さらに、統計情報パネルを表示することで、重要な分析結果をすばやく確認できます。本ツールでは、銘柄データを読み込み、ALGLIBを用いて回帰分析を実行し、動的な目盛りやアンチエイリアス処理を施したデータポイントおよび回帰直線を描画します。さらに、傾きや決定係数などの統計情報をオーバーレイ表示します。目的を簡潔にまとめると、以下のようになります。

MQL5での実装
MQL5でプログラムを作成するには、まずMetaEditorを開き、ナビゲーターで[Experts]フォルダを探します。[新規]タブをクリックして指示に従い、ファイルを作成します。ファイルが作成されたら、コーディング環境で、まずプログラム全体で使用する入力パラメータとグローバル変数をいくつか宣言する必要があります。
//+------------------------------------------------------------------+
//|              Canvas Graphing PART 1 - Statistical Regression.mq5 |
//|                           Copyright 2026, Allan Munene Mutiiria. |
//|                                   https://t.me/Forex_Algo_Trader |
//+------------------------------------------------------------------+
#property copyright "Copyright 2026, Allan Munene Mutiiria."
#property link      "https://t.me/Forex_Algo_Trader"
#property version   "1.00"
#property strict

#include <Math\Alglib\alglib.mqh>
#include <Canvas\Canvas.mqh>

//+------------------------------------------------------------------+
//| Enumerations                                                     |
//+------------------------------------------------------------------+
enum ResizeDirection {
   NO_RESIZE,                                           // No resize
   RESIZE_BOTTOM_EDGE,                                  // Resize bottom edge
   RESIZE_RIGHT_EDGE,                                   // Resize right edge
   RESIZE_CORNER                                        // Resize corner
};

//+------------------------------------------------------------------+
//| Inputs                                                           |
//+------------------------------------------------------------------+
sinput group "=== REGRESSION SETTINGS ==="
input int                maxHistoryBars = 200;          // Maximum History Bars
input ENUM_TIMEFRAMES    chartTimeframe = PERIOD_CURRENT; // Chart Timeframe
input string             primarySymbol = "AUDUSDm";     // Primary Symbol (X-axis)
input string             secondarySymbol = "EURUSDm";   // Secondary Symbol (Y-axis)

sinput group "=== CANVAS DISPLAY SETTINGS ==="
input int                initialCanvasX = 20;           // Initial Canvas X Position
input int                initialCanvasY = 30;           // Initial Canvas Y Position
input int                initialCanvasWidth = 600;      // Initial Canvas Width
input int                initialCanvasHeight = 400;     // Initial Canvas Height
input int                plotPadding = 10;              // Plot Area Internal Padding (px)

sinput group "=== THEME COLOR (SINGLE CONTROL!) ==="
input color              themeColor = clrDodgerBlue;    // Master Theme Color
input bool               showBorderFrame = true;        // Show Border Frame

sinput group "=== REGRESSION LINE SETTINGS ==="
input color              regressionLineColor = clrBlue; // Regression Line Color
input int                regressionLineWidth = 2;       // Regression Line Width
input color              dataPointsColor = clrRed;      // Data Points Color
input int                dataPointSize = 3;             // Data Point Size

sinput group "=== BACKGROUND SETTINGS ==="
input bool               enableBackgroundFill = true;   // Enable Background Fill
input color              backgroundTopColor = clrWhite; // Background Top Color
input double             backgroundOpacityLevel = 0.95; // Background Opacity (0-1)

sinput group "=== TEXT AND LABELS ==="
input int                titleFontSize = 14;            // Title Font Size
input color              titleTextColor = clrBlack;     // Title Text Color
input int                labelFontSize = 11;            // Label Font Size
input color              labelTextColor = clrBlack;     // Label Text Color
input int                axisLabelFontSize = 12;        // Axis Labels Font Size
input bool               showStatistics = true;         // Show Statistics & Legend

sinput group "=== STATS & LEGEND PANEL SETTINGS ==="
input int                statsPanelX = 70;              // Stats Panel X Position
input int                statsPanelY = 10;              // Stats Panel Y Offset (from header)
input int                statsPanelWidth = 130;         // Stats Panel Width
input int                statsPanelHeight = 65;         // Stats Panel Height
input int                panelFontSize = 13;            // Stats & Legend Font Size
input int                legendHeight = 35;             // Legend Panel Height

sinput group "=== INTERACTION SETTINGS ==="
input bool               enableDragging = true;         // Enable Canvas Dragging
input bool               enableResizing = true;         // Enable Canvas Resizing
input int                resizeGripSize = 8;            // Resize Grip Size (pixels)

//+------------------------------------------------------------------+
//| Global Variables                                                 |
//+------------------------------------------------------------------+
CCanvas mainCanvas;                                     //--- Declare main canvas
string canvasObjectName = "RegressionCanvas_Main";      //--- Set canvas object name

int currentPositionX = initialCanvasX;                  //--- Initialize current X position
int currentPositionY = initialCanvasY;                  //--- Initialize current Y position
int currentWidthPixels = initialCanvasWidth;            //--- Initialize current width
int currentHeightPixels = initialCanvasHeight;          //--- Initialize current height

bool isDraggingCanvas = false;                          //--- Initialize dragging flag
bool isResizingCanvas = false;                          //--- Initialize resizing flag
int dragStartX = 0, dragStartY = 0;                     //--- Initialize drag start coordinates
int canvasStartX = 0, canvasStartY = 0;                 //--- Initialize canvas start coordinates

int resizeStartX = 0, resizeStartY = 0;                 //--- Initialize resize start coordinates
int resizeInitialWidth = 0, resizeInitialHeight = 0;    //--- Initialize resize initial dimensions
ResizeDirection activeResizeMode = NO_RESIZE;           //--- Initialize active resize mode
ResizeDirection hoverResizeMode = NO_RESIZE;            //--- Initialize hover resize mode

bool isHoveringCanvas = false;                          //--- Initialize canvas hover flag
bool isHoveringHeader = false;                          //--- Initialize header hover flag
bool isHoveringResizeZone = false;                      //--- Initialize resize hover flag
int lastMouseX = 0, lastMouseY = 0;                     //--- Initialize last mouse coordinates
int previousMouseButtonState = 0;                       //--- Initialize previous mouse state

const int MIN_CANVAS_WIDTH = 300;                       //--- Set minimum canvas width
const int MIN_CANVAS_HEIGHT = 200;                      //--- Set minimum canvas height
const int HEADER_BAR_HEIGHT = 35;                       //--- Set header bar height

double regressionSlope = 0.0;                           //--- Initialize regression slope
double regressionIntercept = 0.0;                       //--- Initialize regression intercept
double correlationCoefficient = 0.0;                    //--- Initialize correlation coefficient
double rSquared = 0.0;                                  //--- Initialize R-squared

double primaryClosePrices[];                            //--- Declare primary close prices array
double secondaryClosePrices[];                          //--- Declare secondary close prices array
bool dataLoadedSuccessfully = false;                    //--- Initialize data loaded flag
まず実装の最初に、高度な統計計算(線形回帰など)をおこなうために、ALGLIBライブラリを「#include <Math\Alglib\alglib.mqh>」でインクルードします。また、チャートに描画するために、Canvasライブラリを「#include <Canvas\Canvas.mqh>」で読み込みます。続いて、インタラクティブなリサイズ操作を管理するために、ResizeDirection列挙型を定義します。この列挙型には、「リサイズなし」「下辺」「右辺」「右下角」の各オプションを用意し、リサイズ方向を分かりやすく制御できるようにします。入力パラメータはグループごとに整理します。回帰分析の設定として、最大バー数、時間足、分析対象となるメイン銘柄およびサブ銘柄を指定します。Canvas表示では、初期位置、サイズ、余白(パディング)を設定します。また、マスターテーマカラーや枠線表示の有無、回帰線やデータポイントのスタイル、背景の上部カラーと透明度などの表示設定も用意します。さらに、フォントや文字色、統計情報の表示・非表示などのテキスト関連設定に加え、統計パネルや凡例パネルの表示位置とサイズを指定する項目も設けます。加えて、ドラッグ操作やリサイズ機能の有効・無効、およびリサイズグリップのサイズなど、ユーザー操作に関する設定も入力パラメータとして定義します。
グローバル変数では、メインCanvasであるmainCanvasを「RegressionCanvas_Main」という名前で宣言します。また、現在の表示位置とサイズ、ドラッグおよびリサイズの状態を管理するフラグや座標、ホバー状態やマウス位置の追跡用変数、最小サイズやヘッダー高さを表す定数も定義します。さらに、回帰分析で使用する傾きや決定係数などの統計値、各銘柄の価格データを格納する配列、そしてデータが正常に読み込まれたかを管理するフラグもグローバル変数として用意します。次に、配色の管理を容易にするため、カラーテーマを補助するヘルパー関数を定義していきます。
//+------------------------------------------------------------------+
//| Theme Color Helper Functions                                     |
//+------------------------------------------------------------------+
color LightenColor(color baseColor, double factor) {
   uchar r = (uchar)((baseColor >> 16) & 0xFF);                //--- Extract red component
   uchar g = (uchar)((baseColor >> 8) & 0xFF);                 //--- Extract green component
   uchar b = (uchar)(baseColor & 0xFF);                        //--- Extract blue component

   r = (uchar)MathMin(255, r + (255 - r) * factor);            //--- Lighten red
   g = (uchar)MathMin(255, g + (255 - g) * factor);            //--- Lighten green
   b = (uchar)MathMin(255, b + (255 - b) * factor);            //--- Lighten blue

   return (r << 16) | (g << 8) | b;                            //--- Return lightened color
}

color DarkenColor(color baseColor, double factor) {
   uchar r = (uchar)((baseColor >> 16) & 0xFF);                //--- Extract red component
   uchar g = (uchar)((baseColor >> 8) & 0xFF);                 //--- Extract green component
   uchar b = (uchar)(baseColor & 0xFF);                        //--- Extract blue component

   r = (uchar)(r * (1.0 - factor));                            //--- Darken red
   g = (uchar)(g * (1.0 - factor));                            //--- Darken green
   b = (uchar)(b * (1.0 - factor));                            //--- Darken blue

   return (r << 16) | (g << 8) | b;                            //--- Return darkened color
}
ここでは、回帰分析グラフにおけるグラデーションやホバー時の視覚効果を実現するために、マスターテーマカラーを動的に調整する2つのヘルパー関数、LightenColorとDarkenColorを実装します。LightenColorでは、ビットシフト演算を用いて基準色のRGB成分を取り出します。次に、それぞれの成分について、255までの残りの輝度に係数を掛けた値を加算することで明るさを増加させます。このとき、MathMinを使用して各成分が255を超えないように制限し、最後にRGB成分を再結合して新しいカラー値を生成します。
一方、DarkenColorも同様にRGB成分を取得した後、それぞれの成分に(1 - factor)を乗算して輝度を下げることで、より暗い色合いを生成します。これにより、枠線や背景などに適した濃淡を表現できます。これらの関数は、テーマ全体のデザインに統一感を持たせるうえで重要な役割を果たします。1つの基準色からさまざまな色のバリエーションを生成できるため、複数の色を個別に定義することなく、自然なグラデーションやユーザー操作に応じて変化するインタラクティブなUIを実現できます。次に、Canvasを初期化し、分析に使用する銘柄データを読み込みます。コードの保守性や拡張性を高めるため、各処理は関数として分割し、モジュール化された構成で実装していきます。そのため、以下のようなアプローチを採用しました。
//+------------------------------------------------------------------+
//| Create Regression Canvas                                         |
//+------------------------------------------------------------------+
bool CreateCanvas() {
   if (!mainCanvas.CreateBitmapLabel(0, 0, canvasObjectName,
       currentPositionX, currentPositionY, currentWidthPixels, currentHeightPixels,
       COLOR_FORMAT_ARGB_NORMALIZE)) {                          //--- Create bitmap label
      return false;                                             //--- Return failure
   }
   return true;                                                 //--- Return success
}

//+------------------------------------------------------------------+
//| Load Price Data for Regression Analysis                          |
//+------------------------------------------------------------------+
bool loadSymbolClosePrices() {
   if (!SymbolSelect(primarySymbol, true)) {                     //--- Select primary symbol
      Print("ERROR: Primary symbol not found: ", primarySymbol); //--- Print error
      return false;                                              //--- Return failure
   }

   if (!SymbolSelect(secondarySymbol, true)) {                   //--- Select secondary symbol
      Print("ERROR: Secondary symbol not found: ", secondarySymbol); //--- Print error
      return false;                                              //--- Return failure
   }

   int copiedPrimary = CopyClose(primarySymbol, chartTimeframe, 1, maxHistoryBars, primaryClosePrices); //--- Copy primary closes
   if (copiedPrimary <= 0) {                                     //--- Check copy success
      Print("ERROR: Failed to copy data for ", primarySymbol, ". Error: ", GetLastError()); //--- Print error
      return false;                                              //--- Return failure
   }

   int copiedSecondary = CopyClose(secondarySymbol, chartTimeframe, 1, maxHistoryBars, secondaryClosePrices); //--- Copy secondary closes
   if (copiedSecondary <= 0) {                                   //--- Check copy success
      Print("ERROR: Failed to copy data for ", secondarySymbol, ". Error: ", GetLastError()); //--- Print error
      return false;                                              //--- Return failure
   }

   int actualBars = MathMin(copiedPrimary, copiedSecondary);     //--- Get min bars
   ArrayResize(primaryClosePrices, actualBars);                  //--- Resize primary array
   ArrayResize(secondaryClosePrices, actualBars);                //--- Resize secondary array

   dataLoadedSuccessfully = true;                                //--- Set loaded flag
   Print("SUCCESS: Loaded ", actualBars, " bars for both symbols"); //--- Print success
   return true;                                                  //--- Return success
}
まず、回帰分析グラフのメイン描画領域を構築するために、CreateCanvas関数を実装します。この関数では、mainCanvasのCreateBitmapLabelメソッドを使用し、現在の位置とサイズ、およびアルファチャンネルに対応するCOLOR_FORMAT_ARGB_NORMALIZEを指定してCanvasを作成します。Canvasの作成に失敗した場合はfalseを、成功した場合はtrueを返します。この関数は初期化処理の際に呼び出し、グラフ表示の基盤を構築します。
次に、分析に使用する過去データを取得するために、loadSymbolClosePrices関数を作成します。まず、SymbolSelectを使用して対象銘柄を選択し、銘柄が見つからない場合はエラーメッセージを出力します。その後、CopyCloseを使用して主要銘柄と副銘柄の終値データをそれぞれ配列へコピーします。取得したバー数が正の値であることを確認し、失敗した場合はGetLastErrorを利用してエラー内容を取得します。取得したデータの整合性を保つため、両銘柄で取得できたバー数のうち少ない方を採用し、その数に合わせて配列サイズを調整します。続いて、dataLoadedSuccessfullyフラグを設定し、読み込んだバー数をログへ出力した後、trueを返します。これにより、有効なデータが正常に取得できた場合にのみ回帰分析を実行できるようになります。これらの関数を初期化イベントハンドラから呼び出すことで、回帰分析の実行に必要な準備が整います。
//+------------------------------------------------------------------+
//| Expert initialization function                                   |
//+------------------------------------------------------------------+
int OnInit() {
   currentPositionX = initialCanvasX;                           //--- Set current X from input
   currentPositionY = initialCanvasY;                           //--- Set current Y from input
   currentWidthPixels = initialCanvasWidth;                     //--- Set current width from input
   currentHeightPixels = initialCanvasHeight;                   //--- Set current height from input

   if (!CreateCanvas()) {                                       //--- Create canvas or fail
      Print("ERROR: Failed to create regression canvas");       //--- Print error
      return(INIT_FAILED);                                      //--- Return failure
   }

   if (!loadSymbolClosePrices()) {                              //--- Load prices or fail
      Print("ERROR: Failed to load price data for symbols");    //--- Print error
      return(INIT_FAILED);                                      //--- Return failure
   }

   ChartRedraw();                                               //--- Redraw chart

   return(INIT_SUCCEEDED);                                      //--- Return success
}
続いて、OnInitイベントハンドラでは、入力パラメータで指定した初期位置およびサイズを現在の位置とサイズに設定し、Canvasがユーザー指定の位置と大きさで開始されるようにします。次に、CreateCanvasを呼び出してメインの描画領域を初期化します。初期化に失敗した場合はエラーメッセージを出力し、INIT_FAILEDを返して処理を終了します。その後、loadSymbolClosePricesを呼び出して価格データを読み込みます。この処理についても、データの取得に失敗した場合は同様にエラーを出力し、無効な入力データのまま処理が続行されないようINIT_FAILEDを返します。最後に、チャートを再描画して回帰分析グラフを表示し、INIT_SUCCEEDEDを返すことで、インタラクティブな回帰分析をおこなうための初期化処理が完了します。これで可視化の準備が整ったため、次は回帰直線を計算するための回帰方程式を定義し、グラフ描画で利用できるようにします。
//+------------------------------------------------------------------+
//| Calculate Linear Regression Parameters                           |
//+------------------------------------------------------------------+
bool computeLinearRegression() {
   int dataSize = ArraySize(primaryClosePrices);                //--- Get data size
   if (dataSize <= 0 || ArraySize(secondaryClosePrices) != dataSize) { //--- Check valid size
      return false;                                             //--- Return failure
   }

   double tempPrimary[], tempSecondary[];                       //--- Declare temp arrays
   ArraySetAsSeries(tempPrimary, true);                         //--- Set primary as series
   ArraySetAsSeries(tempSecondary, true);                       //--- Set secondary as series
   ArrayCopy(tempPrimary, primaryClosePrices);                  //--- Copy primary
   ArrayCopy(tempSecondary, secondaryClosePrices);              //--- Copy secondary

   CMatrixDouble regressionMatrix(dataSize, 2);                 //--- Create regression matrix

   for (int i = 0; i < dataSize; i++) {                         //--- Loop over data
      regressionMatrix.Set(i, 0, tempPrimary[i]);               //--- Set X value
      regressionMatrix.Set(i, 1, tempSecondary[i]);             //--- Set Y value
   }

   CLinReg linearRegression;                                    //--- Declare linear regression
   CLinearModel linearModel;                                    //--- Declare linear model
   CLRReport regressionReport;                                  //--- Declare report
   int returnCode;                                              //--- Declare return code

   linearRegression.LRBuild(regressionMatrix, dataSize, 1, returnCode, linearModel, regressionReport); //--- Build regression

   if (returnCode != 1) {                                       //--- Check success
      Print("ERROR: Linear regression calculation failed with code: ", returnCode); //--- Print error
      return false;                                             //--- Return failure
   }

   int numberOfVars;                                            //--- Declare vars count
   double coefficientsArray[];                                  //--- Declare coefficients
   linearRegression.LRUnpack(linearModel, coefficientsArray, numberOfVars); //--- Unpack model

   regressionSlope = coefficientsArray[0];                      //--- Set slope
   regressionIntercept = coefficientsArray[1];                  //--- Set intercept

   computeStatistics();                                         //--- Compute statistics

   PrintFormat("Regression Equation: Y = %.6f + %.6f * X", regressionIntercept, regressionSlope); //--- Print equation
   PrintFormat("Correlation: %.4f | R-Squared: %.4f", correlationCoefficient, rSquared); //--- Print stats

   return true;                                                 //--- Return success
}

//+------------------------------------------------------------------+
//| Calculate Regression Statistics                                  |
//+------------------------------------------------------------------+
void computeStatistics() {
   int n = ArraySize(primaryClosePrices);                       //--- Get size
   if (n <= 0) return;                                          //--- Return if empty

   double sumX = 0, sumY = 0, sumXY = 0, sumX2 = 0, sumY2 = 0; //--- Initialize sums

   for (int i = 0; i < n; i++) {                                //--- Loop over data
      double x = primaryClosePrices[i];                         //--- Get X
      double y = secondaryClosePrices[i];                       //--- Get Y

      sumX += x;                                                //--- Accumulate X
      sumY += y;                                                //--- Accumulate Y
      sumXY += x * y;                                           //--- Accumulate XY
      sumX2 += x * x;                                           //--- Accumulate X2
      sumY2 += y * y;                                           //--- Accumulate Y2
   }

   double meanX = sumX / n;                                     //--- Compute mean X
   double meanY = sumY / n;                                     //--- Compute mean Y

   double numerator = n * sumXY - sumX * sumY;                  //--- Compute numerator
   double denominatorX = MathSqrt(n * sumX2 - sumX * sumX);     //--- Compute denominator X
   double denominatorY = MathSqrt(n * sumY2 - sumY * sumY);     //--- Compute denominator Y

   if (denominatorX != 0 && denominatorY != 0) {                //--- Check denominators
      correlationCoefficient = numerator / (denominatorX * denominatorY); //--- Compute correlation
      rSquared = correlationCoefficient * correlationCoefficient; //--- Compute R-squared
   } else {                                                     //--- Handle zero denominators
      correlationCoefficient = 0;                               //--- Set correlation to 0
      rSquared = 0;                                             //--- Set R-squared to 0
   }
}
computeLinearRegression関数では、ALGLIBライブラリを使用して線形回帰分析を実行します。まず、primaryClosePricesのデータ数を取得し、secondaryClosePricesと同じサイズであることを確認します。データサイズが一致しない場合、またはデータが空の場合は、処理中のエラーを防ぐためにfalseを返します。続いて、一時配列であるtempPrimaryとtempSecondaryを用意し、ArraySetAsSeriesを使用して時系列配列として設定します。その後、価格データをこれらの配列へコピーし、サイズがdataSize×2のCMatrixDouble回帰行列を作成します。この行列では、列0に主要銘柄の価格(X)、列1に副銘柄の価格(Y)を格納し、ループ処理によって各データを設定します。
次に、回帰分析に使用するALGLIBオブジェクトとして、CLinReg、CLinearModel、CLRReport、および戻り値を格納する変数を宣言します。その後、linearRegression.LRBuildを呼び出し、回帰行列、データ数、および説明変数の数(1)を指定して回帰モデルを構築します。戻り値であるreturnCodeが1であれば処理成功と判断し、それ以外の場合はエラーメッセージを出力してfalseを返します。回帰モデルの作成に成功したら、linearRegression.LRUnpackを使用してモデルをcoefficientsArrayへ展開します。取得した係数のうち、インデックス0をregressionSlope(傾き)、インデックス1をregressionIntercept(切片)へ代入します。その後、追加の統計情報を計算するためにcomputeStatisticsを呼び出し、最後にPrintFormatを使用して回帰方程式および各種統計値を出力し、trueを返します。
computeStatistics関数では、相関係数と決定係数を手動で計算し、回帰結果を検証します。まず、配列サイズからデータ数nを取得し、X、Y、XY、X²、Y²の合計値を格納する変数を初期化します。続いて、価格配列をループ処理しながら各合計値を計算します。その後、平均値meanXとmeanYをそれぞれ合計値をnで割ることで求めます。さらに、相関係数の分子をn×sumXY - sumX×sumYとして計算し、分母は(n×sumX² - sumX²)および(n×sumY² - sumY²)の平方根から求めます。分母が0でない場合は、分子を分母の積で割ることでピアソンの相関係数(-1~1)を算出し、correlationCoefficientへ格納します。分母が0の場合は、相関係数を0とします。また、決定係数は相関係数を2乗した値として求め、回帰モデルがデータの分散をどの程度説明できるかを表します。これらの統計値は、2つの銘柄間の関係性を定量的に評価するうえで重要です。高い正の相関は両銘柄が類似した値動きを示すことを意味し、ヘッジやペアトレードなどの戦略に役立ちます。一方、R²が低い場合は、回帰モデルの当てはまりが十分でないことを示しており、分析結果の解釈には注意が必要です。これらの処理は、初期化時に呼び出すことで、回帰分析をバックグラウンドで実行できるようになります。次のように初期化処理へ組み込みます。
if (!computeLinearRegression()) {                            //--- Compute regression or fail
   Print("ERROR: Failed to calculate regression parameters"); //--- Print error
   return(INIT_FAILED);                                      //--- Return failure
}
これにより、以下の結果が得られます。

回帰分析が正しく計算されていることを確認できました。これで、計算結果をチャート上へ描画する処理へ進むことができます。ここからは、プロットを可視化するためのCanvasを描画していきます。
//+------------------------------------------------------------------+
//| Render Regression Visualization                                  |
//+------------------------------------------------------------------+
void renderVisualization() {
   mainCanvas.Erase(0);                                         //--- Erase canvas

   if (enableBackgroundFill) {                                  //--- Check background fill
      drawGradientBackground();                                 //--- Draw gradient background
   }

   drawCanvasBorder();                                          //--- Draw border
   drawHeaderBar();                                             //--- Draw header bar

   mainCanvas.Update();                                         //--- Update canvas
}

//+------------------------------------------------------------------+
//| Draw Gradient Background                                         |
//+------------------------------------------------------------------+
void drawGradientBackground() {
   color bottomColor = LightenColor(themeColor, 0.85);          //--- Compute bottom color

   for (int y = HEADER_BAR_HEIGHT; y < currentHeightPixels; y++) { //--- Loop over rows
      double gradientFactor = (double)(y - HEADER_BAR_HEIGHT) / (currentHeightPixels - HEADER_BAR_HEIGHT); //--- Compute factor
      color currentRowColor = InterpolateColors(backgroundTopColor, bottomColor, gradientFactor); //--- Interpolate color
      uchar alphaChannel = (uchar)(255 * backgroundOpacityLevel); //--- Compute alpha
      uint argbColor = ColorToARGB(currentRowColor, alphaChannel); //--- Get ARGB

      for (int x = 0; x < currentWidthPixels; x++) {            //--- Loop over columns
         mainCanvas.PixelSet(x, y, argbColor);                  //--- Set pixel
      }
   }
}

//+------------------------------------------------------------------+
//| Draw Canvas Border                                               |
//+------------------------------------------------------------------+
void drawCanvasBorder() {
   if (!showBorderFrame) return;                                //--- Return if no border

   color borderColor = isHoveringResizeZone ? DarkenColor(themeColor, 0.2) : themeColor; //--- Get border color
   uint argbBorder = ColorToARGB(borderColor, 255);             //--- Get ARGB border

   mainCanvas.Rectangle(0, 0, currentWidthPixels - 1, currentHeightPixels - 1, argbBorder); //--- Draw outer border
   mainCanvas.Rectangle(1, 1, currentWidthPixels - 2, currentHeightPixels - 2, argbBorder); //--- Draw inner border
}

//+------------------------------------------------------------------+
//| Draw Header Bar                                                  |
//+------------------------------------------------------------------+
void drawHeaderBar() {
   color headerColor;                                           //--- Declare header color
   if (isDraggingCanvas) {                                      //--- Check dragging
      headerColor = DarkenColor(themeColor, 0.1);               //--- Set darker color
   } else if (isHoveringHeader) {                               //--- Check hovering
      headerColor = LightenColor(themeColor, 0.4);              //--- Set medium light
   } else {                                                     //--- Default
      headerColor = LightenColor(themeColor, 0.7);              //--- Set very light
   }
   uint argbHeader = ColorToARGB(headerColor, 255);             //--- Get ARGB header

   mainCanvas.FillRectangle(0, 0, currentWidthPixels - 1, HEADER_BAR_HEIGHT, argbHeader); //--- Fill header

   if (showBorderFrame) {                                       //--- Check show border
      uint argbBorder = ColorToARGB(themeColor, 255);           //--- Get ARGB border
      mainCanvas.Rectangle(0, 0, currentWidthPixels - 1, HEADER_BAR_HEIGHT, argbBorder); //--- Draw outer
      mainCanvas.Rectangle(1, 1, currentWidthPixels - 2, HEADER_BAR_HEIGHT - 1, argbBorder); //--- Draw inner
   }

   mainCanvas.FontSet("Arial Bold", titleFontSize);             //--- Set title font
   uint argbText = ColorToARGB(titleTextColor, 255);            //--- Get ARGB text

   string titleText = StringFormat("%s vs %s - Linear Regression", secondarySymbol, primarySymbol); //--- Format title
   mainCanvas.TextOut(currentWidthPixels / 2, (HEADER_BAR_HEIGHT - titleFontSize) / 2,
                                titleText, argbText, TA_CENTER); //--- Draw title
}


//--- We call the visualization function in the initialization event

//+------------------------------------------------------------------+
//| Expert initialization function                                   |
//+------------------------------------------------------------------+
int OnInit() {
   currentPositionX = initialCanvasX;                           //--- Set current X from input
   currentPositionY = initialCanvasY;                           //--- Set current Y from input
   currentWidthPixels = initialCanvasWidth;                     //--- Set current width from input
   currentHeightPixels = initialCanvasHeight;                   //--- Set current height from input

   if (!CreateCanvas()) {                                       //--- Create canvas or fail
      Print("ERROR: Failed to create regression canvas");       //--- Print error
      return(INIT_FAILED);                                      //--- Return failure
   }

   if (!loadSymbolClosePrices()) {                              //--- Load prices or fail
      Print("ERROR: Failed to load price data for symbols");    //--- Print error
      return(INIT_FAILED);                                      //--- Return failure
   }

   if (!computeLinearRegression()) {                            //--- Compute regression or fail
      Print("ERROR: Failed to calculate regression parameters"); //--- Print error
      return(INIT_FAILED);                                      //--- Return failure
   }

   renderVisualization();                                       //--- Render visualization

   ChartSetInteger(0, CHART_EVENT_MOUSE_MOVE, true);            //--- Enable mouse events
   ChartRedraw();                                               //--- Redraw chart

   return(INIT_SUCCEEDED);                                      //--- Return success
}
ここでは、Canvas上にグラフ全体を描画するrenderVisualization関数を実装します。まず、Eraseに0を指定してCanvasをクリアし、描画領域を初期状態に戻します。続いて、enableBackgroundFillがtrueの場合はグラデーション背景を描画し、その後に枠線とヘッダーバーを描画します。最後にUpdateを呼び出して描画内容を反映します。枠線のスタイルや配色は好みに合わせて自由に変更できますが、本稿ではデモンストレーション用としてシンプルなデザインを採用しています。
続いて、drawGradientBackground関数では、ヘッダーの下からCanvas下端までの縦方向グラデーションを描画します。下側の色にはLightenColorを使用してテーマカラーを明るくした色を使用し、各行について補間係数を計算した後、InterpolateColorsで2色を補間します。さらに透明度をARGB形式へ適用し、PixelSetを使用して各行を描画することで、滑らかなグラデーションを実現します。Canvasの枠線を描画するdrawCanvasBorderでは、まずshowBorderFrameを確認し、falseの場合は処理を終了します。表示する場合は、リサイズ操作中のホバー状態に応じてDarkenColorでテーマカラーを暗く調整し、その色をARGB形式へ変換します。その後、Rectangleを使用して外枠と内枠を描画し、立体感のある枠線を表現します。
上部のヘッダー部分を描画するdrawHeaderBarでは、ドラッグ中、ホバー中、通常時の状態に応じて塗りつぶし色を切り替えます。ドラッグ中はDarkenColor、ホバー中および通常時はLightenColorを使用して適切な色を生成します。続いて、ヘッダー領域を塗りつぶし、必要に応じて枠線を描画します。その後、太字のArialフォントを設定し、対象銘柄名を含むタイトル文字列を作成して、ARGB形式の文字色で中央揃えによりTextOutで表示します。OnInitイベントハンドラでは、初期化およびデータ処理が完了した後にrenderVisualizationを呼び出して最初のグラフを描画します。さらに、ChartSetIntegerを使用してマウス移動イベントを有効化し、チャートを再描画することで、初期状態からグラフを表示できるようにします。プログラム開発では、節目ごとにコンパイルと動作確認をおこなうことが重要です。コンパイルすると、次の結果が得られます。

ここまででCanvasの基本的な描画が完成しました。次は、回帰直線とデータポイントを描画し、分析結果を可視化していきます。
//+------------------------------------------------------------------+
//| Calculate optimal ticks with AGGRESSIVE spacing (fills space!)   |
//+------------------------------------------------------------------+
int calculateOptimalTicks(double minValue, double maxValue, int pixelRange, double &tickValues[]) {
   double range = maxValue - minValue;                          //--- Compute range
   if (range == 0 || pixelRange <= 0) {                         //--- Check invalid
      ArrayResize(tickValues, 1);                               //--- Resize to 1
      tickValues[0] = minValue;                                 //--- Set single tick
      return 1;                                                 //--- Return 1
   }

   int targetTickCount = (int)(pixelRange / 50.0);              //--- Compute target count
   if (targetTickCount < 3) targetTickCount = 3;                //--- Min 3
   if (targetTickCount > 20) targetTickCount = 20;              //--- Max 20

   double roughStep = range / (double)(targetTickCount - 1);    //--- Compute rough step

   double magnitude = MathPow(10.0, MathFloor(MathLog10(roughStep))); //--- Compute magnitude

   double normalized = roughStep / magnitude;                   //--- Normalize

   double niceNormalized;                                       //--- Declare nice normalized
   if (normalized <= 1.0) niceNormalized = 1.0;                 //--- Set 1.0
   else if (normalized <= 1.5) niceNormalized = 1.0;            //--- Set 1.0
   else if (normalized <= 2.0) niceNormalized = 2.0;            //--- Set 2.0
   else if (normalized <= 2.5) niceNormalized = 2.0;            //--- Set 2.0
   else if (normalized <= 3.0) niceNormalized = 2.5;            //--- Set 2.5
   else if (normalized <= 4.0) niceNormalized = 4.0;            //--- Set 4.0
   else if (normalized <= 5.0) niceNormalized = 5.0;            //--- Set 5.0
   else if (normalized <= 7.5) niceNormalized = 5.0;            //--- Set 5.0
   else niceNormalized = 10.0;                                  //--- Set 10.0

   double step = niceNormalized * magnitude;                    //--- Compute step

   double tickMin = MathFloor(minValue / step) * step;          //--- Compute tick min
   double tickMax = MathCeil(maxValue / step) * step;           //--- Compute tick max

   int numTicks = (int)MathRound((tickMax - tickMin) / step) + 1; //--- Compute num ticks

   if (numTicks > 25) {                                         //--- Check too many
      step *= 2.0;                                              //--- Double step
      tickMin = MathFloor(minValue / step) * step;              //--- Recalc min
      tickMax = MathCeil(maxValue / step) * step;               //--- Recalc max
      numTicks = (int)MathRound((tickMax - tickMin) / step) + 1; //--- Recalc num
   }

   if (numTicks < 3) {                                          //--- Check too few
      step /= 2.0;                                              //--- Halve step
      tickMin = MathFloor(minValue / step) * step;              //--- Recalc min
      tickMax = MathCeil(maxValue / step) * step;               //--- Recalc max
      numTicks = (int)MathRound((tickMax - tickMin) / step) + 1; //--- Recalc num
   }

   ArrayResize(tickValues, numTicks);                           //--- Resize array
   for (int i = 0; i < numTicks; i++) {                         //--- Loop to set ticks
      tickValues[i] = tickMin + i * step;                       //--- Set tick value
   }

   return numTicks;                                             //--- Return count
}

//+------------------------------------------------------------------+
//| Format tick label with appropriate precision                     |
//+------------------------------------------------------------------+
string formatTickLabel(double value, double range) {
   if (range > 100) return DoubleToString(value, 0);            //--- Format no decimals
   else if (range > 10) return DoubleToString(value, 1);        //--- Format 1 decimal
   else if (range > 1) return DoubleToString(value, 2);         //--- Format 2 decimals
   else if (range > 0.1) return DoubleToString(value, 3);       //--- Format 3 decimals
   else return DoubleToString(value, 4);                        //--- Format 4 decimals
}

//+------------------------------------------------------------------+
//| Draw Regression Plot WITH CUSTOMIZABLE INTERNAL PADDING          |
//+------------------------------------------------------------------+
void drawRegressionPlot() {
   if (!dataLoadedSuccessfully) return;                         //--- Return if no data

   int plotAreaLeft = 60;                                       //--- Set plot left
   int plotAreaRight = currentWidthPixels - 40;                 //--- Set plot right
   int plotAreaTop = HEADER_BAR_HEIGHT + 10;                    //--- Set plot top
   int plotAreaBottom = currentHeightPixels - 50;               //--- Set plot bottom

   int drawAreaLeft = plotAreaLeft + plotPadding;               //--- Set draw left
   int drawAreaRight = plotAreaRight - plotPadding;             //--- Set draw right
   int drawAreaTop = plotAreaTop + plotPadding;                 //--- Set draw top
   int drawAreaBottom = plotAreaBottom - plotPadding;           //--- Set draw bottom

   int plotWidth = drawAreaRight - drawAreaLeft;                //--- Compute plot width
   int plotHeight = drawAreaBottom - drawAreaTop;               //--- Compute plot height

   if (plotWidth <= 0 || plotHeight <= 0) return;               //--- Return if invalid

   double minX = primaryClosePrices[0];                         //--- Init min X
   double maxX = primaryClosePrices[0];                         //--- Init max X
   double minY = secondaryClosePrices[0];                       //--- Init min Y
   double maxY = secondaryClosePrices[0];                       //--- Init max Y

   int dataPoints = ArraySize(primaryClosePrices);              //--- Get data points
   for (int i = 1; i < dataPoints; i++) {                       //--- Loop over points
      if (primaryClosePrices[i] < minX) minX = primaryClosePrices[i]; //--- Update min X
      if (primaryClosePrices[i] > maxX) maxX = primaryClosePrices[i]; //--- Update max X
      if (secondaryClosePrices[i] < minY) minY = secondaryClosePrices[i]; //--- Update min Y
      if (secondaryClosePrices[i] > maxY) maxY = secondaryClosePrices[i]; //--- Update max Y
   }

   double rangeX = maxX - minX;                                 //--- Compute range X
   double rangeY = maxY - minY;                                 //--- Compute range Y

   if (rangeX == 0) rangeX = 1;                                 //--- Set min range X
   if (rangeY == 0) rangeY = 1;                                 //--- Set min range Y

   uint argbAxisColor = ColorToARGB(clrBlack, 255);             //--- Get axis ARGB

   for (int thick = 0; thick < 2; thick++) {                    //--- Loop for thick Y-axis
      mainCanvas.Line(plotAreaLeft - thick, plotAreaTop, plotAreaLeft - thick, plotAreaBottom, argbAxisColor); //--- Draw Y-axis line
   }

   for (int thick = 0; thick < 2; thick++) {                    //--- Loop for thick X-axis
      mainCanvas.Line(plotAreaLeft, plotAreaBottom + thick, plotAreaRight, plotAreaBottom + thick, argbAxisColor); //--- Draw X-axis line
   }

   mainCanvas.FontSet("Arial", axisLabelFontSize);              //--- Set tick font
   uint argbTickLabel = ColorToARGB(clrBlack, 255);             //--- Get tick label ARGB

   double yTickValues[];                                        //--- Declare Y ticks
   int numYTicks = calculateOptimalTicks(minY, maxY, plotHeight, yTickValues); //--- Compute Y ticks

   for (int i = 0; i < numYTicks; i++) {                        //--- Loop over Y ticks
      double yValue = yTickValues[i];                           //--- Get Y value
      if (yValue < minY || yValue > maxY) continue;             //--- Skip out of range

      int yPos = drawAreaBottom - (int)((yValue - minY) / rangeY * plotHeight); //--- Compute Y pos

      mainCanvas.Line(plotAreaLeft - 5, yPos, plotAreaLeft, yPos, argbAxisColor); //--- Draw tick

      string yLabel = formatTickLabel(yValue, rangeY);          //--- Format label
      mainCanvas.TextOut(plotAreaLeft - 8, yPos - axisLabelFontSize/2, yLabel, argbTickLabel, TA_RIGHT); //--- Draw label
   }

   double xTickValues[];                                        //--- Declare X ticks
   int numXTicks = calculateOptimalTicks(minX, maxX, plotWidth, xTickValues); //--- Compute X ticks

   for (int i = 0; i < numXTicks; i++) {                        //--- Loop over X ticks
      double xValue = xTickValues[i];                           //--- Get X value
      if (xValue < minX || xValue > maxX) continue;             //--- Skip out of range

      int xPos = drawAreaLeft + (int)((xValue - minX) / rangeX * plotWidth); //--- Compute X pos

      mainCanvas.Line(xPos, plotAreaBottom, xPos, plotAreaBottom + 5, argbAxisColor); //--- Draw tick

      string xLabel = formatTickLabel(xValue, rangeX);          //--- Format label
      mainCanvas.TextOut(xPos, plotAreaBottom + 7, xLabel, argbTickLabel, TA_CENTER); //--- Draw label
   }

   uint argbPoints = ColorToARGB(dataPointsColor, 255);         //--- Get points ARGB

   for (int i = 0; i < dataPoints; i++) {                       //--- Loop over points
      int screenX = drawAreaLeft + (int)((primaryClosePrices[i] - minX) / rangeX * plotWidth); //--- Compute screen X
      int screenY = drawAreaBottom - (int)((secondaryClosePrices[i] - minY) / rangeY * plotHeight); //--- Compute screen Y

      drawCirclePoint(screenX, screenY, dataPointSize, argbPoints); //--- Draw point
   }

   double lineStartY = regressionIntercept + regressionSlope * minX; //--- Compute start Y
   double lineEndY = regressionIntercept + regressionSlope * maxX; //--- Compute end Y

   int lineStartScreenX = drawAreaLeft;                         //--- Set start screen X
   int lineStartScreenY = drawAreaBottom - (int)((lineStartY - minY) / rangeY * plotHeight); //--- Compute start screen Y
   int lineEndScreenX = drawAreaRight;                          //--- Set end screen X
   int lineEndScreenY = drawAreaBottom - (int)((lineEndY - minY) / rangeY * plotHeight); //--- Compute end screen Y

   uint argbLine = ColorToARGB(regressionLineColor, 255);       //--- Get line ARGB

   for (int w = 0; w < regressionLineWidth; w++) {              //--- Loop for width
      mainCanvas.LineAA(lineStartScreenX, lineStartScreenY + w,
                                  lineEndScreenX, lineEndScreenY + w, argbLine); //--- Draw line
   }

   mainCanvas.FontSet("Arial Bold", labelFontSize);             //--- Set axis label font
   uint argbAxisLabel = ColorToARGB(clrBlack, 255);             //--- Get axis label ARGB

   string xAxisLabel = primarySymbol + " (X-axis)";             //--- Set X label
   mainCanvas.TextOut(currentWidthPixels / 2, currentHeightPixels - 20, xAxisLabel, argbAxisLabel, TA_CENTER); //--- Draw X label

   string yAxisLabel = secondarySymbol + " (Y-axis)";           //--- Set Y label
   mainCanvas.FontAngleSet(900);                                //--- Set vertical angle
   mainCanvas.TextOut(12, currentHeightPixels / 2, yAxisLabel, argbAxisLabel, TA_CENTER); //--- Draw Y label
   mainCanvas.FontAngleSet(0);                                  //--- Reset angle
}

//+------------------------------------------------------------------+
//| Draw Circle Point with Anti-Aliasing (smooth like CGraphic)      |
//+------------------------------------------------------------------+
void drawCirclePoint(int centerX, int centerY, int radius, uint argbColor) {
   uchar srcAlpha = (uchar)((argbColor >> 24) & 0xFF);          //--- Extract source alpha
   uchar srcRed = (uchar)((argbColor >> 16) & 0xFF);            //--- Extract source red
   uchar srcGreen = (uchar)((argbColor >> 8) & 0xFF);           //--- Extract source green
   uchar srcBlue = (uchar)(argbColor & 0xFF);                   //--- Extract source blue

   double radiusDouble = (double)radius + 0.5;                  //--- Adjust radius
   int extent = radius + 2;                                     //--- Compute extent

   for (int dy = -extent; dy <= extent; dy++) {                 //--- Loop over dy
      for (int dx = -extent; dx <= extent; dx++) {              //--- Loop over dx
         double distance = MathSqrt((double)(dx * dx + dy * dy)); //--- Compute distance

         if (distance <= radiusDouble) {                        //--- Check within radius
            double coverage = 1.0;                              //--- Set full coverage
            if (distance > radiusDouble - 1.0) {                //--- Check edge
               coverage = radiusDouble - distance;              //--- Compute coverage
               if (coverage < 0) coverage = 0;                  //--- Clamp min
               if (coverage > 1.0) coverage = 1.0;              //--- Clamp max
            }

            uchar finalAlpha = (uchar)(srcAlpha * coverage);    //--- Compute final alpha
            if (finalAlpha == 0) continue;                      //--- Skip if transparent

            uint pixelColor = ((uint)finalAlpha << 24) | ((uint)srcRed << 16) |
                             ((uint)srcGreen << 8) | (uint)srcBlue; //--- Compose color

            int px = centerX + dx;                              //--- Compute pixel X
            int py = centerY + dy;                              //--- Compute pixel Y
            if (px >= 0 && px < currentWidthPixels && py >= 0 && py < currentHeightPixels) { //--- Check bounds
               blendPixelSet(mainCanvas, px, py, pixelColor);   //--- Blend pixel
            }
         }
      }
   }
}
ここでは、回帰分析結果をCanvas上へ可視化するために、drawRegressionPlot関数を実装します。まず、データが正常に読み込まれていない場合は処理を終了します。続いて、固定マージンを基準にプロット領域を定義し、さらにplotPaddingを適用して内部の余白を確保します。その後、実際の描画領域の幅と高さを計算し、有効なサイズでない場合は処理を終了します。次に、主要銘柄の価格(X)と副銘柄の価格(Y)の最小値および最大値を配列全体から求めます。スケーリング時のゼロ除算を防ぐため、値の範囲が0の場合は1に設定します。その後、黒色をARGB形式へ変換し、Lineを使用してY軸とX軸を2本重ねて描画することで、視認性の高い軸を表現します。
軸ラベルの描画では、まずFontSetを使用してArialフォントを設定し、目盛りの色をARGB形式で準備します。Y軸については、calculateOptimalTicksで目盛り値をyTickValuesへ求め、各目盛り位置に短い目盛り線をLineで描画した後、値の範囲に応じてformatTickLabelで整形したラベルを右揃えで表示します。同様に、X軸についても目盛りを計算し、ラベルを中央揃えで下部へ表示します。データポイントは、各価格を価格範囲と描画領域に応じてスクリーン座標へ変換し、入力パラメータで指定した色をARGB形式へ変換した後、drawCirclePointを使用して指定した半径の円として描画します。
回帰直線については、最小X値および最大X値に対して、切片と傾きを用いて対応するY値を計算します。それらをスクリーン座標へ変換し、ARGB形式へ変換した色を使用してLineAAを複数回描画することでアンチエイリアス処理を施した回帰直線を表示します。最後に、X軸ラベルを太字でCanvas下部中央へ配置し、Y軸ラベルはFontAngleSetを使用して90度回転させ、Canvas左側中央へ縦向きに表示します。描画後はフォントの回転角度を元に戻します。drawCirclePoint関数では、まずARGB成分を取得し、アンチエイリアス処理を考慮した半径を設定します。その後、円の周囲を含めた範囲をループ処理し、MathSqrtで各ピクセルまでの距離を計算します。円の内部は完全な不透明度、境界付近は徐々に透明度を下げるようにカバレッジを求め、最終的なアルファ値とピクセルカラーを計算します。そして、描画範囲内のピクセルに対してblendPixelSetを使用してブレンド描画をおこなうことで、CGraphicと同等の滑らかな円を実現します。この関数を基本描画処理であるrenderVisualizationから呼び出すと、次のような結果が得られます。

このように、回帰分析プロットをCanvas上へ正しく描画できました。残る作業は、Canvas左上に分析結果のサマリーデータをパネルとして表示することです。もちろん、表示位置は自由に変更できます。たとえば、メインCanvasの下部や右側に別のCanvasとして表示することも可能です。しかし今回は、Canvasの中にCanvasを配置する、あるいはオーバーレイ表示を活用する可能性も考慮し、メインCanvas上部へ重ねて表示するデザインを採用しました。この配置の方が、よりモダンで直感的なインターフェースになると考えています。もちろん、この点は用途や好みに応じて自由に変更できます。それでは、この機能を実現するための実装を見ていきましょう。まずは、統計情報パネルから作成します。
//+------------------------------------------------------------------+
//| Draw Statistics Panel AS OVERLAY                                 |
//+------------------------------------------------------------------+
void drawStatisticsPanel() {
   int panelX = statsPanelX;                                    //--- Set panel X
   int panelY = HEADER_BAR_HEIGHT + statsPanelY;                //--- Set panel Y
   int panelWidth = statsPanelWidth;                            //--- Set panel width
   int panelHeight = statsPanelHeight;                          //--- Set panel height

   color panelBgColor = LightenColor(themeColor, 0.9);          //--- Compute bg color
   uchar bgAlpha = 153;                                         //--- Set alpha
   uint argbPanelBg = ColorToARGB(panelBgColor, bgAlpha);       //--- Get panel bg ARGB
   uint argbBorder = ColorToARGB(themeColor, 255);              //--- Get border ARGB
   uint argbText = ColorToARGB(clrBlack, 255);                  //--- Get text ARGB

   for (int y = panelY; y <= panelY + panelHeight; y++) {       //--- Loop over rows
      for (int x = panelX; x <= panelX + panelWidth; x++) {     //--- Loop over columns
         blendPixelSet(mainCanvas, x, y, argbPanelBg);          //--- Blend bg pixel
      }
   }

   for (int x = panelX; x <= panelX + panelWidth; x++) {        //--- Draw top border
      blendPixelSet(mainCanvas, x, panelY, argbBorder);         //--- Blend border pixel
   }
   for (int y = panelY; y <= panelY + panelHeight; y++) {       //--- Draw right border
      blendPixelSet(mainCanvas, panelX + panelWidth, y, argbBorder); //--- Blend border pixel
   }
   for (int y = panelY; y <= panelY + panelHeight; y++) {       //--- Draw left border
      blendPixelSet(mainCanvas, panelX, y, argbBorder);         //--- Blend border pixel
   }

   mainCanvas.FontSet("Arial", panelFontSize);                  //--- Set stats font

   int textY = panelY + 8;                                      //--- Set text Y
   int lineSpacing = panelFontSize;                             //--- Set line spacing

   string equationText = StringFormat("Y = %.3f + %.3f * X", regressionIntercept, regressionSlope); //--- Format equation
   mainCanvas.TextOut(panelX + 8, textY, equationText, argbText, TA_LEFT); //--- Draw equation
   textY += lineSpacing;                                        //--- Update Y

   string correlationText = StringFormat("Correlation: %.4f", correlationCoefficient); //--- Format correlation
   mainCanvas.TextOut(panelX + 8, textY, correlationText, argbText, TA_LEFT); //--- Draw correlation
   textY += lineSpacing;                                        //--- Update Y

   string rSquaredText = StringFormat("R-Squared: %.4f", rSquared); //--- Format R-squared
   mainCanvas.TextOut(panelX + 8, textY, rSquaredText, argbText, TA_LEFT); //--- Draw R-squared
   textY += lineSpacing;                                        //--- Update Y

   string dataPointsText = StringFormat("Points: %d", ArraySize(primaryClosePrices)); //--- Format points
   mainCanvas.TextOut(panelX + 8, textY, dataPointsText, argbText, TA_LEFT); //--- Draw points
}
drawStatisticsPanel関数では、回帰分析の統計指標を表示する半透明パネルをCanvas上にオーバーレイ表示する処理を実装します。このパネルは、statsPanelXなどの入力パラメータを基準に配置し、ヘッダーの高さを考慮したオフセット位置から描画を開始します。パネルの幅と高さは固定値として設定します。次に、背景色にはLightenColorを使用してテーマカラーを明るくした色を適用します。さらに、透明度を153に設定して適度な透過効果を持たせ、ARGB形式へ変換します。その後、ネストしたループ処理とblendPixelSetを使用して、既存の描画内容の上へパネル領域を1ピクセルずつブレンド描画します。これにより、背景のグラフを隠すことなく、自然に統合された表示を実現します。
パネルの枠を作成するために、上下左右の辺をそれぞれ描画します。ここでは完全な矩形描画ではなく、ループ処理内で枠線ピクセルをテーマカラーのARGB値とブレンドする方法を採用し、シンプルなアウトラインを形成します。続いて、panelFontSizeを使用してArialフォントを設定します。テキストの開始位置となるY座標をパディング値から初期化し、フォントサイズを基準にした行間を設定します。その後、StringFormatで回帰方程式を文字列化し、TextOutを使用して左揃えで表示します。描画後はY座標を更新し、同様の処理で相関係数、決定係数、データポイント数(配列サイズから取得)を順番に表示します。この統計パネルでは、Y = 切片 + 傾き × Xという形式の回帰式をはじめ、重要な分析指標をコンパクトに表示できます。そのため、メインのプロット領域を複雑にすることなく、分析結果の理解を容易にします。凡例パネルについても、同様のアプローチを使用して実装しました。
//+------------------------------------------------------------------+
//| Draw Legend                                                      |
//+------------------------------------------------------------------+
void drawLegend() {
   int legendX = statsPanelX;                                   //--- Set legend X
   int legendY = HEADER_BAR_HEIGHT + statsPanelY + statsPanelHeight; //--- Set legend Y
   int legendWidth = statsPanelWidth;                           //--- Set legend width
   int legendHeightThis = legendHeight;                         //--- Set legend height

   color legendBgColor = LightenColor(themeColor, 0.9);         //--- Compute bg color
   uchar bgAlpha = 153;                                         //--- Set alpha
   uint argbLegendBg = ColorToARGB(legendBgColor, bgAlpha);     //--- Get legend bg ARGB
   uint argbBorder = ColorToARGB(themeColor, 255);              //--- Get border ARGB
   uint argbText = ColorToARGB(clrBlack, 255);                  //--- Get text ARGB

   for (int y = legendY; y <= legendY + legendHeightThis; y++) { //--- Loop over rows
      for (int x = legendX; x <= legendX + legendWidth; x++) {  //--- Loop over columns
         blendPixelSet(mainCanvas, x, y, argbLegendBg);         //--- Blend bg pixel
      }
   }

   for (int x = legendX; x <= legendX + legendWidth; x++) {     //--- Draw top border
      blendPixelSet(mainCanvas, x, legendY, argbBorder);        //--- Blend border pixel
   }
   for (int y = legendY; y <= legendY + legendHeightThis; y++) { //--- Draw right border
      blendPixelSet(mainCanvas, legendX + legendWidth, y, argbBorder); //--- Blend border pixel
   }
   for (int x = legendX; x <= legendX + legendWidth; x++) {     //--- Draw bottom border
      blendPixelSet(mainCanvas, x, legendY + legendHeightThis, argbBorder); //--- Blend border pixel
   }
   for (int y = legendY; y <= legendY + legendHeightThis; y++) { //--- Draw left border
      blendPixelSet(mainCanvas, legendX, y, argbBorder);        //--- Blend border pixel
   }

   mainCanvas.FontSet("Arial", panelFontSize);                  //--- Set legend font

   int itemY = legendY + 10;                                    //--- Set item Y
   int lineSpacing = panelFontSize;                             //--- Set line spacing

   uint argbRedDot = ColorToARGB(dataPointsColor, 255);         //--- Get red dot ARGB
   drawCirclePoint(legendX + 12, itemY, dataPointSize, argbRedDot); //--- Draw data point
   mainCanvas.TextOut(legendX + 22, itemY - 4, "Data Points", argbText, TA_LEFT); //--- Draw data label
   itemY += lineSpacing;                                        //--- Update Y

   uint argbBlueLine = ColorToARGB(regressionLineColor, 255);   //--- Get blue line ARGB
   for (int i = 0; i < 15; i++) {                               //--- Loop to draw line
      blendPixelSet(mainCanvas, legendX + 7 + i, itemY, argbBlueLine); //--- Blend line pixel
      blendPixelSet(mainCanvas, legendX + 7 + i, itemY + 1, argbBlueLine); //--- Blend below pixel
   }
   mainCanvas.TextOut(legendX + 27, itemY - 4, "Regression Line", argbText, TA_LEFT); //--- Draw line label
}
drawLegend関数では、視覚的な凡例情報を表示するための半透明オーバーレイパネルを追加実装します。このパネルは統計情報パネルの下に配置し、statsPanelXを基準にX座標を設定します。Y座標については、統計パネルの高さを考慮して算出し、幅は統計パネルと同じ値を使用し、高さは入力パラメータで指定した凡例パネルの高さを適用します。次に、背景色にはLightenColorを使用してテーマカラーを明るくした色を設定します。透明度を153に設定した後、ARGB形式へ変換し、ネストしたループ処理とblendPixelSetを使用して領域全体へ描画します。これにより、既存のグラフ表示と自然に融合する半透明パネルを作成します。枠線については、統計パネルと同様の方法を使用します。テーマカラーのARGB値を用いて、上辺、右辺、下辺、左辺を順番に描画し、シンプルなアウトラインを形成します。
続いて、panelFontSizeでArialフォントを設定し、パディング値とフォントサイズから計算した行間を使用して、各凡例項目の開始位置となるY座標を初期化します。まず、データポイントを示すために、調整した位置へdrawCirclePointを使用して赤色の円形アイコンを描画します。その横にTextOutを使用して「Data Points」というラベルを左揃えで表示し、次の項目へ進むためにY座標を更新します。次に、回帰直線を表すために、回帰線カラーのARGB値を使用して短い青色のラインを描画します。水平方向に15ピクセル分の線分をブレンドし、さらに下側の1行にも描画することで線の太さを確保します。その後、同様に「Regression Line」というラベルを表示します。これにより、ユーザーはグラフ上の各要素を容易に識別できます。これらの関数を呼び出すと、次の結果が得られます。

統計パネルと凡例パネルの追加が完了しました。次は、リサイズインジケータの処理へ進みます。この機能では、下辺、右辺、および右下角へマウスを移動した際に、リサイズ可能であることを示します。これまで本連載で作成してきたツールでは、アイコンを使用してこのような状態表示をおこなっていました。しかし今回は、外部素材を使用せず、Canvas上で直接ブレンド処理をおこなってインジケータを描画する別の方法を採用します。この処理を実現するには、チャートイベントを処理する必要があります。そこで、ここからはすべてのチャートイベントをまとめて処理する実装へ進みます。
//+------------------------------------------------------------------+
//| Draw Resize Indicator                                            |
//+------------------------------------------------------------------+
void drawResizeIndicator() {
   uint argbIndicator = ColorToARGB(themeColor, 255);           //--- Get indicator ARGB

   if (hoverResizeMode == RESIZE_CORNER || activeResizeMode == RESIZE_CORNER) { //--- Check corner
      int cornerX = currentWidthPixels - resizeGripSize;        //--- Compute corner X
      int cornerY = currentHeightPixels - resizeGripSize;       //--- Compute corner Y

      mainCanvas.FillRectangle(cornerX, cornerY, currentWidthPixels - 1, currentHeightPixels - 1, argbIndicator); //--- Fill corner

      for (int i = 0; i < 3; i++) {                             //--- Loop for lines
         int offset = i * 3;                                    //--- Compute offset
         mainCanvas.Line(cornerX + offset, currentHeightPixels - 1,
                                  currentWidthPixels - 1, cornerY + offset, argbIndicator); //--- Draw diagonal
      }
   }

   if (hoverResizeMode == RESIZE_RIGHT_EDGE || activeResizeMode == RESIZE_RIGHT_EDGE) { //--- Check right
      int indicatorY = currentHeightPixels / 2 - 15;            //--- Compute indicator Y
      mainCanvas.FillRectangle(currentWidthPixels - 3, indicatorY,
                                        currentWidthPixels - 1, indicatorY + 30, argbIndicator); //--- Fill right
   }

   if (hoverResizeMode == RESIZE_BOTTOM_EDGE || activeResizeMode == RESIZE_BOTTOM_EDGE) { //--- Check bottom
      int indicatorX = currentWidthPixels / 2 - 15;             //--- Compute indicator X
      mainCanvas.FillRectangle(indicatorX, currentHeightPixels - 3,
                                        indicatorX + 30, currentHeightPixels - 1, argbIndicator); //--- Fill bottom
   }
}

//+------------------------------------------------------------------+
//| Check if Mouse is Over Header                                    |
//+------------------------------------------------------------------+
bool isMouseOverHeaderBar(int mouseX, int mouseY) {
   return (mouseX >= currentPositionX && mouseX <= currentPositionX + currentWidthPixels &&
           mouseY >= currentPositionY && mouseY <= currentPositionY + HEADER_BAR_HEIGHT); //--- Return if over header
}

//+------------------------------------------------------------------+
//| Check if Mouse is in Resize Zone                                 |
//+------------------------------------------------------------------+
bool isMouseInResizeZone(int mouseX, int mouseY, ResizeDirection &resizeMode) {
   if (!enableResizing) return false;                           //--- Return false if disabled

   int relativeX = mouseX - currentPositionX;                   //--- Compute relative X
   int relativeY = mouseY - currentPositionY;                   //--- Compute relative Y

   bool nearRightEdge = (relativeX >= currentWidthPixels - resizeGripSize &&
                         relativeX <= currentWidthPixels &&
                         relativeY >= HEADER_BAR_HEIGHT &&
                         relativeY <= currentHeightPixels);     //--- Check right edge

   bool nearBottomEdge = (relativeY >= currentHeightPixels - resizeGripSize &&
                          relativeY <= currentHeightPixels &&
                          relativeX >= 0 &&
                          relativeX <= currentWidthPixels);     //--- Check bottom edge

   bool nearCorner = (relativeX >= currentWidthPixels - resizeGripSize &&
                      relativeX <= currentWidthPixels &&
                      relativeY >= currentHeightPixels - resizeGripSize &&
                      relativeY <= currentHeightPixels);      //--- Check corner

   if (nearCorner) {                                            //--- Set corner
      resizeMode = RESIZE_CORNER;                               //--- Set mode
      return true;                                              //--- Return true
   } else if (nearRightEdge) {                                  //--- Set right
      resizeMode = RESIZE_RIGHT_EDGE;                           //--- Set mode
      return true;                                              //--- Return true
   } else if (nearBottomEdge) {                                 //--- Set bottom
      resizeMode = RESIZE_BOTTOM_EDGE;                          //--- Set mode
      return true;                                              //--- Return true
   }

   resizeMode = NO_RESIZE;                                      //--- Set no resize
   return false;                                                //--- Return false
}

//+------------------------------------------------------------------+
//| Handle Canvas Resizing                                           |
//+------------------------------------------------------------------+
void handleCanvasResize(int mouseX, int mouseY) {
   int deltaX = mouseX - resizeStartX;                          //--- Compute delta X
   int deltaY = mouseY - resizeStartY;                          //--- Compute delta Y

   int newWidth = currentWidthPixels;                           //--- Init new width
   int newHeight = currentHeightPixels;                         //--- Init new height

   if (activeResizeMode == RESIZE_RIGHT_EDGE || activeResizeMode == RESIZE_CORNER) { //--- Check right or corner
      newWidth = MathMax(MIN_CANVAS_WIDTH, resizeInitialWidth + deltaX); //--- Compute new width
   }

   if (activeResizeMode == RESIZE_BOTTOM_EDGE || activeResizeMode == RESIZE_CORNER) { //--- Check bottom or corner
      newHeight = MathMax(MIN_CANVAS_HEIGHT, resizeInitialHeight + deltaY); //--- Compute new height
   }

   int chartWidth = (int)ChartGetInteger(0, CHART_WIDTH_IN_PIXELS); //--- Get chart width
   int chartHeight = (int)ChartGetInteger(0, CHART_HEIGHT_IN_PIXELS); //--- Get chart height

   newWidth = MathMin(newWidth, chartWidth - currentPositionX - 10); //--- Clamp width
   newHeight = MathMin(newHeight, chartHeight - currentPositionY - 10); //--- Clamp height

   if (newWidth != currentWidthPixels || newHeight != currentHeightPixels) { //--- Check changed
      currentWidthPixels = newWidth;                            //--- Update width
      currentHeightPixels = newHeight;                          //--- Update height

      mainCanvas.Resize(currentWidthPixels, currentHeightPixels); //--- Resize canvas
      ObjectSetInteger(0, canvasObjectName, OBJPROP_XSIZE, currentWidthPixels); //--- Set X size
      ObjectSetInteger(0, canvasObjectName, OBJPROP_YSIZE, currentHeightPixels); //--- Set Y size

      renderVisualization();                                     //--- Render again
      ChartRedraw();                                             //--- Redraw chart
   }
}

//+------------------------------------------------------------------+
//| Handle Canvas Dragging                                           |
//+------------------------------------------------------------------+
void handleCanvasDrag(int mouseX, int mouseY) {
   int deltaX = mouseX - dragStartX;                            //--- Compute delta X
   int deltaY = mouseY - dragStartY;                            //--- Compute delta Y

   int newX = canvasStartX + deltaX;                            //--- Compute new X
   int newY = canvasStartY + deltaY;                            //--- Compute new Y

   int chartWidth = (int)ChartGetInteger(0, CHART_WIDTH_IN_PIXELS); //--- Get chart width
   int chartHeight = (int)ChartGetInteger(0, CHART_HEIGHT_IN_PIXELS); //--- Get chart height

   newX = MathMax(0, MathMin(chartWidth - currentWidthPixels, newX)); //--- Clamp X
   newY = MathMax(0, MathMin(chartHeight - currentHeightPixels, newY)); //--- Clamp Y

   currentPositionX = newX;                                     //--- Update X
   currentPositionY = newY;                                     //--- Update Y

   ObjectSetInteger(0, canvasObjectName, OBJPROP_XDISTANCE, currentPositionX); //--- Set X distance
   ObjectSetInteger(0, canvasObjectName, OBJPROP_YDISTANCE, currentPositionY); //--- Set Y distance

   ChartRedraw();                                               //--- Redraw chart
}

//+------------------------------------------------------------------+
//| Interpolate Between Two Colors                                   |
//+------------------------------------------------------------------+
color InterpolateColors(color startColor, color endColor, double factor) {
   uchar r1 = (uchar)((startColor >> 16) & 0xFF);              //--- Extract start red
   uchar g1 = (uchar)((startColor >> 8) & 0xFF);               //--- Extract start green
   uchar b1 = (uchar)(startColor & 0xFF);                      //--- Extract start blue

   uchar r2 = (uchar)((endColor >> 16) & 0xFF);                //--- Extract end red
   uchar g2 = (uchar)((endColor >> 8) & 0xFF);                 //--- Extract end green
   uchar b2 = (uchar)(endColor & 0xFF);                        //--- Extract end blue

   uchar r = (uchar)(r1 + factor * (r2 - r1));                 //--- Interpolate red
   uchar g = (uchar)(g1 + factor * (g2 - g1));                 //--- Interpolate green
   uchar b = (uchar)(b1 + factor * (b2 - b1));                 //--- Interpolate blue

   return (r << 16) | (g << 8) | b;                            //--- Return interpolated color
}

//+------------------------------------------------------------------+
//| Blend pixel with proper alpha blending                           |
//+------------------------------------------------------------------+
void blendPixelSet(CCanvas &canvas, int x, int y, uint src) {
   if (x < 0 || x >= canvas.Width() || y < 0 || y >= canvas.Height()) return; //--- Return if out of bounds

   uint dst = canvas.PixelGet(x, y);                            //--- Get destination pixel

   double sa = ((src >> 24) & 0xFF) / 255.0;                    //--- Compute source alpha
   double sr = ((src >> 16) & 0xFF) / 255.0;                    //--- Compute source red
   double sg = ((src >> 8) & 0xFF) / 255.0;                     //--- Compute source green
   double sb = (src & 0xFF) / 255.0;                            //--- Compute source blue

   double da = ((dst >> 24) & 0xFF) / 255.0;                    //--- Compute dest alpha
   double dr = ((dst >> 16) & 0xFF) / 255.0;                    //--- Compute dest red
   double dg = ((dst >> 8) & 0xFF) / 255.0;                     //--- Compute dest green
   double db = (dst & 0xFF) / 255.0;                            //--- Compute dest blue

   double out_a = sa + da * (1 - sa);                           //--- Compute out alpha
   if (out_a == 0) {                                            //--- Check transparent
      canvas.PixelSet(x, y, 0);                                 //--- Set transparent
      return;                                                   //--- Return
   }

   double out_r = (sr * sa + dr * da * (1 - sa)) / out_a;       //--- Compute out red
   double out_g = (sg * sa + dg * da * (1 - sa)) / out_a;       //--- Compute out green
   double out_b = (sb * sa + db * da * (1 - sa)) / out_a;       //--- Compute out blue

   uchar oa = (uchar)(out_a * 255 + 0.5);                       //--- Compute final alpha
   uchar or_ = (uchar)(out_r * 255 + 0.5);                      //--- Compute final red
   uchar og = (uchar)(out_g * 255 + 0.5);                       //--- Compute final green
   uchar ob = (uchar)(out_b * 255 + 0.5);                       //--- Compute final blue

   uint out_col = ((uint)oa << 24) | ((uint)or_ << 16) | ((uint)og << 8) | (uint)ob; //--- Compose color
   canvas.PixelSet(x, y, out_col);                              //--- Set blended pixel
}
まず、Canvas上でリサイズ操作を視覚的に示すために、drawResizeIndicator関数を実装します。この関数では、最初にテーマカラーをARGB形式へ変換します。コーナーモード(ホバー中またはアクティブ状態)の場合は、FillRectangleを使用して右下部分に小さな正方形を塗りつぶします。その後、3ピクセルずつ位置をずらした3本の斜線をLineで描画し、リサイズグリップのような視覚効果を作成します。右辺の場合は、辺の中央に配置した縦長の矩形をFillRectangleで描画します。同様に下辺の場合は、横長の矩形を描画します。これにより、画面を過度に複雑化することなく、ユーザーに直感的なリサイズ可能領域を提示できます。次に、isMouseOverHeaderBar関数では、マウス位置がヘッダーバーの範囲内にあるかを確認します。範囲内であればtrueを返し、ドラッグ操作が可能な状態であることを示します。
リサイズ領域を検出するために、isMouseInResizeZone関数を実装します。この関数では、まずリサイズ機能が有効かどうかを確認します。その後、Canvas内部での相対座標を計算し、resizeGripSizeを基準として、右辺、下辺、または右下コーナー付近にマウスがあるかを判定します。条件に一致した場合は、RESIZE_CORNERなどのリサイズモードを設定し、trueを返します。一致しない場合は、モードをNO_RESIZEに設定し、falseを返します。handleCanvasResize関数では、リサイズ開始時の座標との差分を計算します。その後、現在のリサイズモードに応じて、新しい幅や高さを調整します。右辺、下辺、または右下コーナーの各モードに対応し、MathMaxを使用して最小サイズを下回らないよう制御します。さらに、ChartGetIntegerを使用してチャートのサイズを取得し、Canvasがチャート領域からはみ出さないように最大サイズを制限します。サイズが変更された場合は、グローバル変数を更新し、ResizeでCanvasサイズを変更します。その後、ObjectSetIntegerでオブジェクトサイズを更新し、renderVisualizationを再実行してグラフ全体を再描画し、最後にチャートを更新します。
ドラッグ操作については、handleCanvasDrag関数で処理します。この関数では、マウス移動量からX方向とY方向の差分を計算し、新しい表示位置を求めます。その後、ChartGetIntegerから取得したチャート領域を基準にして位置を制限し、Canvasが画面外へ移動しないようにします。新しい位置をグローバル変数へ反映した後、ObjectSetIntegerを使用してオブジェクト位置を更新し、チャートを再描画します。続いて、2つの色を混合するためのInterpolateColors関数を定義します。この関数ではRGB成分を分解し、各チャンネルを線形補間した後、再び1つのカラー値へ結合します。これにより、グラデーション描画などで滑らかな色変化を実現できます。最後に、オーバーレイ表示で使用するアルファブレンディング処理として、blendPixelSet関数を実装します。この関数では、まず描画範囲外かどうかを確認し、続いて描画元と描画先のRGBおよびアルファ成分を取得します。その後、出力アルファ値とアルファ付きRGB値を計算し、各値を符号なし文字範囲へ制限します。最後にカラー値を再構成し、PixelSetメソッドを使用してピクセルへ設定します。 この処理により、統計パネルや凡例パネルのような半透明オーバーレイを滑らかに合成できるようになります。リサイズインジケータを表示するため、まずメイン描画処理であるrenderVisualization内からこの関数を呼び出します。
//+------------------------------------------------------------------+
//| Render Regression Visualization                                  |
//+------------------------------------------------------------------+
void renderVisualization() {
   mainCanvas.Erase(0);                                         //--- Erase canvas

   if (enableBackgroundFill) {                                  //--- Check background fill
      drawGradientBackground();                                 //--- Draw gradient background
   }

   drawCanvasBorder();                                          //--- Draw border
   drawHeaderBar();                                             //--- Draw header bar
   drawRegressionPlot();                                        //--- Draw plot

   if (showStatistics) {                                        //--- Check show statistics
      drawStatisticsPanel();                                    //--- Draw stats panel
      drawLegend();                                             //--- Draw legend
   }

   if (isHoveringResizeZone && enableResizing) {                //--- Check resize hover
      drawResizeIndicator();                                    //--- Draw resize indicator
   }

   mainCanvas.Update();                                         //--- Update canvas
}
プログラムを実行すると、下のような結果が得られます。

画像から確認できるように、リサイズインジケーターはCanvas全体のデザインに自然に溶け込み、違和感なく表示されています。これでリサイズ状態を視覚的に示す処理が完成しました。次は、チャートイベントハンドラを使用して、実際の操作処理であるリサイズやドラッグ機能を実装していきます。
//+------------------------------------------------------------------+
//| Chart Event Handler                                              |
//+------------------------------------------------------------------+
void OnChartEvent(const int id, const long &lparam, const double &dparam, const string &sparam) {
   if (id == CHARTEVENT_MOUSE_MOVE) {                           //--- Check mouse move
      int mouseX = (int)lparam;                                 //--- Set mouse X
      int mouseY = (int)dparam;                                 //--- Set mouse Y
      int mouseState = (int)sparam;                             //--- Set mouse state

      bool previousHoverState = isHoveringCanvas;               //--- Store prev canvas hover
      bool previousHeaderHoverState = isHoveringHeader;         //--- Store prev header hover
      bool previousResizeHoverState = isHoveringResizeZone;     //--- Store prev resize hover

      isHoveringCanvas = (mouseX >= currentPositionX && mouseX <= currentPositionX + currentWidthPixels &&
                         mouseY >= currentPositionY && mouseY <= currentPositionY + currentHeightPixels); //--- Update canvas hover

      isHoveringHeader = isMouseOverHeaderBar(mouseX, mouseY);  //--- Update header hover

      isHoveringResizeZone = isMouseInResizeZone(mouseX, mouseY, hoverResizeMode); //--- Update resize hover

      bool needRedraw = (previousHoverState != isHoveringCanvas ||
                        previousHeaderHoverState != isHoveringHeader ||
                        previousResizeHoverState != isHoveringResizeZone); //--- Check if redraw needed

      if (mouseState == 1 && previousMouseButtonState == 0) {   //--- Check button press
         if (enableDragging && isHoveringHeader && !isHoveringResizeZone) { //--- Check drag start
            isDraggingCanvas = true;                            //--- Set dragging
            dragStartX = mouseX;                               //--- Set start X
            dragStartY = mouseY;                               //--- Set start Y
            canvasStartX = currentPositionX;                   //--- Set canvas X
            canvasStartY = currentPositionY;                   //--- Set canvas Y
            ChartSetInteger(0, CHART_MOUSE_SCROLL, false);     //--- Disable scroll
            needRedraw = true;                                 //--- Set redraw
         } else if (isHoveringResizeZone) {                    //--- Check resize start
            isResizingCanvas = true;                           //--- Set resizing
            activeResizeMode = hoverResizeMode;                //--- Set active mode
            resizeStartX = mouseX;                             //--- Set start X
            resizeStartY = mouseY;                             //--- Set start Y
            resizeInitialWidth = currentWidthPixels;           //--- Set initial width
            resizeInitialHeight = currentHeightPixels;         //--- Set initial height
            ChartSetInteger(0, CHART_MOUSE_SCROLL, false);     //--- Disable scroll
            needRedraw = true;                                 //--- Set redraw
         }
      }
      else if (mouseState == 1 && previousMouseButtonState == 1) { //--- Check drag
         if (isDraggingCanvas) {                               //--- Handle drag
            handleCanvasDrag(mouseX, mouseY);                  //--- Handle drag
         } else if (isResizingCanvas) {                        //--- Handle resize
            handleCanvasResize(mouseX, mouseY);                //--- Handle resize
         }
      }
      else if (mouseState == 0 && previousMouseButtonState == 1) { //--- Check button release
         if (isDraggingCanvas || isResizingCanvas) {           //--- Check active
            isDraggingCanvas = false;                          //--- Reset dragging
            isResizingCanvas = false;                          //--- Reset resizing
            activeResizeMode = NO_RESIZE;                      //--- Reset mode
            ChartSetInteger(0, CHART_MOUSE_SCROLL, true);      //--- Enable scroll
            needRedraw = true;                                 //--- Set redraw
         }
      }

      if (needRedraw) {                                         //--- Check redraw
         renderVisualization();                                 //--- Render
         ChartRedraw();                                         //--- Redraw chart
      }

      lastMouseX = mouseX;                                      //--- Update last X
      lastMouseY = mouseY;                                      //--- Update last Y
      previousMouseButtonState = mouseState;                    //--- Update prev state
   }
}
OnChartEventイベントハンドラを使用して、ドラッグ操作やリサイズ操作などのインタラクティブ機能を管理します。まず、イベントがCHARTEVENT_MOUSE_MOVEであるかを確認し、パラメータからマウス座標と状態を取得します。次に、以前のホバー状態を保存し、Canvas上のホバー状態(全体範囲)、isMouseOverHeaderBarによるヘッダーバー上の状態、およびisMouseInResizeZoneによるリサイズ領域の状態を更新します。isMouseInResizeZoneではhoverResizeModeが設定され、この値の変化によって再描画が必要かどうかを判断します。
マウスボタンが押された場合(状態が1、以前の状態が0の場合)、ドラッグ機能が有効で、かつヘッダーバー上にマウスがあり、リサイズ状態ではない場合は、isDraggingCanvasをtrueに設定します。その後、開始位置を保存し、ChartSetIntegerを使用してチャートスクロールを無効化し、再描画フラグを設定します。リサイズ領域上にある場合は、isResizingCanvasをtrueに設定し、現在のリサイズモード、開始位置、初期サイズを保存した後、チャートスクロールを無効化します。マウスボタンを押したままの場合(状態が1、以前の状態も1の場合)、ドラッグ中であればhandleCanvasDragを呼び出し、リサイズ中であればhandleCanvasResizeを呼び出します。マウスボタンを離した場合(状態が0、以前の状態が1の場合)は、各フラグをリセットし、リサイズモードを初期状態に戻します。その後、ChartSetIntegerでチャートスクロールを再度有効化し、再描画フラグを設定します。再描画が必要な場合は、renderVisualizationを呼び出してCanvasを更新し、ChartRedrawでチャートを再描画します。最後に、次回の処理に備えて、現在のマウス位置と以前のマウス状態を更新します。不要になった場合は、Canvasを削除する処理も追加する必要があります。
//+------------------------------------------------------------------+
//| Expert deinitialization function                                 |
//+------------------------------------------------------------------+
void OnDeinit(const int reason) {
   mainCanvas.Destroy();                                        //--- Destroy canvas
   ChartRedraw();                                               //--- Redraw chart
}

//+------------------------------------------------------------------+
//| Expert tick function                                             |
//+------------------------------------------------------------------+
void OnTick() {
   static datetime lastBarTimestamp = 0;                        //--- Store last bar time
   datetime currentBarTimestamp = iTime(_Symbol, chartTimeframe, 0); //--- Get current bar time

   if (currentBarTimestamp > lastBarTimestamp) {                //--- Check new bar
      if (loadSymbolClosePrices()) {                            //--- Reload prices
         if (computeLinearRegression()) {                       //--- Recalculate regression
            renderVisualization();                              //--- Update visualization
            ChartRedraw();                                      //--- Redraw chart
         }
      }
      lastBarTimestamp = currentBarTimestamp;                   //--- Update last time
   }
}
OnDeinitイベントハンドラでは、終了処理としてDestroyを使用してメインCanvasを破棄し、リソースを解放します。その後、ChartRedrawを使用してチャートを再描画し、残っている表示要素を削除します。OnTickイベントハンドラでは、静的変数lastBarTimestampを使用して、直前のバー時間を記録します。銘柄と時間足からiTimeで現在のバー時間を取得し、前回の時間と比較します。新しいバーが形成された場合は、loadSymbolClosePricesで価格データを再読み込みし、computeLinearRegressionで回帰計算を再実行します。その後、renderVisualizationで表示を更新し、ChartRedrawでチャートを再描画します。最後に、次回のティック処理に備えてタイムスタンプを更新します。これにより、今回の目的である実装全体が完了します。 残る作業はシステムの動作検証であり、これは次のセクションで扱います。
バックテスト
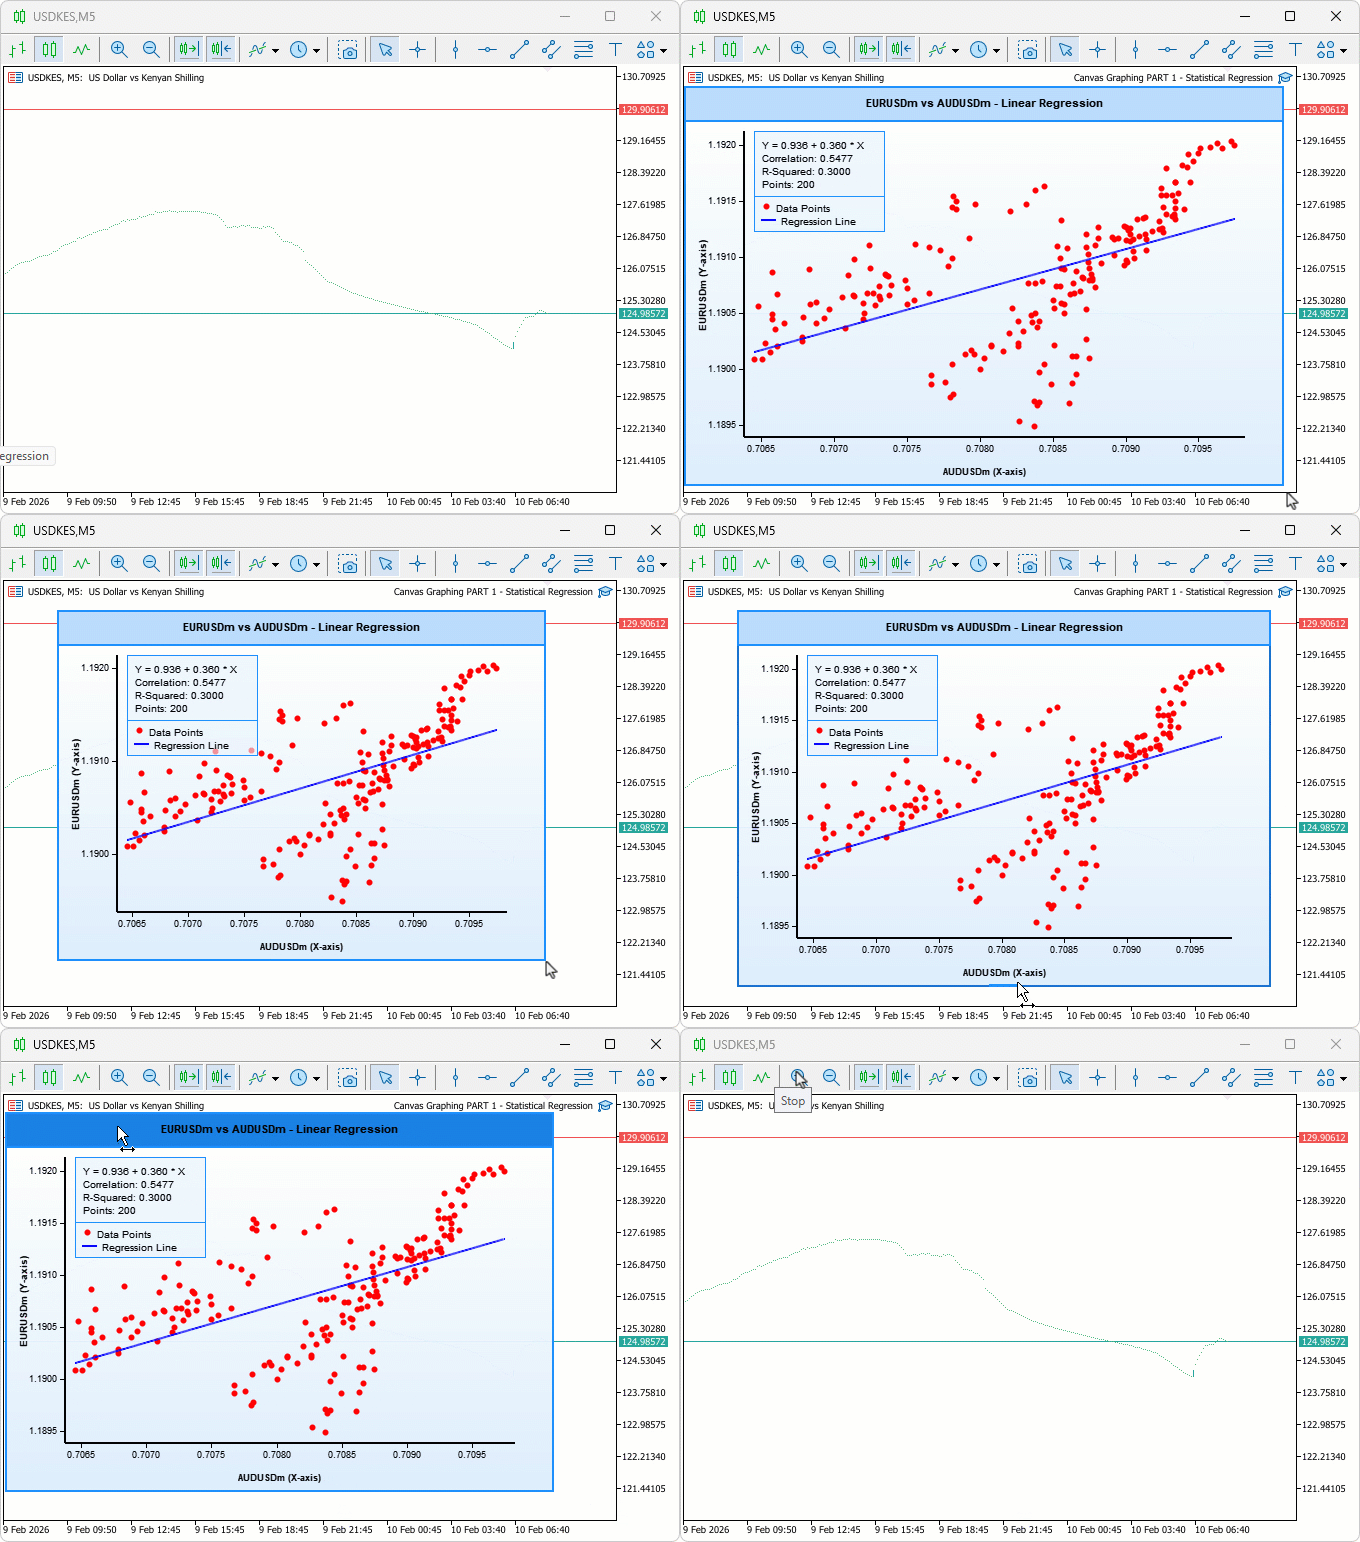
テストを実施しました。以下は、テスト結果をまとめたGraphics Interchange Format (GIF)画像です。
結論
本記事では、2つの銘柄間における統計的相関および線形回帰分析をおこなうための、MQL5によるCanvasベースのグラフ描画ツールを作成しました。本ツールには、ドラッグ操作やリサイズ機能を実装しています。回帰計算にはALGLIBを組み込み、動的な目盛りラベル、データポイント、傾き、切片、相関係数、決定係数を表示する統計パネルを追加しました。このインタラクティブな可視化により、ペアトレード分析に役立つ洞察を得ることができます。また、カスタマイズ可能なテーマ、枠線設定、新しいバーの生成時におけるリアルタイム更新にも対応しています。次回は、さらに現代的で直感的な表示を実現するため、サイバーパンクテーマモードとプロット上のライブアニメーション機能を追加します。どうぞお楽しみに。
MetaQuotes Ltdにより英語から翻訳されました。
元の記事: https://www.mql5.com/en/articles/21303
警告: これらの資料についてのすべての権利はMetaQuotes Ltd.が保有しています。これらの資料の全部または一部の複製や再プリントは禁じられています。
この記事はサイトのユーザーによって執筆されたものであり、著者の個人的な見解を反映しています。MetaQuotes Ltdは、提示された情報の正確性や、記載されているソリューション、戦略、または推奨事項の使用によって生じたいかなる結果についても責任を負いません。

 MQL5でカスタムインジケータを作成する(第8回):出来高統合によるより深いマーケットプロファイル分析
 MQL5でカスタムインジケータを作成する(第7回):セッション分析のためのハイブリッドTime Price Opportunity (TPO)マーケットプロファイル
 初心者からエキスパートへ:イントラデイ戦略の自動化
 MQL5入門(第41回)MQL5におけるファイル処理入門(III)

- 無料取引アプリ
- 8千を超えるシグナルをコピー
- 金融ニュースで金融マーケットを探索