
MQL5での取引戦略の自動化(第8回):バタフライハーモニックパターンを用いたエキスパートアドバイザーの構築
はじめに
前回の記事(第7回)では、リスクとリワードの最適化を目的に、動的なロット調整機能を備えたグリッドトレーディング用エキスパートアドバイザー(EA)を、MetaQuotes Language 5 (MQL5)で開発しました。今回は第8回として、注目するのはバタフライ・ハーモニックパターンです。これは精密なフィボナッチ比率を活用して、相場の反転ポイントを特定するリバーサル型のセットアップです。このアプローチは、明確なエントリーとエグジットのシグナルを特定できるだけでなく、パターンの自動可視化と取引の自動実行によって、取引戦略をさらに強化することができます。本記事では、以下の内容を取り上げます。
最後には、バタフライハーモニックパターンを検出して自動売買できる、完全に機能するEAが完成します。それでは、始めましょう。
戦略設計図
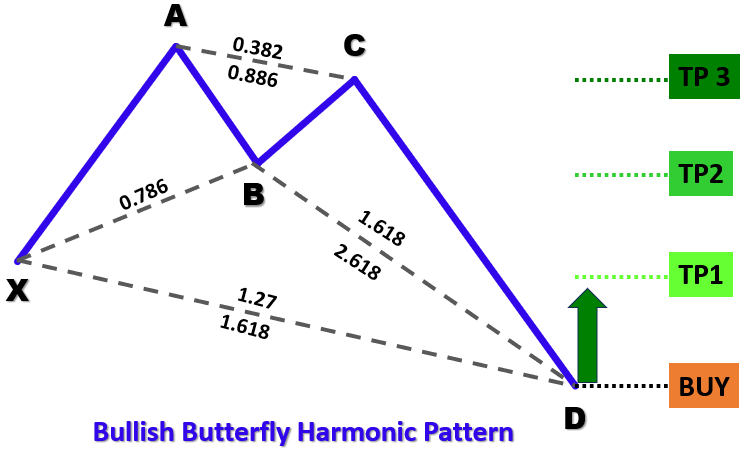
バタフライパターンは、X、A、B、C、Dの5つの主要なスイングまたはピボットポイントによって定義される、非常に精密な幾何学的フォーメーションです。このパターンには、弱気(ベアリッシュ)パターンと強気(ブルリッシュ)パターンという2つの主要なタイプがあります。弱気バタフライでは、高値→安値→高値→安値→高値というシーケンスが形成され、Xはスイングハイ、Aはスイングロー、Bはスイングハイ、Cはスイングロー、そしてDはスイングハイ(DはXよりも上に位置)となります。反対に、強気バタフライでは、安値→高値→安値→高値→安値という構造で形成され、Xはスイングローであり、DはXよりも下に位置します。以下に視覚化されたパターンタイプを示します。
弱気バタフライハーモニックパターン

強気バタフライハーモニックパターン
パターンを特定するために、以下のような構造化されたアプローチを取ります。
- XAレッグの定義:ピボットXからAへの初動が、パターンの基準距離を決定します
- ABレッグの確立:両方のパターンタイプにおいて、ピボットBは理想的にはXAの動きに対して約78.6%のリトレースメントで発生するべきであり、これは初期の動きの大部分が反転されたことを示します
- BCレッグの分析:この区間はXAの距離に対して38.2%〜88.6%の間でリトレースする必要があり、最終の動きの前に安定した調整局面があることを保証します
- CDレッグの設定:最終レッグは、XAの動きに対して127%〜161.8%まで延長されることでパターンが完成し、反転ポイントが示されます。
これらの幾何学的かつフィボナッチに基づいた条件を適用することで、EAは過去の価格データから有効なバタフライパターンを体系的に検出します。パターンが確認されると、プログラムはチャート上に注釈付きの三角形とトレンドラインでその形状を視覚化し、計算されたエントリー・ストップロス・テイクプロフィットの水準に基づいて自動的に取引を実行します。
MQL5での実装
MQL5でプログラムを作成するには、まずMetaEditorを開き、ナビゲータに移動して、インジケーターフォルダを見つけ、[新規]タブをクリックして、表示される手順に従ってファイルを作成します。ファイルが作成されたら、コーディング環境で、まずプログラム全体で使用するグローバル変数をいくつか宣言する必要があります。
//+------------------------------------------------------------------+
//|                        Copyright 2025, Forex Algo-Trader, Allan. |
//|                                 "https://t.me/Forex_Algo_Trader" |
//+------------------------------------------------------------------+
#property copyright "Forex Algo-Trader, Allan"
#property link      "https://t.me/Forex_Algo_Trader"
#property version   "1.00"
#property description "This EA trades based on Butterfly Strategy"
#property strict

//--- Include the trading library for order functions
#include <Trade\Trade.mqh>  //--- Include Trade library
CTrade obj_Trade;  //--- Instantiate a obj_Trade object

//--- Input parameters for user configuration
input int    PivotLeft    = 5;      //--- Number of bars to the left for pivot check
input int    PivotRight   = 5;      //--- Number of bars to the right for pivot check
input double Tolerance    = 0.10;   //--- Allowed deviation (10% of XA move)
input double LotSize      = 0.01;   //--- Lot size for new orders
input bool   AllowTrading = true;   //--- Enable or disable trading

//---------------------------------------------------------------------------
//--- Butterfly pattern definition:
//
//--- Bullish Butterfly:
//---   Pivots (X-A-B-C-D): X swing high, A swing low, B swing high, C swing low, D swing high.
//---   Normally XA > 0; Ideal B = A + 0.786*(X-A); Legs within specified ranges.
//
//--- Bearish Butterfly:
//---   Pivots (X-A-B-C-D): X swing low, A swing high, B swing low, C swing high, D swing low.
//---   Normally XA > 0; Ideal B = A - 0.786*(A-X); Legs within specified ranges.
//---------------------------------------------------------------------------

//--- Structure for a pivot point
struct Pivot {
   datetime time;   //--- Bar time of the pivot
   double   price;  //--- Pivot price (High for swing high, low for swing low)
   bool     isHigh; //--- True if swing high; false if swing low
};

//--- Global dynamic array for storing pivots in chronological order
Pivot pivots[];  //--- Declare a dynamic array to hold identified pivot points

//--- Global variables to lock in a pattern (avoid trading on repaint)
int      g_patternFormationBar = -1;  //--- Bar index where the pattern was formed (-1 means none)
datetime g_lockedPatternX      = 0;   //--- The key X pivot time for the locked pattern
ここでは、Trade\Trade.mqhライブラリをインクルードすることで、取引関連の関数にアクセスできるようにし、注文実行のためにobj_Tradeオブジェクトをインスタンス化します。次に、スイングポイントを識別するためのPivotLeftおよびPivotRight、ハーモニック比率の検証精度を調整するTolerance、取引数量を指定するLotSize、取引の有効・無効を制御するAllowTradingなどの入力パラメータを定義します。
市場構造を追跡するために、time、price、isHigh(スイングハイならtrue、スイングローならfalse)という3つの要素を持つPivot構造体を定義しています。これらのピボット情報は、過去データの参照用に「pivots[]」というグローバル動的配列に保存されます。さらに、同一パターンでの重複取引を防ぐために、検出済みのパターンをロックするg_patternFormationBarとg_lockedPatternXというグローバル変数も定義しています。次に、チャート上にパターンを視覚的に描画するための関数群を定義していきます。
//+------------------------------------------------------------------+
//| Helper: Draw a filled triangle                                   |
//+------------------------------------------------------------------+
void DrawTriangle(string name, datetime t1, double p1, datetime t2, double p2, datetime t3, double p3, color cl, int width, bool fill, bool back) {
   //--- Attempt to create a triangle object with three coordinate points
   if(ObjectCreate(0, name, OBJ_TRIANGLE, 0, t1, p1, t2, p2, t3, p3)) {
      //--- Set the triangle's color
      ObjectSetInteger(0, name, OBJPROP_COLOR, cl);
      //--- Set the triangle's line style to solid
      ObjectSetInteger(0, name, OBJPROP_STYLE, STYLE_SOLID);
      //--- Set the line width of the triangle
      ObjectSetInteger(0, name, OBJPROP_WIDTH, width);
      //--- Determine if the triangle should be filled
      ObjectSetInteger(0, name, OBJPROP_FILL, fill);
      //--- Set whether the object is drawn in the background
      ObjectSetInteger(0, name, OBJPROP_BACK, back);
   }
}

//+------------------------------------------------------------------+
//| Helper: Draw a trend line                                        |
//+------------------------------------------------------------------+
void DrawTrendLine(string name, datetime t1, double p1, datetime t2, double p2, color cl, int width, int style) {
   //--- Create a trend line object connecting two points
   if(ObjectCreate(0, name, OBJ_TREND, 0, t1, p1, t2, p2)) {
      //--- Set the trend line's color
      ObjectSetInteger(0, name, OBJPROP_COLOR, cl);
      //--- Set the trend line's style (solid, dotted, etc.)
      ObjectSetInteger(0, name, OBJPROP_STYLE, style);
      //--- Set the width of the trend line
      ObjectSetInteger(0, name, OBJPROP_WIDTH, width);
   }
}

//+------------------------------------------------------------------+
//| Helper: Draw a dotted trend line                                 |
//+------------------------------------------------------------------+
void DrawDottedLine(string name, datetime t1, double p, datetime t2, color lineColor) {
   //--- Create a horizontal trend line at a fixed price level with dotted style
   if(ObjectCreate(0, name, OBJ_TREND, 0, t1, p, t2, p)) {
      //--- Set the dotted line's color
      ObjectSetInteger(0, name, OBJPROP_COLOR, lineColor);
      //--- Set the line style to dotted
      ObjectSetInteger(0, name, OBJPROP_STYLE, STYLE_DOT);
      //--- Set the line width to 1
      ObjectSetInteger(0, name, OBJPROP_WIDTH, 1);
   }
}

//+------------------------------------------------------------------+
//| Helper: Draw anchored text label (for pivots)                    |
//| If isHigh is true, anchor at the bottom (label appears above);   |
//| if false, anchor at the top (label appears below).               |
//+------------------------------------------------------------------+
void DrawTextEx(string name, string text, datetime t, double p, color cl, int fontsize, bool isHigh) {
   //--- Create a text label object at the specified time and price
   if(ObjectCreate(0, name, OBJ_TEXT, 0, t, p)) {
      //--- Set the text of the label
      ObjectSetString(0, name, OBJPROP_TEXT, text);
      //--- Set the color of the text
      ObjectSetInteger(0, name, OBJPROP_COLOR, cl);
      //--- Set the font size for the text
      ObjectSetInteger(0, name, OBJPROP_FONTSIZE, fontsize);
      //--- Set the font type and style
      ObjectSetString(0, name, OBJPROP_FONT, "Arial Bold");
      //--- Anchor the text depending on whether it's a swing high or low
      if(isHigh)
         ObjectSetInteger(0, name, OBJPROP_ANCHOR, ANCHOR_BOTTOM);
      else
         ObjectSetInteger(0, name, OBJPROP_ANCHOR, ANCHOR_TOP);
      //--- Center-align the text
      ObjectSetInteger(0, name, OBJPROP_ALIGN, ALIGN_CENTER);
   }
}
プライスアクションの構造を視覚化するために、三角形、トレンドライン、点線、テキストラベルをチャート上に描画する補助関数のセットを定義します。これらの関数は、主要なピボットポイント、トレンドの方向性、および想定される転換レベルを視覚的にマークするのに役立ちます。DrawTriangle関数は、3つの価格ポイントを結ぶ三角形オブジェクト(OBJ_TRIANGLE)を作成します。この関数ではまずObjectCreateを使ってオブジェクトを定義し、その後ObjectSetIntegerを使用して色、線幅、塗りつぶしの設定をおこないます。この関数は、ハーモニックパターンやプライスアクションパターンの構造を明確に可視化するのに有用です。
DrawTrendLine関数は、2つの価格ポイント間にトレンドライン(OBJ_TREND)を描画します。ObjectCreateを使ってオブジェクトを生成し、色、線幅、スタイルなどをカスタマイズします。これにより、パターン構造の輪郭を明確にします。DrawDottedLine関数は、2つの時間ポイント間で指定された価格レベルに水平な点線を描画します。これはエントリーラインやエグジットラインなど、重要な価格帯をチャート上で明確に示すのに便利です。線のスタイルはSTYLE_DOTに設定され、他のラインと区別できるようにします。DrawTextEx関数は、特定のピボットポイントにテキストラベルを配置します。ラベルには一意の名前が割り当てられ、色、フォントサイズ、整列などが設定されます。また、スイングハイかスイングローかに応じて、ラベルは価格の上または下に表示されます。これにより、主要なピボットレベルの視覚的認識が向上します。
これらの変数と描画関数を備えた状態で、次に進むのはOnTickイベントハンドラです。ただし、すべてのティックごとに処理をおこなう必要はないため、1本のバーにつき1回だけパターン識別処理をおこなうロジックを定義していく必要があります。
//+------------------------------------------------------------------+
//| Expert tick function                                             |
//+------------------------------------------------------------------+
void OnTick() {
   //--- Declare a static variable to store the time of the last processed bar
   static datetime lastBarTime = 0;
   //--- Get the time of the current confirmed bar
   datetime currentBarTime = iTime(_Symbol, _Period, 1);
   //--- If the current bar time is the same as the last processed, exit
   if(currentBarTime == lastBarTime)
      return;
   //--- Update the last processed bar time
   lastBarTime = currentBarTime;

}
プログラムが重複した計算を避けるために、新しいバーが形成されたときだけロジックを実行する仕組みとして、static変数「lastBarTime」を使って、最後に処理したバーのタイムスタンプを保持します。各ティックごとに、iTime関数を用いて最新の確定バーの時間を取得します。取得した時間がlastBarTimeと一致する場合は、すでに処理済みなので、return文で早期に処理を終了し、再処理を防ぎます。時間が異なる場合は、lastBarTimeを更新して新しいバーの処理を開始する合図とし、データを格納するための配列の準備に進むことができます。
//--- Clear the pivot array for fresh analysis
ArrayResize(pivots, 0);
//--- Get the total number of bars available on the chart
int barsCount = Bars(_Symbol, _Period);
//--- Define the starting index for pivot detection (ensuring enough left bars)
int start = PivotLeft;
//--- Define the ending index for pivot detection (ensuring enough right bars)
int end = barsCount - PivotRight;

//--- Loop through bars from 'end-1' down to 'start' to find pivot points
for(int i = end - 1; i >= start; i--) {
   //--- Assume current bar is both a potential swing high and swing low
   bool isPivotHigh = true;
   bool isPivotLow = true;
   //--- Get the high and low of the current bar
   double currentHigh = iHigh(_Symbol, _Period, i);
   double currentLow = iLow(_Symbol, _Period, i);
   //--- Loop through the window of bars around the current bar
   for(int j = i - PivotLeft; j <= i + PivotRight; j++) {
      //--- Skip if the index is out of bounds
      if(j < 0 || j >= barsCount)
         continue;
      //--- Skip comparing the bar with itself
      if(j == i)
         continue;
      //--- If any bar in the window has a higher high, it's not a swing high
      if(iHigh(_Symbol, _Period, j) > currentHigh)
         isPivotHigh = false;
      //--- If any bar in the window has a lower low, it's not a swing low
      if(iLow(_Symbol, _Period, j) < currentLow)
         isPivotLow = false;
   }
   //--- If the current bar qualifies as either a swing high or swing low
   if(isPivotHigh || isPivotLow) {
      //--- Create a new pivot structure
      Pivot p;
      //--- Set the pivot's time
      p.time = iTime(_Symbol, _Period, i);
      //--- Set the pivot's price depending on whether it is a high or low
      p.price = isPivotHigh ? currentHigh : currentLow;
      //--- Set the pivot type (true for swing high, false for swing low)
      p.isHigh = isPivotHigh;
      //--- Get the current size of the pivots array
      int size = ArraySize(pivots);
      //--- Increase the size of the pivots array by one
      ArrayResize(pivots, size + 1);
      //--- Add the new pivot to the array
      pivots[size] = p;
   }
}
ここでは、過去の価格データを解析して、チャート上のスイングハイおよびスイングローのピボットポイントを特定します。まず、ArrayResize関数を使ってpivots配列をリセットし、新たな解析に備えます。次に、Bars関数でバーの総数を取得し、比較に十分な左側および右側のバーを確保するためのピボット検出範囲を定義します。
その後、forループを使って「end-1」から「start」までのバーを順に処理します。各バーがピボットの候補であると仮定し、iHigh関数とiLow関数でバーの高値と安値を取得します。次に、PivotLeftとPivotRightの範囲内にある周囲のバーと比較します。もし範囲内のどのバーかに現在のバーより高い高値があれば、そのバーはスイングハイではありません。同様に、より低い安値があればスイングローではありません。バーがピボットに該当すると判断された場合、Pivot構造体を作成し、iTime関数で時間を格納し、スイングハイかスイングローかに応じて価格を設定し、タイプ(スイングハイならtrue、スイングローならfalse)を決定します。最後に、ArrayResizeでpivots配列のサイズを調整してピボットを追加します。ArrayPrint関数でこのデータを出力すると、以下のような結果が得られます。
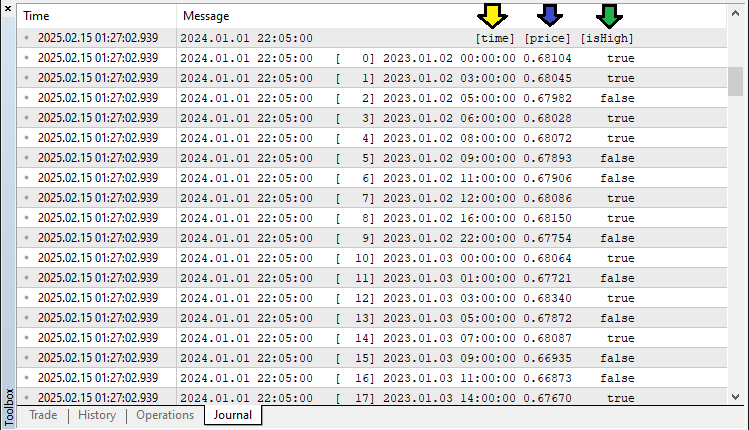
取得したデータをもとにピボットポイントを抽出し、十分な数のピボットが揃えば、パターンの解析と検出をおこなうことができます。これを実現するために、以下のロジックを実装しています。
//--- Determine the total number of pivots found
int pivotCount = ArraySize(pivots);
//--- If fewer than five pivots are found, the pattern cannot be formed
if(pivotCount < 5) {
   //--- Reset pattern lock variables
   g_patternFormationBar = -1;
   g_lockedPatternX = 0;
   //--- Exit the OnTick function
   return;
}

//--- Extract the last five pivots as X, A, B, C, and D
Pivot X = pivots[pivotCount - 5];
Pivot A = pivots[pivotCount - 4];
Pivot B = pivots[pivotCount - 3];
Pivot C = pivots[pivotCount - 2];
Pivot D = pivots[pivotCount - 1];

//--- Initialize a flag to indicate if a valid Butterfly pattern is found
bool patternFound = false;
//--- Check for the high-low-high-low-high (Bearish reversal) structure
if(X.isHigh && (!A.isHigh) && B.isHigh && (!C.isHigh) && D.isHigh) {
   //--- Calculate the difference between pivot X and A
   double diff = X.price - A.price;
   //--- Ensure the difference is positive
   if(diff > 0) {
      //--- Calculate the ideal position for pivot B based on Fibonacci ratio
      double idealB = A.price + 0.786 * diff;
      //--- Check if actual B is within tolerance of the ideal position
      if(MathAbs(B.price - idealB) <= Tolerance * diff) {
         //--- Calculate the BC leg length
         double BC = B.price - C.price;
         //--- Verify that BC is within the acceptable Fibonacci range
         if((BC >= 0.382 * diff) && (BC <= 0.886 * diff)) {
            //--- Calculate the CD leg length
            double CD = D.price - C.price;
            //--- Verify that CD is within the acceptable Fibonacci range and that D is above X
            if((CD >= 1.27 * diff) && (CD <= 1.618 * diff) && (D.price > X.price))
               patternFound = true;
         }
      }
   }
}
ここでは、直近に特定された5つのピボットポイントを解析して、バタフライハーモニックパターンが存在するかどうかを検証します。まず、ArraySize関数でピボットの総数を取得し、5つ未満であれば、パターンロック変数(g_patternFormationBarとg_lockedPatternX)をリセットし、誤ったシグナルを防ぐためにOnTick関数を終了します。次に、直近の5つのピボットを抽出し、パターンの幾何学的構造に従って「X」「A」「B」「C」「D」と割り当てます。そして、patternFoundフラグをfalseで初期化し、有効なバタフライパターンの条件を満たすかどうかを追跡します。
弱気反転パターンの場合、ピボットの高値・安値のシーケンスを確認します。具体的には、「X」(高値)、「A」(安値)、「B」(高値)、「C」(安値)、「D」(高値)となっているかを検証します。この構造が成り立つ場合、「XA」レッグの価格差を計算し、フィボナッチ比率を使って「B」「C」「D」の期待位置をチェックします。「B」は「XA」の約0.786のリトレースメント付近であること、「BC」は「XA」の0.382〜0.886の範囲内であること、「CD」は「XA」の1.27〜1.618の範囲で延長され、「D」が「X」より上に位置することです。これらすべての条件を満たした場合に、patternFoundをtrueに設定してパターンを確定します。同様に、強気パターンについても同じ検証をおこないます。
//--- Check for the low-high-low-high-low (Bullish reversal) structure
if((!X.isHigh) && A.isHigh && (!B.isHigh) && C.isHigh && (!D.isHigh)) {
   //--- Calculate the difference between pivot A and X
   double diff = A.price - X.price;
   //--- Ensure the difference is positive
   if(diff > 0) {
      //--- Calculate the ideal position for pivot B based on Fibonacci ratio
      double idealB = A.price - 0.786 * diff;
      //--- Check if actual B is within tolerance of the ideal position
      if(MathAbs(B.price - idealB) <= Tolerance * diff) {
         //--- Calculate the BC leg length
         double BC = C.price - B.price;
         //--- Verify that BC is within the acceptable Fibonacci range
         if((BC >= 0.382 * diff) && (BC <= 0.886 * diff)) {
            //--- Calculate the CD leg length
            double CD = C.price - D.price;
            //--- Verify that CD is within the acceptable Fibonacci range and that D is below X
            if((CD >= 1.27 * diff) && (CD <= 1.618 * diff) && (D.price < X.price))
               patternFound = true;
         }
      }
   }
}
パターンが検出された場合、チャート上にそのパターンを視覚化する処理を進めることができます。
//--- Initialize a string to store the type of pattern detected
string patternType = "";
//--- If a valid pattern is found, determine its type based on the relationship between D and X
if(patternFound) {
   if(D.price > X.price)
      patternType = "Bearish";  //--- Bearish Butterfly indicates a SELL signal
   else if(D.price < X.price)
      patternType = "Bullish";  //--- Bullish Butterfly indicates a BUY signal
}

//--- If a valid Butterfly pattern is detected
if(patternFound) {
   //--- Print a message indicating the pattern type and detection time
   Print(patternType, " Butterfly pattern detected at ", TimeToString(D.time, TIME_DATE|TIME_MINUTES|TIME_SECONDS));

   //--- Create a unique prefix for all graphical objects related to this pattern
   string signalPrefix = "BF_" + IntegerToString(X.time);

   //--- Choose triangle color based on the pattern type
   color triangleColor = (patternType=="Bullish") ? clrBlue : clrRed;

   //--- Draw the first triangle connecting pivots X, A, and B
   DrawTriangle(signalPrefix+"_Triangle1", X.time, X.price, A.time, A.price, B.time, B.price,
                triangleColor, 2, true, true);
   //--- Draw the second triangle connecting pivots B, C, and D
   DrawTriangle(signalPrefix+"_Triangle2", B.time, B.price, C.time, C.price, D.time, D.price,
                triangleColor, 2, true, true);

   //--- Draw boundary trend lines connecting the pivots for clarity
   DrawTrendLine(signalPrefix+"_TL_XA", X.time, X.price, A.time, A.price, clrBlack, 2, STYLE_SOLID);
   DrawTrendLine(signalPrefix+"_TL_AB", A.time, A.price, B.time, B.price, clrBlack, 2, STYLE_SOLID);
   DrawTrendLine(signalPrefix+"_TL_BC", B.time, B.price, C.time, C.price, clrBlack, 2, STYLE_SOLID);
   DrawTrendLine(signalPrefix+"_TL_CD", C.time, C.price, D.time, D.price, clrBlack, 2, STYLE_SOLID);
   DrawTrendLine(signalPrefix+"_TL_XB", X.time, X.price, B.time, B.price, clrBlack, 2, STYLE_SOLID);
   DrawTrendLine(signalPrefix+"_TL_BD", B.time, B.price, D.time, D.price, clrBlack, 2, STYLE_SOLID);
}
ここでは、バタフライパターンの検出を完了し、強気または弱気のいずれかに分類してチャート上に視覚的にマーキングします。まず、「patternType」という文字列変数を初期化し、検出されたパターンが強気か弱気かを格納します。patternFoundがtrueの場合、ピボット「D」とピボット「X」のpriceプロパティを比較します。「D」が「X」より高ければ、弱気パターンと分類し、売りの可能性を示します。逆に「D」が「X」より低ければ、強気パターンと分類し、買いの可能性を示します。
パターンが検出されると、Print関数でパターンタイプと検出時刻のメッセージをログに出力します。さらに、IntegerToString関数と「X.time」を用いて一意のsignalPrefixを生成し、各パターンに固有のグラフィカルオブジェクト名を割り当てます。続いて、DrawTriangle関数を使い、バタフライパターンを形成する2つの三角形部分を強調表示します。三角形の色は、強気の場合はclrBlue、弱気の場合はclrRedです。最初の三角形はピボット「X」「A」「B」を結び、2つ目の三角形はピボット「B」「C」「D」を結びます。
視覚化をさらに強化するため、DrawTrendLine関数を使って、重要なピボットポイント間の黒色の実線トレンドラインを引きます。対象は「XA」「AB」「BC」「CD」「XB」「BD」の各区間です。これらの線がハーモニックパターンの構造と対称性を明確に示します。コンパイルして実行すると、次の結果が得られます。
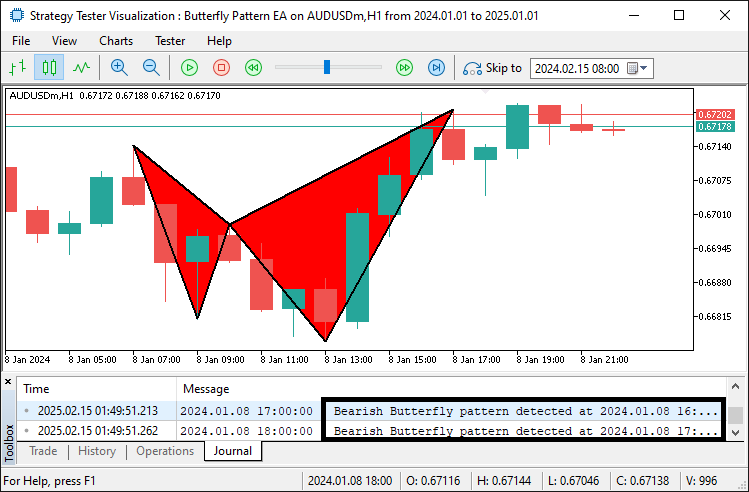
画像からわかるように、パターンの検出と視覚的な描画の両方が正しくおこなわれていることが確認できます。次のステップとして、ラベリングを追加して視認性をさらに高める処理を進めることができます。
//--- Retrieve the symbol's point size to calculate offsets for text positioning
double point = SymbolInfoDouble(_Symbol, SYMBOL_POINT);
//--- Calculate an offset (15 points) for positioning text above or below pivots
double offset = 15 * point;

//--- Determine the Y coordinate for each pivot label based on its type
double textY_X = (X.isHigh ? X.price + offset : X.price - offset);
double textY_A = (A.isHigh ? A.price + offset : A.price - offset);
double textY_B = (B.isHigh ? B.price + offset : B.price - offset);
double textY_C = (C.isHigh ? C.price + offset : C.price - offset);
double textY_D = (D.isHigh ? D.price + offset : D.price - offset);

//--- Draw text labels for each pivot with appropriate anchoring
DrawTextEx(signalPrefix+"_Text_X", "X", X.time, textY_X, clrBlack, 11, X.isHigh);
DrawTextEx(signalPrefix+"_Text_A", "A", A.time, textY_A, clrBlack, 11, A.isHigh);
DrawTextEx(signalPrefix+"_Text_B", "B", B.time, textY_B, clrBlack, 11, B.isHigh);
DrawTextEx(signalPrefix+"_Text_C", "C", C.time, textY_C, clrBlack, 11, C.isHigh);
DrawTextEx(signalPrefix+"_Text_D", "D", D.time, textY_D, clrBlack, 11, D.isHigh);

//--- Calculate the central label's time as the midpoint between pivots X and B
datetime centralTime = (X.time + B.time) / 2;
//--- Set the central label's price at pivot D's price
double centralPrice = D.price;
//--- Create the central text label indicating the pattern type
if(ObjectCreate(0, signalPrefix+"_Text_Center", OBJ_TEXT, 0, centralTime, centralPrice)) {
   ObjectSetString(0, signalPrefix+"_Text_Center", OBJPROP_TEXT,
      (patternType=="Bullish") ? "Bullish Butterfly" : "Bearish Butterfly");
   ObjectSetInteger(0, signalPrefix+"_Text_Center", OBJPROP_COLOR, clrBlack);
   ObjectSetInteger(0, signalPrefix+"_Text_Center", OBJPROP_FONTSIZE, 11);
   ObjectSetString(0, signalPrefix+"_Text_Center", OBJPROP_FONT, "Arial Bold");
   ObjectSetInteger(0, signalPrefix+"_Text_Center", OBJPROP_ALIGN, ALIGN_CENTER);
}
ここでは、チャート上にバタフライパターンを示すテキストラベルを追加します。まず、SymbolInfoDouble関数を使用してシンボルのSYMBOL_POINT値を取得し、ラベルの表示位置を調整するためのoffsetを計算します。各ピボット(「X」「A」「B」「C」「D」)に対しては、スイングハイであればラベルを価格の上に、スイングローであれば価格の下に配置します。これらのラベルはDrawTextEx関数を使用して配置され、黒色のフォントカラー、サイズ11で描画されます。また、「Bullish Butterfly」または「Bearish Butterfly」といったパターン名の中央ラベルは、「X」と「B」の中間点に表示されます。このラベルはObjectCreate、ObjectSetString、ObjectSetIntegerを使って、テキスト、色、フォントサイズ、整列を設定することで、視認性を高めています。プログラムを実行した後の結果は次のようになります。
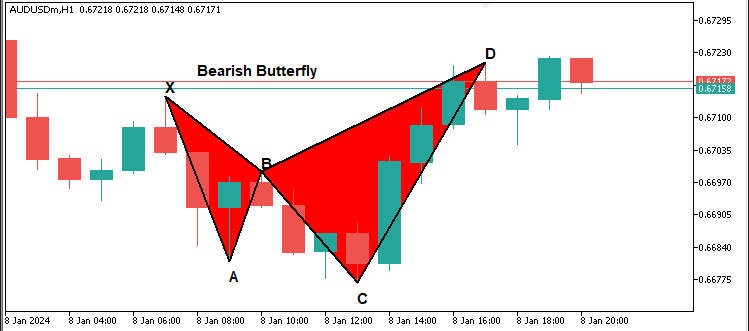
ラベルができたので、エントリレベルとエグジットレベルの追加に進むことができます。
//--- Define start and end times for drawing horizontal dotted lines for obj_Trade levels
datetime lineStart = D.time;
datetime lineEnd = D.time + PeriodSeconds(_Period)*2;

//--- Declare variables for entry price and take profit levels
double entryPriceLevel, TP1Level, TP2Level, TP3Level, tradeDiff;
//--- Calculate obj_Trade levels based on whether the pattern is Bullish or Bearish
if(patternType=="Bullish") { //--- Bullish → BUY signal
   //--- Use the current ASK price as the entry
   entryPriceLevel = SymbolInfoDouble(_Symbol, SYMBOL_ASK);
   //--- Set TP3 at pivot C's price
   TP3Level = C.price;
   //--- Calculate the total distance to be covered by the obj_Trade
   tradeDiff = TP3Level - entryPriceLevel;
   //--- Set TP1 at one-third of the total move
   TP1Level = entryPriceLevel + tradeDiff/3;
   //--- Set TP2 at two-thirds of the total move
   TP2Level = entryPriceLevel + 2*tradeDiff/3;
} else { //--- Bearish → SELL signal
   //--- Use the current BID price as the entry
   entryPriceLevel = SymbolInfoDouble(_Symbol, SYMBOL_BID);
   //--- Set TP3 at pivot C's price
   TP3Level = C.price;
   //--- Calculate the total distance to be covered by the obj_Trade
   tradeDiff = entryPriceLevel - TP3Level;
   //--- Set TP1 at one-third of the total move
   TP1Level = entryPriceLevel - tradeDiff/3;
   //--- Set TP2 at two-thirds of the total move
   TP2Level = entryPriceLevel - 2*tradeDiff/3;
}

//--- Draw dotted horizontal lines to represent the entry and TP levels
DrawDottedLine(signalPrefix+"_EntryLine", lineStart, entryPriceLevel, lineEnd, clrMagenta);
DrawDottedLine(signalPrefix+"_TP1Line", lineStart, TP1Level, lineEnd, clrForestGreen);
DrawDottedLine(signalPrefix+"_TP2Line", lineStart, TP2Level, lineEnd, clrGreen);
DrawDottedLine(signalPrefix+"_TP3Line", lineStart, TP3Level, lineEnd, clrDarkGreen);

//--- Define a label time coordinate positioned just to the right of the dotted lines
datetime labelTime = lineEnd + PeriodSeconds(_Period)/2;

//--- Construct the entry label text with the price
string entryLabel = (patternType=="Bullish") ? "BUY (" : "SELL (";
entryLabel += DoubleToString(entryPriceLevel, _Digits) + ")";
//--- Draw the entry label on the chart
DrawTextEx(signalPrefix+"_EntryLabel", entryLabel, labelTime, entryPriceLevel, clrMagenta, 11, true);

//--- Construct and draw the TP1 label
string tp1Label = "TP1 (" + DoubleToString(TP1Level, _Digits) + ")";
DrawTextEx(signalPrefix+"_TP1Label", tp1Label, labelTime, TP1Level, clrForestGreen, 11, true);

//--- Construct and draw the TP2 label
string tp2Label = "TP2 (" + DoubleToString(TP2Level, _Digits) + ")";
DrawTextEx(signalPrefix+"_TP2Label", tp2Label, labelTime, TP2Level, clrGreen, 11, true);

//--- Construct and draw the TP3 label
string tp3Label = "TP3 (" + DoubleToString(TP3Level, _Digits) + ")";
DrawTextEx(signalPrefix+"_TP3Label", tp3Label, labelTime, TP3Level, clrDarkGreen, 11, true);
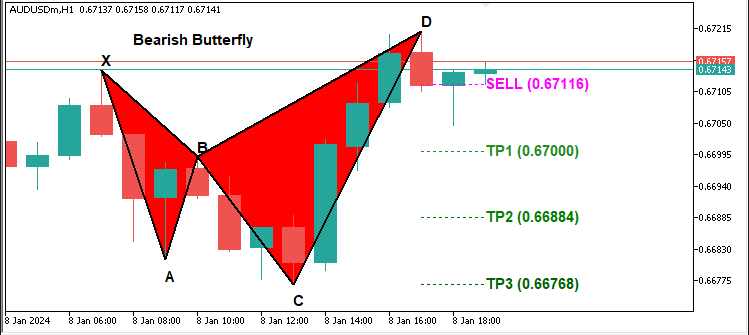
ここでは、検出されたパターンに基づいて取引のエントリーポイントおよテイクプロフィットテイクプロフィット(TP)レベルを計算します。まず、PeriodSeconds関数を使用して、エントリーやTPラインを描画する際の横方向の時間幅を決定します。次に、SymbolInfoDouble関数を用いてエントリー価格を取得します。買いポジションの場合はSYMBOL_ASK、売りポジションの場合はSYMBOL_BIDを使用します。TP3は「C.price」をそのまま使用し、そこから取引範囲全体を計算します。この範囲を3等分して、TP1およびTP2の価格レベルを求めます。DrawDottedLine関数を使って、エントリーレベルとTPレベルを異なる色でチャートに描画します。次に、PeriodSeconds関数を再度使って、ラベルを表示するための適切な時間座標を計算し、ラベルが見やすく配置されるようにします。DoubleToString関数で価格をフォーマットし、エントリー価格のテキストラベルを構築します。最後に、DrawTextEx関数を使用して、エントリーとTPラベルをチャート上に表示します。コンパイルすると、次の結果が得られます。
弱気パターン
強気パターン
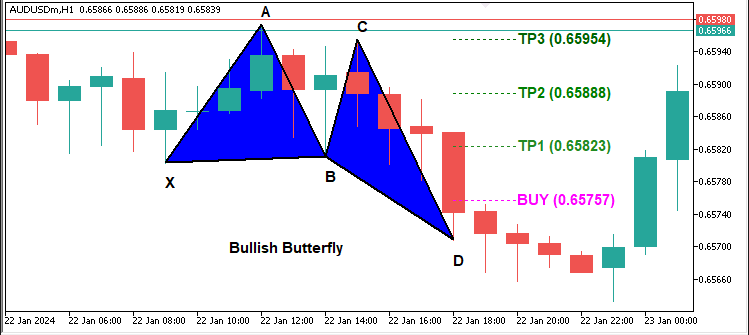
画像からわかるように、両方のパターンを正しく検出・描画できていることが確認できます。ここから必要なのは、次のローソク足が確定するまで待機して、その後もパターンが維持されているか(=再描画されていないか)どうかを確認することです。もしパターンが依然として有効であれば、それは信頼できるシグナルであり、設定されたエントリーレベルから実際にポジションをオープンする準備が整ったことを意味します。これを実現するために、以下のロジックを実装しています。
//--- Retrieve the index of the current bar
int currentBarIndex = Bars(_Symbol, _Period) - 1;
//--- If no pattern has been previously locked, lock the current pattern formation
if(g_patternFormationBar == -1) {
   g_patternFormationBar = currentBarIndex;
   g_lockedPatternX = X.time;
   //--- Print a message that the pattern is detected and waiting for confirmation
   Print("Pattern detected on bar ", currentBarIndex, ". Waiting for confirmation on next bar.");
   return;
}
//--- If still on the same formation bar, the pattern is considered to be repainting
if(currentBarIndex == g_patternFormationBar) {
   Print("Pattern is repainting; still on locked formation bar ", currentBarIndex, ". No obj_Trade yet.");
   return;
}
//--- If we are on a new bar compared to the locked formation
if(currentBarIndex > g_patternFormationBar) {
   //--- Check if the locked pattern still corresponds to the same X pivot
   if(g_lockedPatternX == X.time) {
      Print("Confirmed pattern (locked on bar ", g_patternFormationBar, "). Opening obj_Trade on bar ", currentBarIndex, ".");
      //--- Update the pattern formation bar to the current bar
      g_patternFormationBar = currentBarIndex;
      //--- Only proceed with trading if allowed and if there is no existing position
      if(AllowTrading && !PositionSelect(_Symbol)) {
         double entryPriceTrade = 0, stopLoss = 0, takeProfit = 0;
         point = SymbolInfoDouble(_Symbol, SYMBOL_POINT);
         bool tradeResult = false;
         //--- For a Bullish pattern, execute a BUY obj_Trade
         if(patternType=="Bullish") {  //--- BUY signal
            entryPriceTrade = SymbolInfoDouble(_Symbol, SYMBOL_ASK);
            double diffTrade = TP2Level - entryPriceTrade;
            stopLoss = entryPriceTrade - diffTrade * 3;
            takeProfit = TP2Level;
            tradeResult = obj_Trade.Buy(LotSize, _Symbol, entryPriceTrade, stopLoss, takeProfit, "Butterfly Signal");
            if(tradeResult)
               Print("Buy order opened successfully.");
            else
               Print("Buy order failed: ", obj_Trade.ResultRetcodeDescription());
         }
         //--- For a Bearish pattern, execute a SELL obj_Trade
         else if(patternType=="Bearish") {  //--- SELL signal
            entryPriceTrade = SymbolInfoDouble(_Symbol, SYMBOL_BID);
            double diffTrade = entryPriceTrade - TP2Level;
            stopLoss = entryPriceTrade + diffTrade * 3;
            takeProfit = TP2Level;
            tradeResult = obj_Trade.Sell(LotSize, _Symbol, entryPriceTrade, stopLoss, takeProfit, "Butterfly Signal");
            if(tradeResult)
               Print("Sell order opened successfully.");
            else
               Print("Sell order failed: ", obj_Trade.ResultRetcodeDescription());
         }
      }
      else {
         //--- If a position is already open, do not execute a new obj_Trade
         Print("A position is already open for ", _Symbol, ". No new obj_Trade executed.");
      }
   }
   else {
      //--- If the pattern has changed, update the lock with the new formation bar and X pivot
      g_patternFormationBar = currentBarIndex;
      g_lockedPatternX = X.time;
      Print("Pattern has changed; updating lock on bar ", currentBarIndex, ". Waiting for confirmation.");
      return;
   }
}
}
else {
//--- If no valid Butterfly pattern is detected, reset the pattern lock variables
g_patternFormationBar = -1;
g_lockedPatternX = 0;
}
このセクションでは、パターンのロック処理と取引実行を管理します。まず、Bars関数を使用して現在のバーインデックスを取得し、currentBarIndexに代入します。まだパターンがロックされていない(g_patternFormationBar == -1)場合は、currentBarIndexをg_patternFormationBarに代入し、Xピボットの時間をg_lockedPatternXに保存します。パターンが検出され、確認待ちであることを示すメッセージをPrint関数で表示します。パターンがまだ同じバー上で形成中である場合は、Print関数を使って「パターンが再描画中である」というメッセージを表示し、取引は実行されません。
現在のバーがロックされたバーの次に進んだ場合は、g_lockedPatternXと現在のXピボットの時間を比較し、パターンが有効かどうかを再確認します。時間が一致していれば、パターンを正式に確定し、取引実行の準備に入ります。ポジションを取る前には、PositionSelect関数を使用して既存ポジションがないことを確認し、さらにAllowTradingが有効であることもチェックします。「強気」パターンが確定した場合は、SYMBOL_ASKを使って現在の買値をSymbolInfoDouble関数で取得し、TP2Levelをもとにストップロスとテイクプロフィットを計算して、obj_Trade.Buy関数を使って買い注文を実行します。取引が成功した場合は、Print関数で成功メッセージを表示し、失敗した場合はobj_Trade.ResultRetcodeDescription関数で失敗理由を出力します。
「弱気」パターンの場合も同様に、SYMBOL_BIDを使って売値を取得し、取引レベルを計算してobj_Trade.Sell関数を用いて売り注文を出します。成功・失敗に応じてPrintで対応するメッセージを出力します。すでにポジションが存在している場合は、新たなトレードは実行されず、Printでその旨を通知します。また、ロックされていたXピボットが変更された場合には、g_patternFormationBarおよびg_lockedPatternXを更新し、パターンが変化したため再び確認待ちであることを示します。有効なパターンが検出されなかった場合は、g_patternFormationBarとg_lockedPatternXをリセットし、以前のロック状態を解除します。
コンパイルすると、次の結果が得られます。
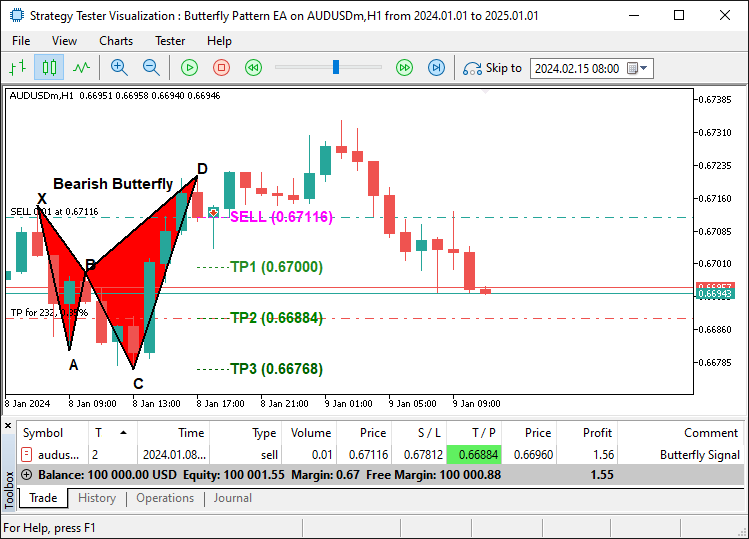
画像からもわかるように、バタフライパターンをチャート上に正しく描画し、その後、安定している(再描画されていない)ことが確認できた段階で取引を実行することができています。これにより、パターンの検出・描画・取引の自動化という本来の目的を達成することができました。残された作業はプログラムのバックテストであり、それについては次のセクションで取り扱います。
バックテストと最適化
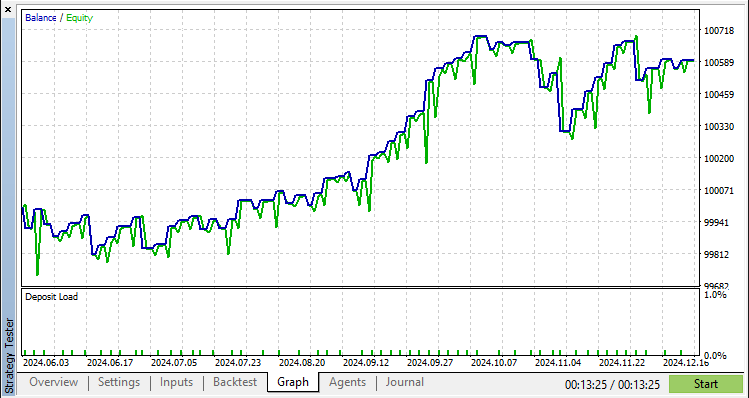
徹底的なバックテストの結果、次の結果が得られました。
バックテストグラフ
バックテストレポート
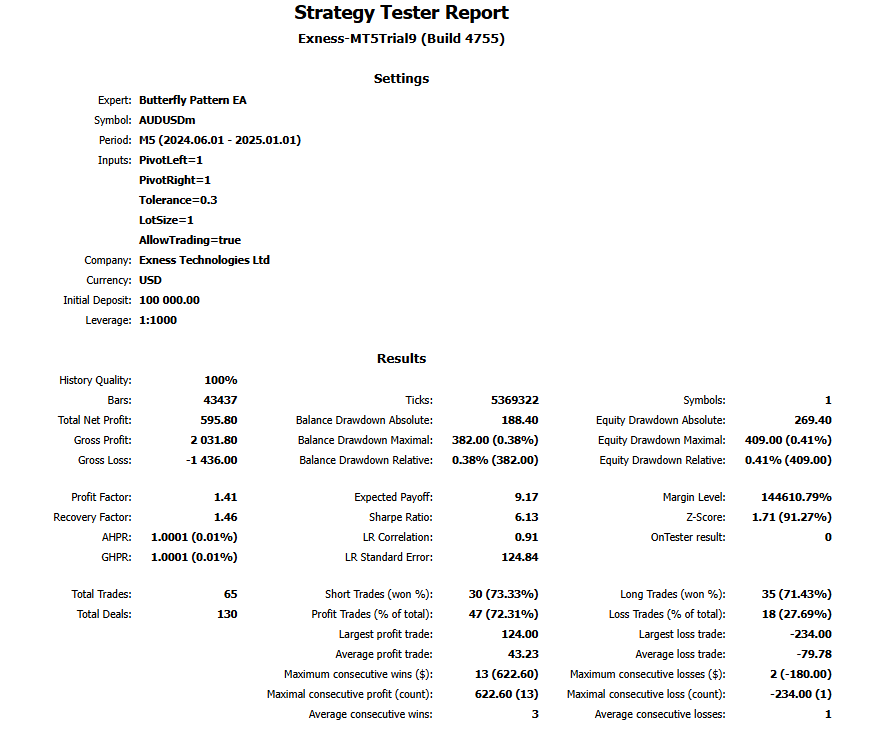
5分足チャートで半年間のテストをおこなった結果、65回の取引が発生し、バタフライパターンは比較的まれに出現することが確認されました。
結論
今回、私たちはバタフライハーモニックパターンを検出し、精度高く自動で取引をおこなうMQL5 EAを構築することに成功しました。パターン認識、ピボット検証、自動売買執行を組み合わせることで、市場の状況に動的に適応する取引システムを実現しました。
免責条項:本記事は教育目的のみを意図したものです。取引には大きな財務リスクが伴い、市場の状況は予測できない場合があります。概説した戦略はハーモニック取引への構造化されたアプローチを提供しますが、収益性を保証するものではありません。本プログラムを実運用する前には、十分なバックテストと適切なリスク管理が必須です。
これらのテクニックを実装することで、ハーモニックパターン取引スキルを洗練し、テクニカル分析を強化し、アルゴリズム取引戦略を進化させることができます。皆さんの取引の成功をお祈りしております。
MetaQuotes Ltdにより英語から翻訳されました。
元の記事: https://www.mql5.com/en/articles/17223
警告: これらの資料についてのすべての権利はMetaQuotes Ltd.が保有しています。これらの資料の全部または一部の複製や再プリントは禁じられています。
この記事はサイトのユーザーによって執筆されたものであり、著者の個人的な見解を反映しています。MetaQuotes Ltdは、提示された情報の正確性や、記載されているソリューション、戦略、または推奨事項の使用によって生じたいかなる結果についても責任を負いません。
 MQL5での取引戦略の自動化(第9回):アジアブレイクアウト戦略のためのエキスパートアドバイザーの構築
 MQL5で自己最適化エキスパートアドバイザーを構築する(第6回):ストップアウト防止
 知っておくべきMQL5ウィザードのテクニック(第55回):PER付きSAC
 プライスアクション分析ツールキットの開発(第14回):Parabolic Stop and Reverseツール
- 無料取引アプリ
- 8千を超えるシグナルをコピー
- 金融ニュースで金融マーケットを探索
新しい記事をご覧ください:MQL5で取引戦略を自動化する(パート8):バタフライハーモニックパターンでエキスパートアドバイザーを構築する。
著者アラン・ムネネ・ムティリア
新しい記事をご覧ください:MQL5で取引戦略を自動化する(パート8):バタフライハーモニックパターンでエキスパートアドバイザーを構築する。
著者アラン・ムネネ・ムティリア