
Automating Trading Strategies in MQL5 (Part 8): Building an Expert Advisor with Butterfly Harmonic Patterns
Introduction
In the previous article (Part 7), we developed a Grid Trading Expert Advisor in MetaQuotes Language 5 (MQL5) with dynamic lot scaling to optimize risk and reward. Now, in Part 8, we shift our focus to the Butterfly harmonic pattern—a reversal setup that leverages precise Fibonacci ratios to pinpoint potential market turning points. This approach not only helps identify clear entry and exit signals but also enhances your trading strategy through automated visualization and execution. In this article, we will cover:
By the end, you'll have a fully functional Expert Advisor capable of detecting and trading Butterfly harmonic patterns. Let’s begin!
Strategy Blueprint
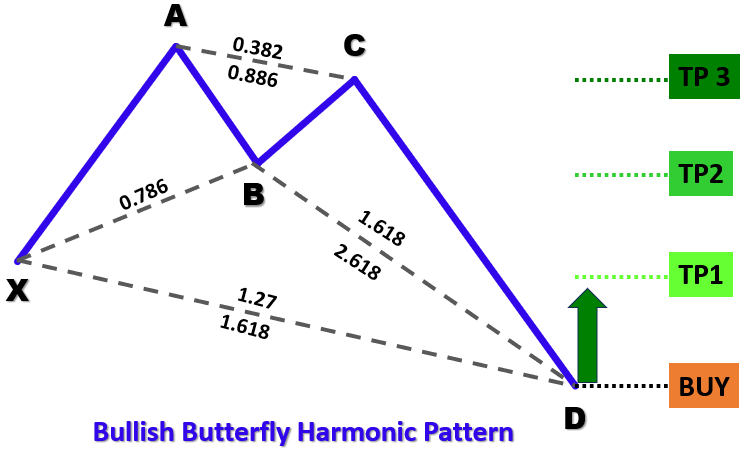
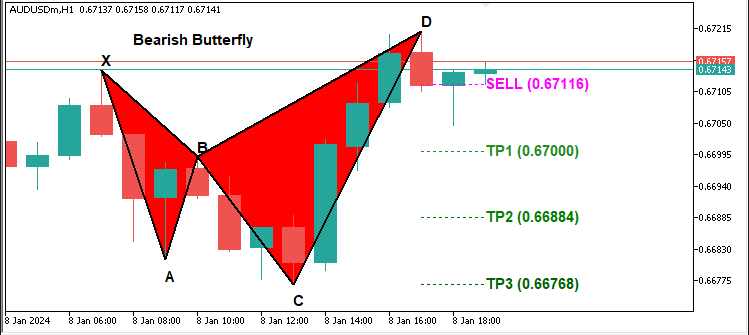
The Butterfly pattern is a precise geometric formation defined by five key swing or pivot points—X, A, B, C, and D—and comes in two primary types: a bearish pattern and a bullish pattern. In a bearish Butterfly, the structure forms a high-low-high-low-high sequence where pivot X is a swing high, pivot A a swing low, pivot B a swing high, pivot C a swing low, and pivot D a swing high (with D positioned above X). Conversely, a bullish Butterfly is formed in a low-high-low-high-low sequence, with pivot X as a swing low and pivot D falling below X. Below are the visualized pattern types.
Bearish Butterfly Harmonic Pattern:

Bullish Butterfly Harmonic Pattern:
To identify the patterns, below will be our structured approach:
- Defining the "XA" Leg: The initial move from pivot X to A will establish our reference distance for the pattern.
- Establishing the "AB" Leg: For both pattern types, pivot B should ideally occur at approximately a 78.6% retracement of the XA move, confirming that the price has reversed a significant portion of the initial movement.
- Analyzing the "BC" Leg: This leg should retrace between 38.2% and 88.6% of the XA distance, ensuring a stable consolidation before the final move.
- Setting the "CD" Leg: The final leg should extend between 127% and 161.8% of the XA move, completing the pattern and indicating a reversal point.
By applying these geometric and Fibonacci-based criteria, our Expert Advisor will systematically detect valid Butterfly patterns in historical price data. Once a pattern is confirmed, the program will visualize the formation on the chart with annotated triangles and trend lines, then execute trades based on the calculated entry, stop loss, and take profit levels.
Implementation in MQL5
To create the program in MQL5, open the MetaEditor, go to the Navigator, locate the Indicators folder, click on the "New" tab, and follow the prompts to create the file. Once it is made, in the coding environment, we will need to declare some global variables that we will use throughout the program.
//+------------------------------------------------------------------+
//|                        Copyright 2025, Forex Algo-Trader, Allan. |
//|                                 "https://t.me/Forex_Algo_Trader" |
//+------------------------------------------------------------------+
#property copyright "Forex Algo-Trader, Allan"
#property link      "https://t.me/Forex_Algo_Trader"
#property version   "1.00"
#property description "This EA trades based on Butterfly Strategy"
#property strict

//--- Include the trading library for order functions
#include <Trade\Trade.mqh>  //--- Include Trade library
CTrade obj_Trade;  //--- Instantiate a obj_Trade object

//--- Input parameters for user configuration
input int    PivotLeft    = 5;      //--- Number of bars to the left for pivot check
input int    PivotRight   = 5;      //--- Number of bars to the right for pivot check
input double Tolerance    = 0.10;   //--- Allowed deviation (10% of XA move)
input double LotSize      = 0.01;   //--- Lot size for new orders
input bool   AllowTrading = true;   //--- Enable or disable trading

//---------------------------------------------------------------------------
//--- Butterfly pattern definition:
//
//--- Bullish Butterfly:
//---   Pivots (X-A-B-C-D): X swing high, A swing low, B swing high, C swing low, D swing high.
//---   Normally XA > 0; Ideal B = A + 0.786*(X-A); Legs within specified ranges.
//
//--- Bearish Butterfly:
//---   Pivots (X-A-B-C-D): X swing low, A swing high, B swing low, C swing high, D swing low.
//---   Normally XA > 0; Ideal B = A - 0.786*(A-X); Legs within specified ranges.
//---------------------------------------------------------------------------

//--- Structure for a pivot point
struct Pivot {
   datetime time;   //--- Bar time of the pivot
   double   price;  //--- Pivot price (High for swing high, low for swing low)
   bool     isHigh; //--- True if swing high; false if swing low
};

//--- Global dynamic array for storing pivots in chronological order
Pivot pivots[];  //--- Declare a dynamic array to hold identified pivot points

//--- Global variables to lock in a pattern (avoid trading on repaint)
int      g_patternFormationBar = -1;  //--- Bar index where the pattern was formed (-1 means none)
datetime g_lockedPatternX      = 0;   //--- The key X pivot time for the locked pattern
Here, we include the "Trade\Trade.mqh" library to access trading functions and instantiate the "obj_Trade" object for order execution. We define input parameters such as "PivotLeft" and "PivotRight" for identifying swing points, "Tolerance" for harmonic ratio validation, "LotSize" for trade volume, and "AllowTrading" to enable or disable trades.
To track market structure, we use a "Pivot" structure defined by struct storing "time", "price", and "isHigh" (true for swing highs, false for lows). These pivots are saved in a global dynamic array, "pivots[]", for historical reference. Finally, we define global variables "g_patternFormationBar" and "g_lockedPatternX" to prevent duplicate trades by locking in a detected pattern. Next, we can define functions that will help us to visualize the patterns in the chart.
//+------------------------------------------------------------------+
//| Helper: Draw a filled triangle                                   |
//+------------------------------------------------------------------+
void DrawTriangle(string name, datetime t1, double p1, datetime t2, double p2, datetime t3, double p3, color cl, int width, bool fill, bool back) {
   //--- Attempt to create a triangle object with three coordinate points
   if(ObjectCreate(0, name, OBJ_TRIANGLE, 0, t1, p1, t2, p2, t3, p3)) {
      //--- Set the triangle's color
      ObjectSetInteger(0, name, OBJPROP_COLOR, cl);
      //--- Set the triangle's line style to solid
      ObjectSetInteger(0, name, OBJPROP_STYLE, STYLE_SOLID);
      //--- Set the line width of the triangle
      ObjectSetInteger(0, name, OBJPROP_WIDTH, width);
      //--- Determine if the triangle should be filled
      ObjectSetInteger(0, name, OBJPROP_FILL, fill);
      //--- Set whether the object is drawn in the background
      ObjectSetInteger(0, name, OBJPROP_BACK, back);
   }
}

//+------------------------------------------------------------------+
//| Helper: Draw a trend line                                        |
//+------------------------------------------------------------------+
void DrawTrendLine(string name, datetime t1, double p1, datetime t2, double p2, color cl, int width, int style) {
   //--- Create a trend line object connecting two points
   if(ObjectCreate(0, name, OBJ_TREND, 0, t1, p1, t2, p2)) {
      //--- Set the trend line's color
      ObjectSetInteger(0, name, OBJPROP_COLOR, cl);
      //--- Set the trend line's style (solid, dotted, etc.)
      ObjectSetInteger(0, name, OBJPROP_STYLE, style);
      //--- Set the width of the trend line
      ObjectSetInteger(0, name, OBJPROP_WIDTH, width);
   }
}

//+------------------------------------------------------------------+
//| Helper: Draw a dotted trend line                                 |
//+------------------------------------------------------------------+
void DrawDottedLine(string name, datetime t1, double p, datetime t2, color lineColor) {
   //--- Create a horizontal trend line at a fixed price level with dotted style
   if(ObjectCreate(0, name, OBJ_TREND, 0, t1, p, t2, p)) {
      //--- Set the dotted line's color
      ObjectSetInteger(0, name, OBJPROP_COLOR, lineColor);
      //--- Set the line style to dotted
      ObjectSetInteger(0, name, OBJPROP_STYLE, STYLE_DOT);
      //--- Set the line width to 1
      ObjectSetInteger(0, name, OBJPROP_WIDTH, 1);
   }
}

//+------------------------------------------------------------------+
//| Helper: Draw anchored text label (for pivots)                    |
//| If isHigh is true, anchor at the bottom (label appears above);   |
//| if false, anchor at the top (label appears below).               |
//+------------------------------------------------------------------+
void DrawTextEx(string name, string text, datetime t, double p, color cl, int fontsize, bool isHigh) {
   //--- Create a text label object at the specified time and price
   if(ObjectCreate(0, name, OBJ_TEXT, 0, t, p)) {
      //--- Set the text of the label
      ObjectSetString(0, name, OBJPROP_TEXT, text);
      //--- Set the color of the text
      ObjectSetInteger(0, name, OBJPROP_COLOR, cl);
      //--- Set the font size for the text
      ObjectSetInteger(0, name, OBJPROP_FONTSIZE, fontsize);
      //--- Set the font type and style
      ObjectSetString(0, name, OBJPROP_FONT, "Arial Bold");
      //--- Anchor the text depending on whether it's a swing high or low
      if(isHigh)
         ObjectSetInteger(0, name, OBJPROP_ANCHOR, ANCHOR_BOTTOM);
      else
         ObjectSetInteger(0, name, OBJPROP_ANCHOR, ANCHOR_TOP);
      //--- Center-align the text
      ObjectSetInteger(0, name, OBJPROP_ALIGN, ALIGN_CENTER);
   }
}
We define a set of helper functions to visualize price action structures by drawing triangles, trend lines, dotted lines, and text labels on the chart. These functions will help in marking key points, trend directions, and potential pivot levels. The "DrawTriangle" function creates a triangle object connecting three price points. It first uses the ObjectCreate function to define the object, of type OBJ_TRIANGLE, then assigns color, width, and fill properties using the ObjectSetInteger function. This function will be useful in marking harmonic formations and price action patterns.
The "DrawTrendLine" function plots trend lines between two price points, helping to define the pattern structure. It creates a trend line using the ObjectCreate function, of type OBJ_TREND and then customizes its color, width, and style. The "DrawDottedLine" function will help to draw a horizontal dotted line at a specified price level between two-time points. This will be useful for marking entry and exit levels, ensuring that key price zones are visually highlighted. The function sets the line style to STYLE_DOT for differentiation. The "DrawTextEx" function places text labels at specific pivot points. It assigns a name to the label, sets its color, font size, and alignment, and positions it either above or below the price level based on whether it’s a swing high or swing low. This helps annotate key pivot levels for better pattern recognition.
Armed with these variables and functions, we can graduate to the OnTick event handler and begin the pattern recognition. However, since we won't need to process anything on every tick, we need to define a logic that we can use to process the identification once per bar.
//+------------------------------------------------------------------+
//| Expert tick function                                             |
//+------------------------------------------------------------------+
void OnTick() {
   //--- Declare a static variable to store the time of the last processed bar
   static datetime lastBarTime = 0;
   //--- Get the time of the current confirmed bar
   datetime currentBarTime = iTime(_Symbol, _Period, 1);
   //--- If the current bar time is the same as the last processed, exit
   if(currentBarTime == lastBarTime)
      return;
   //--- Update the last processed bar time
   lastBarTime = currentBarTime;

}
To ensure the program executes logic only on new bars to prevent redundant calculations, we use the static variable "lastBarTime" to store the timestamp of the last processed bar. For each tick, we retrieve the latest confirmed bar’s time using the iTime function. If the retrieved time matches "lastBarTime", we exit early using a return statement to avoid reprocessing. Otherwise, we update "lastBarTime" to mark the new bar as processed, and we can proceed to prepare the storage array to receive the data for processing.
//--- Clear the pivot array for fresh analysis
ArrayResize(pivots, 0);
//--- Get the total number of bars available on the chart
int barsCount = Bars(_Symbol, _Period);
//--- Define the starting index for pivot detection (ensuring enough left bars)
int start = PivotLeft;
//--- Define the ending index for pivot detection (ensuring enough right bars)
int end = barsCount - PivotRight;

//--- Loop through bars from 'end-1' down to 'start' to find pivot points
for(int i = end - 1; i >= start; i--) {
   //--- Assume current bar is both a potential swing high and swing low
   bool isPivotHigh = true;
   bool isPivotLow = true;
   //--- Get the high and low of the current bar
   double currentHigh = iHigh(_Symbol, _Period, i);
   double currentLow = iLow(_Symbol, _Period, i);
   //--- Loop through the window of bars around the current bar
   for(int j = i - PivotLeft; j <= i + PivotRight; j++) {
      //--- Skip if the index is out of bounds
      if(j < 0 || j >= barsCount)
         continue;
      //--- Skip comparing the bar with itself
      if(j == i)
         continue;
      //--- If any bar in the window has a higher high, it's not a swing high
      if(iHigh(_Symbol, _Period, j) > currentHigh)
         isPivotHigh = false;
      //--- If any bar in the window has a lower low, it's not a swing low
      if(iLow(_Symbol, _Period, j) < currentLow)
         isPivotLow = false;
   }
   //--- If the current bar qualifies as either a swing high or swing low
   if(isPivotHigh || isPivotLow) {
      //--- Create a new pivot structure
      Pivot p;
      //--- Set the pivot's time
      p.time = iTime(_Symbol, _Period, i);
      //--- Set the pivot's price depending on whether it is a high or low
      p.price = isPivotHigh ? currentHigh : currentLow;
      //--- Set the pivot type (true for swing high, false for swing low)
      p.isHigh = isPivotHigh;
      //--- Get the current size of the pivots array
      int size = ArraySize(pivots);
      //--- Increase the size of the pivots array by one
      ArrayResize(pivots, size + 1);
      //--- Add the new pivot to the array
      pivots[size] = p;
   }
}
Here, we identify swing high and swing low pivot points on the chart by analyzing historical price data. First, we reset the "pivots" array using the ArrayResize function to ensure fresh analysis. We then retrieve the total number of bars using the Bars function and define the range for pivot detection, ensuring enough left and right bars for comparison.
Next, we use a for loop to iterate through the bars from "end-1" to "start", assuming each bar could be a potential pivot. We extract the bar’s high and low using the iHigh and iLow functions. We then compare the current bar with its surrounding bars within the "PivotLeft" and "PivotRight" range. If any bar in this range has a higher high, the current bar is not a swing high; if any has a lower low, it is not a swing low. If a bar qualifies as a pivot, we create a "Pivot" structure, store its "time" using the iTime function, set its "price" based on whether it's a high or low, and determine its type (true for swing high, false for swing low). Finally, we resize the "pivots" array using ArrayResize and add the identified pivot. When we print this data using the ArrayPrint function, we get the following outcome.
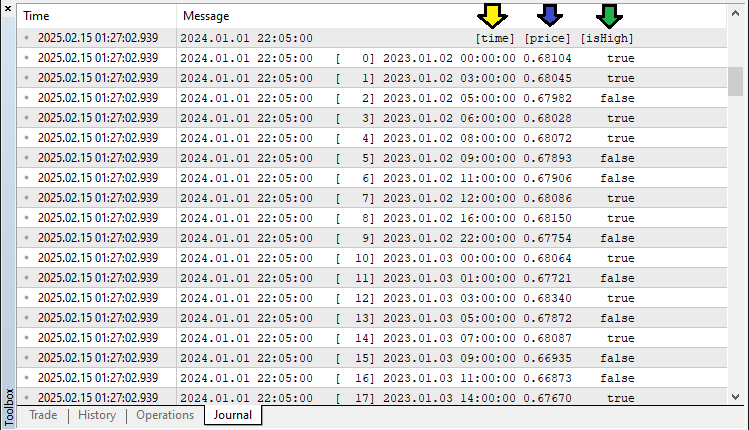
With the data, we can extract the pivot points and if we have enough pivots, we can analyze and detect the patterns. Here is the logic we implement to achieve that.
//--- Determine the total number of pivots found
int pivotCount = ArraySize(pivots);
//--- If fewer than five pivots are found, the pattern cannot be formed
if(pivotCount < 5) {
   //--- Reset pattern lock variables
   g_patternFormationBar = -1;
   g_lockedPatternX = 0;
   //--- Exit the OnTick function
   return;
}

//--- Extract the last five pivots as X, A, B, C, and D
Pivot X = pivots[pivotCount - 5];
Pivot A = pivots[pivotCount - 4];
Pivot B = pivots[pivotCount - 3];
Pivot C = pivots[pivotCount - 2];
Pivot D = pivots[pivotCount - 1];

//--- Initialize a flag to indicate if a valid Butterfly pattern is found
bool patternFound = false;
//--- Check for the high-low-high-low-high (Bearish reversal) structure
if(X.isHigh && (!A.isHigh) && B.isHigh && (!C.isHigh) && D.isHigh) {
   //--- Calculate the difference between pivot X and A
   double diff = X.price - A.price;
   //--- Ensure the difference is positive
   if(diff > 0) {
      //--- Calculate the ideal position for pivot B based on Fibonacci ratio
      double idealB = A.price + 0.786 * diff;
      //--- Check if actual B is within tolerance of the ideal position
      if(MathAbs(B.price - idealB) <= Tolerance * diff) {
         //--- Calculate the BC leg length
         double BC = B.price - C.price;
         //--- Verify that BC is within the acceptable Fibonacci range
         if((BC >= 0.382 * diff) && (BC <= 0.886 * diff)) {
            //--- Calculate the CD leg length
            double CD = D.price - C.price;
            //--- Verify that CD is within the acceptable Fibonacci range and that D is above X
            if((CD >= 1.27 * diff) && (CD <= 1.618 * diff) && (D.price > X.price))
               patternFound = true;
         }
      }
   }
}
Here, we validate whether a Butterfly harmonic pattern is present by analyzing the last five identified pivot points. First, we determine the total number of pivots using the ArraySize function. If fewer than five pivots exist, we reset the pattern lock variables ("g_patternFormationBar" and "g_lockedPatternX") and exit the OnTick function to avoid false signals. Next, we extract the last five pivots and assign them as "X", "A", "B", "C", and "D", following the geometric structure of the pattern. We then initialize the "patternFound" flag as false to track whether the conditions for a valid Butterfly pattern are met.
For a bearish reversal pattern, we verify the sequence of pivot highs and lows: "X" (high), "A" (low), "B" (high), "C" (low), and "D" (high). If this structure holds, we calculate the "XA" leg difference and use Fibonacci ratios to check the expected positions of "B", "C", and "D". The "B" pivot must be near the "0.786" retracement of "XA", "BC" should be between "0.382" and "0.886" of "XA", and "CD" should extend between "1.27" and "1.618" of "XA", ensuring "D" is above "X". If all these conditions are met, we confirm the pattern by setting "patternFound" to true. Similarly, we do the same for a bullish pattern.
//--- Check for the low-high-low-high-low (Bullish reversal) structure
if((!X.isHigh) && A.isHigh && (!B.isHigh) && C.isHigh && (!D.isHigh)) {
   //--- Calculate the difference between pivot A and X
   double diff = A.price - X.price;
   //--- Ensure the difference is positive
   if(diff > 0) {
      //--- Calculate the ideal position for pivot B based on Fibonacci ratio
      double idealB = A.price - 0.786 * diff;
      //--- Check if actual B is within tolerance of the ideal position
      if(MathAbs(B.price - idealB) <= Tolerance * diff) {
         //--- Calculate the BC leg length
         double BC = C.price - B.price;
         //--- Verify that BC is within the acceptable Fibonacci range
         if((BC >= 0.382 * diff) && (BC <= 0.886 * diff)) {
            //--- Calculate the CD leg length
            double CD = C.price - D.price;
            //--- Verify that CD is within the acceptable Fibonacci range and that D is below X
            if((CD >= 1.27 * diff) && (CD <= 1.618 * diff) && (D.price < X.price))
               patternFound = true;
         }
      }
   }
}
If the pattern is found, we can proceed to visualize it on the chart.
//--- Initialize a string to store the type of pattern detected
string patternType = "";
//--- If a valid pattern is found, determine its type based on the relationship between D and X
if(patternFound) {
   if(D.price > X.price)
      patternType = "Bearish";  //--- Bearish Butterfly indicates a SELL signal
   else if(D.price < X.price)
      patternType = "Bullish";  //--- Bullish Butterfly indicates a BUY signal
}

//--- If a valid Butterfly pattern is detected
if(patternFound) {
   //--- Print a message indicating the pattern type and detection time
   Print(patternType, " Butterfly pattern detected at ", TimeToString(D.time, TIME_DATE|TIME_MINUTES|TIME_SECONDS));

   //--- Create a unique prefix for all graphical objects related to this pattern
   string signalPrefix = "BF_" + IntegerToString(X.time);

   //--- Choose triangle color based on the pattern type
   color triangleColor = (patternType=="Bullish") ? clrBlue : clrRed;

   //--- Draw the first triangle connecting pivots X, A, and B
   DrawTriangle(signalPrefix+"_Triangle1", X.time, X.price, A.time, A.price, B.time, B.price,
                triangleColor, 2, true, true);
   //--- Draw the second triangle connecting pivots B, C, and D
   DrawTriangle(signalPrefix+"_Triangle2", B.time, B.price, C.time, C.price, D.time, D.price,
                triangleColor, 2, true, true);

   //--- Draw boundary trend lines connecting the pivots for clarity
   DrawTrendLine(signalPrefix+"_TL_XA", X.time, X.price, A.time, A.price, clrBlack, 2, STYLE_SOLID);
   DrawTrendLine(signalPrefix+"_TL_AB", A.time, A.price, B.time, B.price, clrBlack, 2, STYLE_SOLID);
   DrawTrendLine(signalPrefix+"_TL_BC", B.time, B.price, C.time, C.price, clrBlack, 2, STYLE_SOLID);
   DrawTrendLine(signalPrefix+"_TL_CD", C.time, C.price, D.time, D.price, clrBlack, 2, STYLE_SOLID);
   DrawTrendLine(signalPrefix+"_TL_XB", X.time, X.price, B.time, B.price, clrBlack, 2, STYLE_SOLID);
   DrawTrendLine(signalPrefix+"_TL_BD", B.time, B.price, D.time, D.price, clrBlack, 2, STYLE_SOLID);
}
Here, we finalize the Butterfly pattern detection by classifying it as either a bullish or bearish pattern and visually marking it on the chart. First, we initialize the "patternType" string to store whether the detected pattern is "Bullish" or "Bearish". If "patternFound" is true, we compare pivot "D" with pivot "X" using the "price" property. If "D" is higher than "X", we classify it as a "Bearish" pattern, signaling a potential sell opportunity. Conversely, if "D" is lower than "X", we classify it as a "Bullish" pattern, signaling a potential buy opportunity.
Once a pattern is detected, we print a message using the Print function to log the pattern type and detection time. A unique "signalPrefix" is generated using the IntegerToString function and "X.time" to ensure that each pattern has distinct graphical objects. We then use the "DrawTriangle" function to highlight the two triangular sections that form the Butterfly pattern. The triangles are colored clrBlue for bullish patterns and "clrRed" for bearish patterns. The first triangle connects pivots "X", "A", and "B", while the second connects pivots "B", "C", and "D".
To further enhance visualization, we use the "DrawTrendLine" function to create solid black trend lines connecting key pivot points: "XA", "AB", "BC", "CD", "XB", and "BD". These lines provide a clear structure for identifying the harmonic pattern and its symmetry. Upon compilation and run, we get the following results.
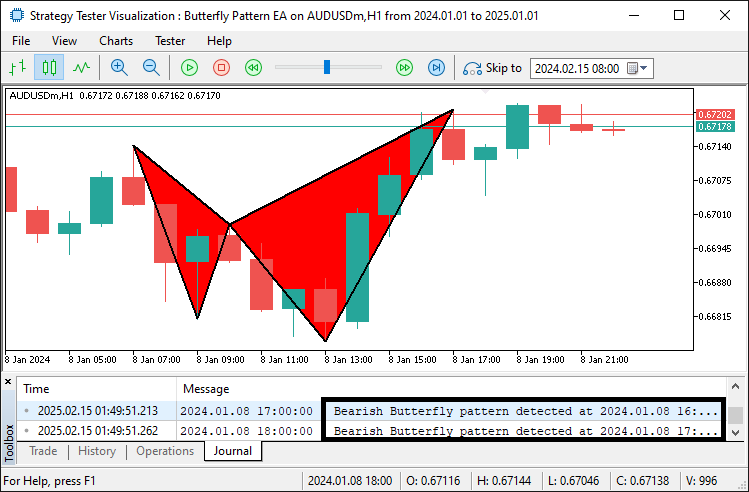
From the image, we can see that we can both identify the pattern and visualize it. We can then proceed with the labeling to improve its visual clarity.
//--- Retrieve the symbol's point size to calculate offsets for text positioning
double point = SymbolInfoDouble(_Symbol, SYMBOL_POINT);
//--- Calculate an offset (15 points) for positioning text above or below pivots
double offset = 15 * point;

//--- Determine the Y coordinate for each pivot label based on its type
double textY_X = (X.isHigh ? X.price + offset : X.price - offset);
double textY_A = (A.isHigh ? A.price + offset : A.price - offset);
double textY_B = (B.isHigh ? B.price + offset : B.price - offset);
double textY_C = (C.isHigh ? C.price + offset : C.price - offset);
double textY_D = (D.isHigh ? D.price + offset : D.price - offset);

//--- Draw text labels for each pivot with appropriate anchoring
DrawTextEx(signalPrefix+"_Text_X", "X", X.time, textY_X, clrBlack, 11, X.isHigh);
DrawTextEx(signalPrefix+"_Text_A", "A", A.time, textY_A, clrBlack, 11, A.isHigh);
DrawTextEx(signalPrefix+"_Text_B", "B", B.time, textY_B, clrBlack, 11, B.isHigh);
DrawTextEx(signalPrefix+"_Text_C", "C", C.time, textY_C, clrBlack, 11, C.isHigh);
DrawTextEx(signalPrefix+"_Text_D", "D", D.time, textY_D, clrBlack, 11, D.isHigh);

//--- Calculate the central label's time as the midpoint between pivots X and B
datetime centralTime = (X.time + B.time) / 2;
//--- Set the central label's price at pivot D's price
double centralPrice = D.price;
//--- Create the central text label indicating the pattern type
if(ObjectCreate(0, signalPrefix+"_Text_Center", OBJ_TEXT, 0, centralTime, centralPrice)) {
   ObjectSetString(0, signalPrefix+"_Text_Center", OBJPROP_TEXT,
      (patternType=="Bullish") ? "Bullish Butterfly" : "Bearish Butterfly");
   ObjectSetInteger(0, signalPrefix+"_Text_Center", OBJPROP_COLOR, clrBlack);
   ObjectSetInteger(0, signalPrefix+"_Text_Center", OBJPROP_FONTSIZE, 11);
   ObjectSetString(0, signalPrefix+"_Text_Center", OBJPROP_FONT, "Arial Bold");
   ObjectSetInteger(0, signalPrefix+"_Text_Center", OBJPROP_ALIGN, ALIGN_CENTER);
}
Here, we add text labels to mark the Butterfly pattern on the chart. First, we use the SymbolInfoDouble function to get the symbol’s SYMBOL_POINT value and calculate an "offset" for text positioning. Labels for pivots ("X", "A", "B", "C", "D") are positioned above or below based on whether they are highs or lows. We use the "DrawTextEx" function to place these labels with black font color and size 11. A central label indicating "Bullish Butterfly" or "Bearish Butterfly" is created at the midpoint between "X" and "B", using ObjectCreate, ObjectSetString, and ObjectSetInteger to set text, color, font size, and alignment for clear visibility. This is what we get after running the program.
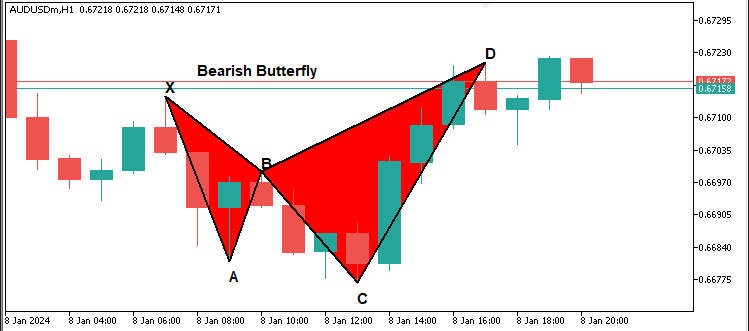
Since we now have the labels, we can proceed to add the entry and exit levels.
//--- Define start and end times for drawing horizontal dotted lines for obj_Trade levels
datetime lineStart = D.time;
datetime lineEnd = D.time + PeriodSeconds(_Period)*2;

//--- Declare variables for entry price and take profit levels
double entryPriceLevel, TP1Level, TP2Level, TP3Level, tradeDiff;
//--- Calculate obj_Trade levels based on whether the pattern is Bullish or Bearish
if(patternType=="Bullish") { //--- Bullish → BUY signal
   //--- Use the current ASK price as the entry
   entryPriceLevel = SymbolInfoDouble(_Symbol, SYMBOL_ASK);
   //--- Set TP3 at pivot C's price
   TP3Level = C.price;
   //--- Calculate the total distance to be covered by the obj_Trade
   tradeDiff = TP3Level - entryPriceLevel;
   //--- Set TP1 at one-third of the total move
   TP1Level = entryPriceLevel + tradeDiff/3;
   //--- Set TP2 at two-thirds of the total move
   TP2Level = entryPriceLevel + 2*tradeDiff/3;
} else { //--- Bearish → SELL signal
   //--- Use the current BID price as the entry
   entryPriceLevel = SymbolInfoDouble(_Symbol, SYMBOL_BID);
   //--- Set TP3 at pivot C's price
   TP3Level = C.price;
   //--- Calculate the total distance to be covered by the obj_Trade
   tradeDiff = entryPriceLevel - TP3Level;
   //--- Set TP1 at one-third of the total move
   TP1Level = entryPriceLevel - tradeDiff/3;
   //--- Set TP2 at two-thirds of the total move
   TP2Level = entryPriceLevel - 2*tradeDiff/3;
}

//--- Draw dotted horizontal lines to represent the entry and TP levels
DrawDottedLine(signalPrefix+"_EntryLine", lineStart, entryPriceLevel, lineEnd, clrMagenta);
DrawDottedLine(signalPrefix+"_TP1Line", lineStart, TP1Level, lineEnd, clrForestGreen);
DrawDottedLine(signalPrefix+"_TP2Line", lineStart, TP2Level, lineEnd, clrGreen);
DrawDottedLine(signalPrefix+"_TP3Line", lineStart, TP3Level, lineEnd, clrDarkGreen);

//--- Define a label time coordinate positioned just to the right of the dotted lines
datetime labelTime = lineEnd + PeriodSeconds(_Period)/2;

//--- Construct the entry label text with the price
string entryLabel = (patternType=="Bullish") ? "BUY (" : "SELL (";
entryLabel += DoubleToString(entryPriceLevel, _Digits) + ")";
//--- Draw the entry label on the chart
DrawTextEx(signalPrefix+"_EntryLabel", entryLabel, labelTime, entryPriceLevel, clrMagenta, 11, true);

//--- Construct and draw the TP1 label
string tp1Label = "TP1 (" + DoubleToString(TP1Level, _Digits) + ")";
DrawTextEx(signalPrefix+"_TP1Label", tp1Label, labelTime, TP1Level, clrForestGreen, 11, true);

//--- Construct and draw the TP2 label
string tp2Label = "TP2 (" + DoubleToString(TP2Level, _Digits) + ")";
DrawTextEx(signalPrefix+"_TP2Label", tp2Label, labelTime, TP2Level, clrGreen, 11, true);

//--- Construct and draw the TP3 label
string tp3Label = "TP3 (" + DoubleToString(TP3Level, _Digits) + ")";
DrawTextEx(signalPrefix+"_TP3Label", tp3Label, labelTime, TP3Level, clrDarkGreen, 11, true);
Here, we calculate trade entry and take profit (TP) levels based on the detected pattern. We begin by using the PeriodSeconds function to determine the duration for drawing horizontal trade levels. We then use the SymbolInfoDouble function to retrieve the entry price, applying SYMBOL_ASK for a buy and SYMBOL_BID for a sell. We set TP3 using the "C.price" variable and compute the total trade range. We calculate TP1 and TP2 by dividing this range into thirds. We use the "DrawDottedLine" function to draw the entry and TP levels with distinct colors. Next, we determine a suitable label time coordinate using the PeriodSeconds function for better positioning. We construct the entry label using the DoubleToString function to format the price accurately. Finally, we apply the "DrawTextEx" function to display the entry and TP labels on the chart. Upon compilation, we have the following outcome.
Bearish pattern:
Bullish pattern:
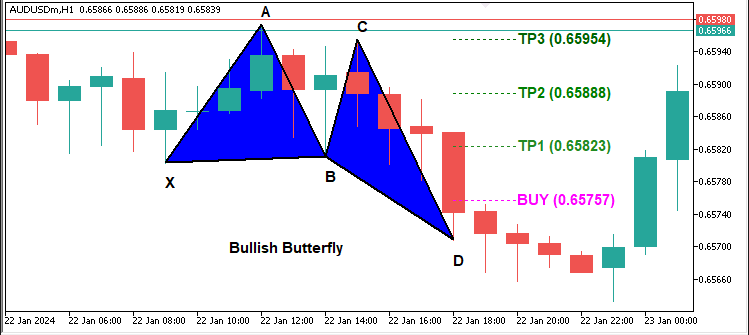
From the images, we can see that we can identify both patterns and plot them correctly. What we now need to do is wait for confirmations after a candlestick and if the pattern still exists, it means that it did not repaint, so we can proceed to open the respective positions from the entry level. Here is the logic we implement to achieve that.
//--- Retrieve the index of the current bar
int currentBarIndex = Bars(_Symbol, _Period) - 1;
//--- If no pattern has been previously locked, lock the current pattern formation
if(g_patternFormationBar == -1) {
   g_patternFormationBar = currentBarIndex;
   g_lockedPatternX = X.time;
   //--- Print a message that the pattern is detected and waiting for confirmation
   Print("Pattern detected on bar ", currentBarIndex, ". Waiting for confirmation on next bar.");
   return;
}
//--- If still on the same formation bar, the pattern is considered to be repainting
if(currentBarIndex == g_patternFormationBar) {
   Print("Pattern is repainting; still on locked formation bar ", currentBarIndex, ". No obj_Trade yet.");
   return;
}
//--- If we are on a new bar compared to the locked formation
if(currentBarIndex > g_patternFormationBar) {
   //--- Check if the locked pattern still corresponds to the same X pivot
   if(g_lockedPatternX == X.time) {
      Print("Confirmed pattern (locked on bar ", g_patternFormationBar, "). Opening obj_Trade on bar ", currentBarIndex, ".");
      //--- Update the pattern formation bar to the current bar
      g_patternFormationBar = currentBarIndex;
      //--- Only proceed with trading if allowed and if there is no existing position
      if(AllowTrading && !PositionSelect(_Symbol)) {
         double entryPriceTrade = 0, stopLoss = 0, takeProfit = 0;
         point = SymbolInfoDouble(_Symbol, SYMBOL_POINT);
         bool tradeResult = false;
         //--- For a Bullish pattern, execute a BUY obj_Trade
         if(patternType=="Bullish") {  //--- BUY signal
            entryPriceTrade = SymbolInfoDouble(_Symbol, SYMBOL_ASK);
            double diffTrade = TP2Level - entryPriceTrade;
            stopLoss = entryPriceTrade - diffTrade * 3;
            takeProfit = TP2Level;
            tradeResult = obj_Trade.Buy(LotSize, _Symbol, entryPriceTrade, stopLoss, takeProfit, "Butterfly Signal");
            if(tradeResult)
               Print("Buy order opened successfully.");
            else
               Print("Buy order failed: ", obj_Trade.ResultRetcodeDescription());
         }
         //--- For a Bearish pattern, execute a SELL obj_Trade
         else if(patternType=="Bearish") {  //--- SELL signal
            entryPriceTrade = SymbolInfoDouble(_Symbol, SYMBOL_BID);
            double diffTrade = entryPriceTrade - TP2Level;
            stopLoss = entryPriceTrade + diffTrade * 3;
            takeProfit = TP2Level;
            tradeResult = obj_Trade.Sell(LotSize, _Symbol, entryPriceTrade, stopLoss, takeProfit, "Butterfly Signal");
            if(tradeResult)
               Print("Sell order opened successfully.");
            else
               Print("Sell order failed: ", obj_Trade.ResultRetcodeDescription());
         }
      }
      else {
         //--- If a position is already open, do not execute a new obj_Trade
         Print("A position is already open for ", _Symbol, ". No new obj_Trade executed.");
      }
   }
   else {
      //--- If the pattern has changed, update the lock with the new formation bar and X pivot
      g_patternFormationBar = currentBarIndex;
      g_lockedPatternX = X.time;
      Print("Pattern has changed; updating lock on bar ", currentBarIndex, ". Waiting for confirmation.");
      return;
   }
}
}
else {
//--- If no valid Butterfly pattern is detected, reset the pattern lock variables
g_patternFormationBar = -1;
g_lockedPatternX = 0;
}
This section manages pattern locking and trade execution. First, we determine the current bar index using the Bars function and assign it to "currentBarIndex". If no pattern has been locked, indicated by "g_patternFormationBar" == -1, we assign "currentBarIndex" to "g_patternFormationBar" and store the X pivot time in "g_lockedPatternX", printing a message using the "Print" function that a pattern has been detected and is awaiting confirmation. If the detected pattern is still forming on the same bar, we use the Print function to display a message indicating that the pattern is repainting, and no trade is executed.
If the current bar advances beyond the locked formation bar, we check whether the pattern remains valid by comparing "g_lockedPatternX" with the current X pivot time. If it matches, we confirm the pattern and prepare for trade execution. Before placing an order, we use the PositionSelect function to ensure no existing position and check "AllowTrading". If a "Bullish" pattern is confirmed, we retrieve the asking price using the SymbolInfoDouble function with SYMBOL_ASK, calculate the stop loss and take profit based on "TP2Level", and execute a Buy order using the "obj_Trade.Buy" function. If the trade is successful, we use the "Print" function to display a confirmation message; otherwise, we use the "obj_Trade.ResultRetcodeDescription" function to print the failure reason.
For a "Bearish" pattern, we retrieve the bid price using the SymbolInfoDouble function with SYMBOL_BID, compute the trade levels, and execute a Sell order using the "obj_Trade.Sell" function, printing corresponding success or failure messages with the Print function. If a position already exists, no new trade is executed, and a message is printed using the "Print" function. If the locked X pivot changes, we update "g_patternFormationBar" and "g_lockedPatternX", indicating that the pattern has changed and is awaiting confirmation. If no valid pattern is detected, we reset "g_patternFormationBar" and "g_lockedPatternX" to clear previous locks.
Upon compilation, we have the following outcome.
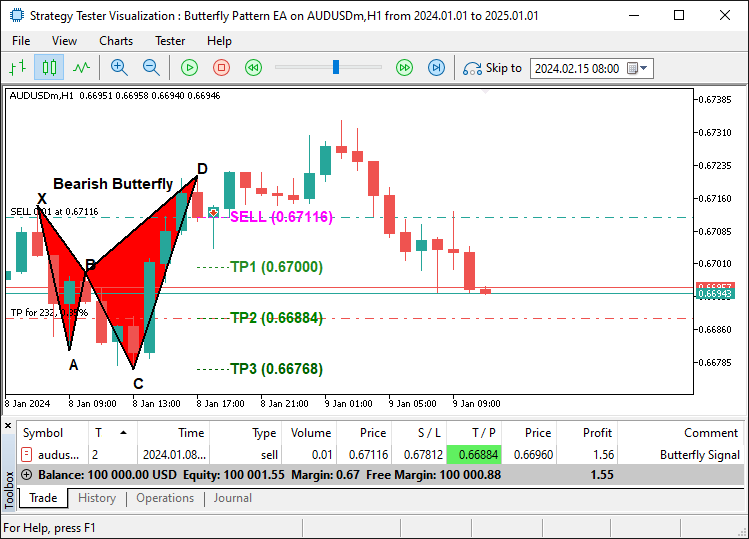
From the image, we can see that we plot the butterfly pattern and are still able to trade it accordingly once it is confirmed that it is stable, hence achieving our objective of identifying, plotting, and trading the pattern. The thing that remains is backtesting the program, and that is handled in the next section.
Backtesting and Optimization
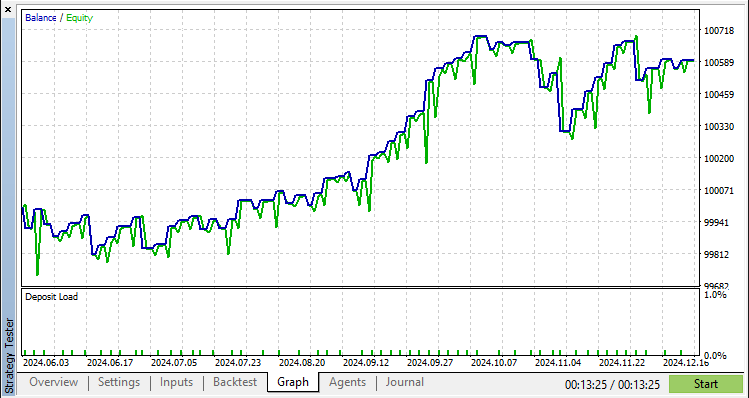
After thorough backtesting, we have the following results.
Backtest graph:
Backtest report:
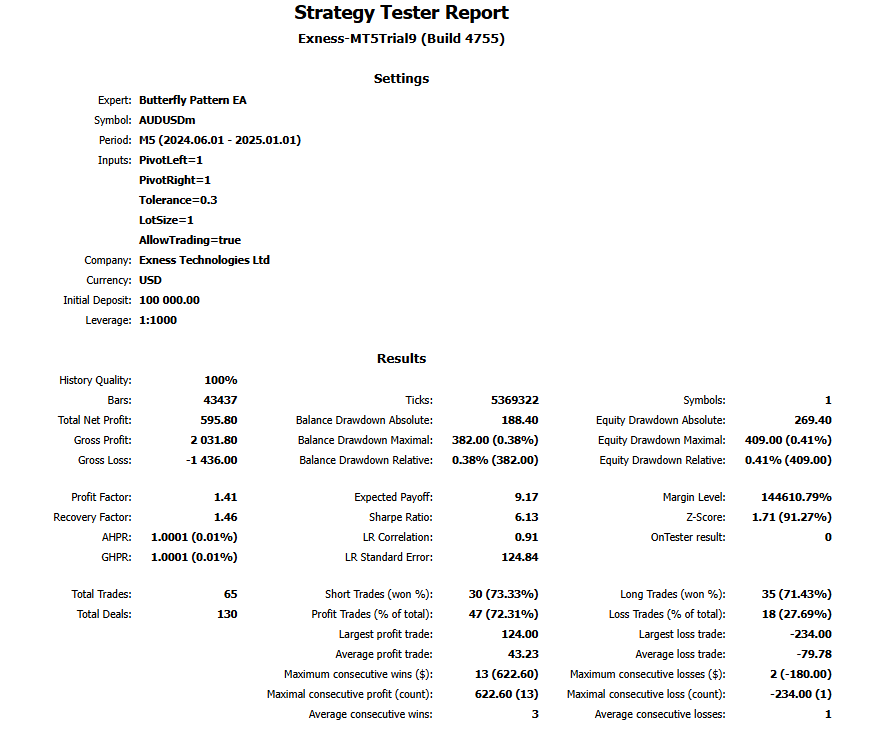
The testing period for half a year on a 5-minute chart producing 65 trades shows that the butterfly pattern is rare, and the more the tolerance percentage, the more the number of signals.
Conclusion
In conclusion, we have successfully developed an MQL5 Expert Advisor (EA) that detects and trades the Butterfly Harmonic Pattern with precision. By leveraging pattern recognition, pivot validation, and automated trade execution, we created a system that dynamically adapts to market conditions.
Disclaimer: This article is for educational purposes only. Trading involves significant financial risk, and market conditions can be unpredictable. While the strategy outlined provides a structured approach to harmonic trading, it does not guarantee profitability. Comprehensive backtesting and proper risk management are essential before deploying this program in a live environment.
By implementing these techniques, you can refine your harmonic pattern trading skills, enhance your technical analysis, and advance your algorithmic trading strategies. Best of luck on your trading journey!
Warning: All rights to these materials are reserved by MetaQuotes Ltd. Copying or reprinting of these materials in whole or in part is prohibited.
This article was written by a user of the site and reflects their personal views. MetaQuotes Ltd is not responsible for the accuracy of the information presented, nor for any consequences resulting from the use of the solutions, strategies or recommendations described.
 MQL5 Wizard Techniques you should know (Part 55): SAC with Prioritized Experience Replay
 Neural Networks in Trading: Injection of Global Information into Independent Channels (InjectTST)
 Anarchic Society Optimization (ASO) algorithm
 Build Self Optimizing Expert Advisors in MQL5 (Part 6): Stop Out Prevention
- Free trading apps
- Over 8,000 signals for copying
- Economic news for exploring financial markets
You agree to website policy and terms of use
Check out the new article: Automating Trading Strategies in MQL5 (Part 8): Building an Expert Advisor with Butterfly Harmonic Patterns.
Author: Allan Munene Mutiiria
Check out the new article: Automating Trading Strategies in MQL5 (Part 8): Building an Expert Advisor with Butterfly Harmonic Patterns.
Author: Allan Munene Mutiiria