
Cómo crear un panel informativo para mostrar datos en indicadores y asesores

Contenido
- Introducción
- Clases para obtener datos tabulares
- Clase de panel informativo
- Indicador con panel informativo
- Conclusión
Introducción
Hoy comenzaremos creando un panel informativo que muestre los datos especificados por el desarrollador. Un panel de este tipo será cómodo para representar visualmente los datos en el gráfico y realizar la depuración visual, cuando resulta más rápido mirar los valores de interés de los datos en el panel que seguirlos en el depurador. Es decir, en aquellos casos en los que estamos depurando una estrategia que depende de los valores de algunos datos, y no cuando se depura código en el depurador.
Implementaremos el panel como un prototipo de la ventana de datos en el terminal y lo rellenaremos con los mismos datos:
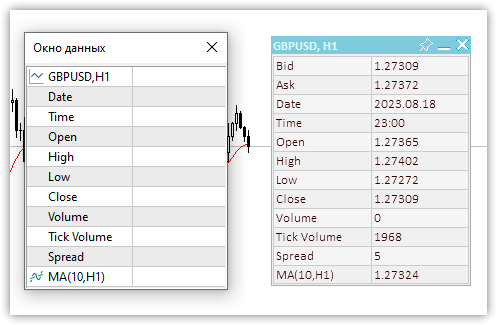
Fig.1 Ventana de datos y panel informativo
Nuestro panel personalizado nos permitirá añadirle los datos que deseemos, firmarlos (ponerles un título) y mostrar y actualizar las métricas desde el código de nuestro programa.
Podremos mover el panel por el gráfico con el ratón, fijarlo en el lugar deseado del gráfico y minimizarlo/desplegarlo. También habrá una opción para mostrar una tabla con un número especificado de filas y columnas en el panel para facilitar la disposición de nuestros datos. Los datos de esta tabla se podrán imprimir en el registro (coordenadas X e Y de cada celda de la tabla) y obtenerlos mediante de forma programática, para especificar el número de fila y columna donde estos datos deben estar, o simplemente imprimir las coordenadas en el registro y escribir los necesarios en nuestro código desde ella. El primer método será más cómodo debido a su completa automatización. El panel también tendrá un botón de cierre activo, pero su procesamiento se delegará al programa de control, ya que solo el desarrollador del programa deberá decidir cómo reaccionar al pulsar el botón de cierre. Al clicar en el botón, se enviará un evento personalizado al manejador de eventos del programa, que el desarrollador podrá procesar como considere oportuno.
Clases para obtener datos tabulares
Como resulta cómodo organizar los datos en el panel según unas coordenadas predefinidas (visual o virtualmente), crearemos en primer lugar las clases para organizar los datos tabulares. La tabla puede representarse como una cuadrícula simple cuyas intersecciones de las líneas supondrán las coordenadas de las celdas de la tabla. Precisamente en estas coordenadas podremos colocar cualquier dato visual. La tabla tendrá un número determinado de filas (líneas horizontales) y cada fila tendrá un número determinado de celdas (líneas verticales). En una tabla cuadriculada simple, todas las filas tendrán el mismo número de celdas.
Basándonos en esto, necesitaremos tres clases:
- La clase de celda de tabla,
- La clase de fila de tabla,
- La clase de tabla.
La clase de celda de tabla incluirá el número de fila y el número de columna en la tabla y las coordenadas de la ubicación visual de la celda de la tabla en el panel: las coordenadas X e Y relativas al origen de las coordenadas de la tabla en la esquina superior izquierda del panel.
La clase de fila de tabla incluirá la clase de celda de tabla. Podemos crear el número necesario de celdas en una fila.
La clase de tabla incluirá una lista de filas de tabla. Las filas de tabla pueden crearse y añadirse en el número necesario.
Vamos a analizar brevemente las tres clases.
Clase de celda de tabla
//+------------------------------------------------------------------+
//| Table cell class                                                 |
//+------------------------------------------------------------------+
class CTableCell : public CObject
  {
private:
   int               m_row;                     // Row
   int               m_col;                     // Column
   int               m_x;                       // X coordinate
   int               m_y;                       // Y coordinate
public:
//--- Methods of setting values
   void              SetRow(const uint row)     { this.m_row=(int)row;  }
   void              SetColumn(const uint col)  { this.m_col=(int)col;  }
   void              SetX(const uint x)         { this.m_x=(int)x;      }
   void              SetY(const uint y)         { this.m_y=(int)y;      }
   void              SetXY(const uint x,const uint y)
                       {
                        this.m_x=(int)x;
                        this.m_y=(int)y;
                       }
//--- Methods of obtaining values
   int               Row(void)            const { return this.m_row;    }
   int               Column(void)         const { return this.m_col;    }
   int               X(void)              const { return this.m_x;      }
   int               Y(void)              const { return this.m_y;      }
//--- Virtual method for comparing two objects
   virtual int       Compare(const CObject *node,const int mode=0) const
                       {
                        const CTableCell *compared=node;
                        return(this.Column()>compared.Column() ? 1 : this.Column()<compared.Column() ? -1 : 0);
                       }
//--- Constructor/destructor
                     CTableCell(const int row,const int column) : m_row(row),m_col(column){}
                    ~CTableCell(void){}
  };
La clase se hereda de la clase básica para la construcción de la Biblioteca Estándar MQL5, ya que se colocará en las listas CArrayObj de la Biblioteca Estándar MQL5, que solo puede contener objetos CObject, u objetos heredados de la base CObject.
La asignación de todas las variables y métodos resulta bastante transparente y clara. Las variables se usarán para almacenar los valores de fila (Row) y columna (Column) de la tabla, mientras que las coordenadas serán las coordenadas relativas de la esquina superior izquierda de la celda de la tabla en el panel. Estas coordenadas se usarán para dibujar o colocar algo en el panel.
Necesitaremos el método virtual Compare para encontrar y comparar dos objetos de celda de tabla. El método se declarará en la clase de objeto básico CObject:
   //--- method of comparing the objects
   virtual int       Compare(const CObject *node,const int mode=0) const { return(0);      }
retorna null, y deberá redefinirse en las clases heredadas.
Como las celdas de la tabla se añaden a la fila de la tabla, es decir, visualmente en horizontal, la búsqueda y comparación deberá realizarse por números de celda horizontales, según el valor Column. Eso es exactamente lo que hará el método virtual Compare:
//--- Virtual method for comparing two objects
   virtual int       Compare(const CObject *node,const int mode=0) const
                       {
                        const CTableCell *compared=node;
                        return(this.Column()>compared.Column() ? 1 : this.Column()<compared.Column() ? -1 : 0);
                       }
Si el valor de la columna del objeto actual es mayor que el del objeto comparado (cuyo puntero se pasará al método), se retornará 1; si el valor de la columna del objeto actual es menor que el del objeto comparado, se retornará -1. Si no, se retornará cero. Así, un valor nulo retornado por el método indicará que los valores de los objetos comparados son iguales.
Clase de fila de tabla
Los objetos de celda serán añadidos a una fila de la tabla. Si las celdas de una fila se suceden horizontalmente, las filas de la tabla se sucederán verticalmente.
Aquí solo necesitaremos conocer el número de fila y su coordenada Y en el panel:
//+------------------------------------------------------------------+
//| Table row class                                                  |
//+------------------------------------------------------------------+
class CTableRow : public CObject
  {
private:
  CArrayObj          m_list_cell;               // Cell list
  int                m_row;                     // Row index
  int                m_y;                       // Y coordinate
public:
//--- Return the list of table cells in a row
   CArrayObj        *GetListCell(void)       { return &this.m_list_cell;         }
//--- Return (1) the number of table cells in a row (2) the row index in the table
   int               CellsTotal(void)  const { return this.m_list_cell.Total();  }
   int               Row(void)         const { return this.m_row;                }
//--- (1) Set and (2) return the Y row coordinate
   void              SetY(const int y)       { this.m_y=y;                       }
   int               Y(void)           const { return this.m_y;                  }
//--- Add a new table cell to the row
   bool              AddCell(CTableCell *cell)
                       {
                        this.m_list_cell.Sort();
                        if(this.m_list_cell.Search(cell)!=WRONG_VALUE)
                          {
                           ::PrintFormat("%s: Table cell with index %lu is already in the list",__FUNCTION__,cell.Column());
                           return false;
                          }
                        if(!this.m_list_cell.InsertSort(cell))
                          {
                           ::PrintFormat("%s: Failed to add table cell with index %lu to list",__FUNCTION__,cell.Column());
                           return false;
                          }
                        return true;
                       }
//--- Return the pointer to the specified cell in the row
   CTableCell       *GetCell(const int column)
                       {
                        const CTableCell *obj=new CTableCell(this.m_row,column);
                        int index=this.m_list_cell.Search(obj);
                        delete obj;
                        return this.m_list_cell.At(index);
                       }
//--- Virtual method for comparing two objects
   virtual int       Compare(const CObject *node,const int mode=0) const
                       {
                        const CTableRow *compared=node;
                        return(this.Row()>compared.Row() ? 1 : this.Row()<compared.Row() ? -1 : 0);
                       }
//--- Constructor/destructor
                     CTableRow(const int row) : m_row(row)  { this.m_list_cell.Clear();   }
                    ~CTableRow(void)                        { this.m_list_cell.Clear();   }
  };
La clase declarará una lista CArrayObj en la que se colocarán los objetos de celda recién creados.
En el método virtual Compare, compararemos los objetos según el valor del número de fila (Row), ya que al añadir una nueva fila, necesitaremos buscar solo por el número de fila. Si no hay ninguna fila con ese número, el método de búsqueda (Search) retornará -1, de lo contrario, si el objeto existe, la búsqueda retornará el índice de la posición del objeto encontrado en la lista. El método Search se declarará e implementará en la clase CArrayObj:
//+------------------------------------------------------------------+
//| Search of position of element in a sorted array                  |
//+------------------------------------------------------------------+
int CArrayObj::Search(const CObject *element) const
  {
   int pos;
//--- check
   if(m_data_total==0 || !CheckPointer(element) || m_sort_mode==-1)
      return(-1);
//--- search
   pos=QuickSearch(element);
   if(m_data[pos].Compare(element,m_sort_mode)==0)
      return(pos);
//--- not found
   return(-1);
  }
Como podemos ver, en el se utilizará el método virtual Compare para comparar dos objetos y determinar si son iguales.
Método que añade una nueva celda a la lista:
//--- Add a new table cell to the row
   bool              AddCell(CTableCell *cell)
                       {
                        this.m_list_cell.Sort();
                        if(this.m_list_cell.Search(cell)!=WRONG_VALUE)
                          {
                           ::PrintFormat("%s: Table cell with index %lu is already in the list",__FUNCTION__,cell.Column());
                           return false;
                          }
                        if(!this.m_list_cell.InsertSort(cell))
                          {
                           ::PrintFormat("%s: Failed to add table cell with index %lu to list",__FUNCTION__,cell.Column());
                           return false;
                          }
                        return true;
                       }
Como las celdas se ordenan en la lista estrictamente una tras otra por números de columna (Column), y las añadimos en orden de clasificación, la lista deberá tener una bandera de lista clasificada que se establezca en primer lugar. Si la búsqueda de un objeto en la lista no retorna -1, significará que dicho objeto ya está en la lista, hecho sobre lo cual se imprimirá un mensaje en el registro y se retornará false. Igualmente, si fallamos al añadir el puntero a un objeto de la lista, también informaremos de ello y retornaremos false. Si todo va bien, retornaremos true.
Método que retorna un puntero a la celda especificada en la línea:
//--- Return the pointer to the specified cell in the row
   CTableCell       *GetCell(const int column)
                       {
                        const CTableCell *obj=new CTableCell(this.m_row,column);
                        int index=this.m_list_cell.Search(obj);
                        delete obj;
                        return this.m_list_cell.At(index);
                       }
El método Search de la clase CArrayObj de la Biblioteca Estándar busca en la lista de igualdad un ejemplar del objeto cuyo puntero se transmite al método. Así que aquí crearemos un nuevo objeto temporal especificando el número de columna transmitido al método en su constructor, obtendremos el índice del objeto en la lista, o -1 si el objeto con tales parámetros no se encuentra en la lista, eliminaremos necesariamente el objeto y retornaremos el puntero al objeto encontrado en la lista.
Si el objeto no se encuentra y el índice es igual a -1, el método At de la clase CArrayObj retornará NULL.
Clase de tabla
La tabla se compondrá de una lista de filas, que a su vez se compondrá de listas de celdas. Es decir, la clase de datos de tabla esencialmente solo tendrá un objeto CArrayObj que contendrá las filas a crear, así como los métodos para añadir y recuperar las filas y celdas de la tabla:
//+------------------------------------------------------------------+
//| Table data class                                                 |
//+------------------------------------------------------------------+
class CTableData : public CObject
  {
private:
   CArrayObj         m_list_rows;               // List of rows
public:
//--- Return the list of table rows
   CArrayObj        *GetListRows(void)       { return &this.m_list_rows;   }
//--- Add a new row to the table
   bool              AddRow(CTableRow *row)
                       {
                        //--- Set the sorted list flag
                        this.m_list_rows.Sort();
                        //--- If such an object is already in the list (the search returns the object index, not -1),
                        //--- inform of that in the journal and return 'false'
                        if(this.m_list_rows.Search(row)!=WRONG_VALUE)
                          {
                           ::PrintFormat("%s: Table row with index %lu is already in the list",__FUNCTION__,row.Row());
                           return false;
                          }
                        //--- If failed to add the pointer to the sorted list, inform of that and return 'false'
                        if(!this.m_list_rows.InsertSort(row))
                          {
                           ::PrintFormat("%s: Failed to add table cell with index %lu to list",__FUNCTION__,row.Row());
                           return false;
                          }
                        //--- Successful - return 'true'
                        return true;
                       }
//--- Return the pointer to the (1) specified row and (2) specified cell in the specified table row
   CTableRow        *GetRow(const int index) { return this.m_list_rows.At(index);   }
   CTableCell       *GetCell(const int row,const int column)
                       {
                        //--- Get a pointer to a string object in a list of strings
                        CTableRow *row_obj=this.GetRow(row);
                        //--- If failed to get the object, return NULL
                        if(row_obj==NULL)
                           .return NULL;
                        //--- Get the pointer to the cell object in the row by a column number and
                        CTableCell *cell=row_obj.GetCell(column);
                        //--- return the result (object pointer or NULL)
                        return cell;
                       }
//--- Write the X and Y coordinates of the specified table cell into the variables passed to the method
   void              CellXY(const uint row,const uint column, int &x, int &y)
                       {
                        x=WRONG_VALUE;
                        y=WRONG_VALUE;
                        CTableCell *cell=this.GetCell(row,column);
                        if(cell==NULL)
                           return;
                        x=cell.X();
                        y=cell.Y();
                       }
//--- Return the X coordinate of the specified table cell
   int               CellX(const uint row,const uint column)
                       {
                        CTableCell *cell=this.GetCell(row,column);
                        return(cell!=NULL ? cell.X() : WRONG_VALUE);
                       }
//--- Return the Y coordinate of the specified table cell
   int               CellY(const uint row,const uint column)
                       {
                        CTableCell *cell=this.GetCell(row,column);
                        return(cell!=NULL ? cell.Y() : WRONG_VALUE);
                       }
//--- Return the number of table (1) rows and (2) columns
   int               RowsTotal(void)            { return this.m_list_rows.Total();  }
   int               ColumnsTotal(void)
                       {
                        //--- If there is no row in the list, return 0
                        if(this.RowsTotal()==0)
                           return 0;
                        //--- Get a pointer to the first row and return the number of cells in it
                        CTableRow *row=this.GetRow(0);
                        return(row!=NULL ? row.CellsTotal() : 0);
                       }
//--- Return the total number of cells in the table
   int               CellsTotal(void){ return this.RowsTotal()*this.ColumnsTotal(); }
//--- Clear lists of rows and table cells
   void              Clear(void)
                       {
                        //--- In the loop by the number of rows in the list of table rows,
                        for(int i=0;i<this.m_list_rows.Total();i++)
                          {
                           //--- get the pointer to the next line
                           CTableRow *row=this.m_list_rows.At(i);
                           if(row==NULL)
                              continue;
                           //--- get cell list from the obtained row object,
                           CArrayObj *list_cell=row.GetListCell();
                           //--- clear cell list
                           if(list_cell!=NULL)
                              list_cell.Clear();
                          }
                        //--- Clear cell list
                        this.m_list_rows.Clear();
                       }
//--- Print the table cell data in the journal
   void              Print(const uint indent=0)
                       {
                        //--- Print the header in the journal
                        ::PrintFormat("Table: Rows: %lu, Columns: %lu",this.RowsTotal(),this.ColumnsTotal());
                        //--- In the loop by table rows
                        for(int r=0;r<this.RowsTotal();r++)
                           //--- in the loop by the next row cells,
                           for(int c=0;c<this.ColumnsTotal();c++)
                             {
                              //--- get the pointer to the next cell and display its data in the journal
                              CTableCell *cell=this.GetCell(r,c);
                              if(cell!=NULL)
                                 ::PrintFormat("%*s%-5s %-4lu %-8s %-6lu %-8s %-6lu %-8s %-4lu",indent,"","Row",r,"Column",c,"Cell X:",cell.X(),"Cell Y:",cell.Y());
                             }
                       }
//--- Constructor/destructor
                     CTableData(void)  { this.m_list_rows.Clear();   }
                    ~CTableData(void)  { this.m_list_rows.Clear();   }
  };
Casi todos los métodos están comentados en el código. Solo mencionaremos los métodos que retornan el número de filas y columnas de la tabla, y el número total de celdas de la tabla.
El número de filas será el tamaño de la lista de filas; se retornarán tantas filas como haya en la tabla:
int RowsTotal(void) { return this.m_list_rows.Total(); }
Pero aquí solo se retornará el número de columnas suponiendo que su número sea el mismo en cada fila, y solo se retornará el número de celdas de la primera fila (la fila con el índice cero en la lista):
   int               ColumnsTotal(void)
                       {
                        //--- If there is no row in the list, return 0
                        if(this.RowsTotal()==0)
                           return 0;
                        //--- Get a pointer to the first row and return the number of cells in it
                        CTableRow *row=this.GetRow(0);
                        return(row!=NULL ? row.CellsTotal() : 0);
                       }
Cuando se extienda y refine esta clase, podremos añadir métodos que retornen el número de celdas de la fila especificada y, en consecuencia, no retornar el número total de celdas de la tabla multiplicando el número (exacto) de filas de la tabla por el número de celdas de la primera fila (aquí con la suposición mencionada anteriormente):
int CellsTotal(void){ return this.RowsTotal()*this.ColumnsTotal(); }
Pero para esta versión de la clase de datos tabulares bastará para un cálculo preciso, por lo que no deberemos complicarlo todavía: estas son solo clases auxiliares para la clase de panel informativo donde utilizaremos el marcado tabular (cuadrícula) para colocar los datos en el panel.
Clase de panel informativo
Para mantener un registro de los estados del ratón y sus botones en relación con el panel y sus controles, definiremos todos los estados que pueden ocurrir:
- Los botones (izquierdo, derecho) del ratón no están pulsados,
- El botón del ratón se ha pulsado fuera de la ventana del panel,
- El botón del ratón se ha pulsado dentro de la ventana del panel,
- El botón del ratón se ha pulsado dentro de la barra de encabezado de la ventana del panel,
- El botón del ratón se ha pulsado sobre el control "cerrar",
- El botón del ratón se ha pulsado sobre el control "minimizar/desplegar",
- El botón del ratón se pulsado sobre el control "fijar",
- El cursor del ratón se encuentra fuera de la ventana del panel,
- El cursor del ratón se encuentra dentro de la ventana del panel,
- El cursor del ratón se encuentra dentro de la barra de encabezado de la ventana del panel,
- El cursor del ratón se encuentra dentro del control "cerrar",
- El cursor del ratón se encuentra dentro del control "minimizar/desplegar",
- El cursor del ratón se encuentra dentro del control "fijar".
Crearemos la enumeración correspondiente:
enum ENUM_MOUSE_STATE
  {
   MOUSE_STATE_NOT_PRESSED,
   MOUSE_STATE_PRESSED_OUTSIDE_WINDOW,
   MOUSE_STATE_PRESSED_INSIDE_WINDOW,
   MOUSE_STATE_PRESSED_INSIDE_HEADER,
   MOUSE_STATE_PRESSED_INSIDE_CLOSE,
   MOUSE_STATE_PRESSED_INSIDE_MINIMIZE,
   MOUSE_STATE_PRESSED_INSIDE_PIN,
   MOUSE_STATE_OUTSIDE_WINDOW,
   MOUSE_STATE_INSIDE_WINDOW,
   MOUSE_STATE_INSIDE_HEADER,
   MOUSE_STATE_INSIDE_CLOSE,
   MOUSE_STATE_INSIDE_MINIMIZE,
   MOUSE_STATE_INSIDE_PIN
  };
Actualmente, se implementa el seguimiento de la pulsación o el clic del botón del ratón en los controles del panel. Es decir, la primera pulsación supondrá el disparador para fijar el estado. No obstante, en las aplicaciones de Windows, ese disparador será la liberación de un botón tras haberlo pulsado, es decir, un clic. La pulsación y el mantenimiento de la misma se utilizarán para arrastrar y soltar objetos. Por ahora nos bastará con una solución sencilla: la primera pulsación se considerará un clic o un mantenimiento. Si continuamos desarrollando el panel, quizá compliquemos el manejo de los botones del ratón para que coincida con el comportamiento descrito anteriormente.
La clase CDashboard constará de dos elementos: el lienzo (sustrato), donde se dibujará el diseño del panel y los elementos de control, y el área de trabajo, donde se dibujarán los datos colocados en el panel. El área de trabajo siempre será totalmente transparente, mientras que el lienzo tendrá valores de transparencia individuales para el encabezado y para todo lo demás:
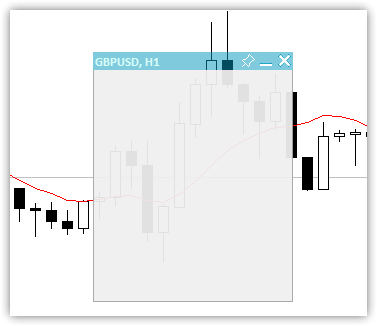
Fig.2 Solo el lienzo con diferente transparencia de encabezado y los márgenes con marco
La zona situada debajo de el encabezado, perfilada con un marco, se usará para colocar el área de trabajo, una zona totalmente transparente en la que se ubicarán los textos de los datos. Además, el área de lienzo bajo el encabezado podrá servir para el diseño visual, en este caso, las tablas se dibujarán en ella:
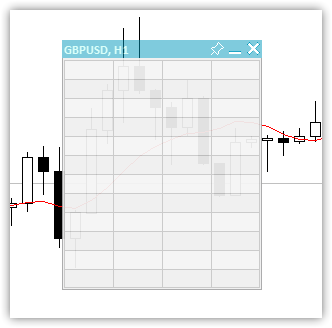
Fig.3 Tabla de 12 filas con 4 columnas
Y ya el área de trabajo con los datos se superpondrá sobre el lienzo diseñado. El resultado será un panel acondicionado:
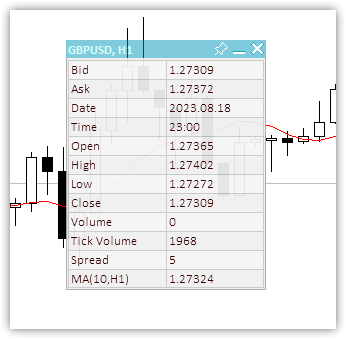
Fig.4 Aspecto del panel con una tabla de fondo 12x2 y los datos sobre ella
Los valores de algunos parámetros del panel se almacenarán en variables globales del terminal para que el panel recuerde sus estados y los restaure al reiniciar: las coordenadas X e Y, el estado de minimizado y la bandera de desplazamiento del panel. Cuando un panel se fija en el gráfico en un estado minimizado, esta posición fija se memorizará y la próxima vez que el panel fijo se minimice, se situará en la posición memorizada.
Fig.5 El panel "recuerda" su lugar de anclaje en caso de que estuviera fijado en la forma minimizada
En la figura anterior se puede ver que para recordar el punto de anclaje de un panel minimizado, deberemos minimizarlo, moverlo al punto de anclaje y fijarlo. Cuando el panel se fija en la posición desplegada, se memoriza su posición. A continuación, podrá desplegarse, desprenderse y desplazarse. Para que el panel vuelva al punto de anclaje memorizado, deberá fijarse y minimizarse. Sin anclaje, el panel se minimizará en su ubicación actual.
Cuerpo de la clase:
//+------------------------------------------------------------------+
//| Dashboard class                                                  |
//+------------------------------------------------------------------+
class CDashboard : public CObject
  {
private:
   CCanvas           m_canvas;                  // Canvas
   CCanvas           m_workspace;               // Work space
   CTableData        m_table_data;              // Table cell array
   ENUM_PROGRAM_TYPE m_program_type;            // Program type
   ENUM_MOUSE_STATE  m_mouse_state;             // Mouse button status
   uint              m_id;                      // Object ID
   long              m_chart_id;                // ChartID
   int               m_chart_w;                 // Chart width
   int               m_chart_h;                 // Chart height
   int               m_x;                       // X coordinate
   int               m_y;                       // Y coordinate
   int               m_w;                       // Width
   int               m_h;                       // Height
   int               m_x_dock;                  // X coordinate of the pinned collapsed panel
   int               m_y_dock;                  // Y coordinate of the pinned collapsed panel

   bool              m_header;                  // Header presence flag
   bool              m_butt_close;              // Close button presence flag
   bool              m_butt_minimize;           // Collapse/expand button presence flag
   bool              m_butt_pin;                // Pin button presence flag
   bool              m_wider_wnd;               // Flag for exceeding the horizontal size of the window width panel
   bool              m_higher_wnd;              // Flag for exceeding the vertical size of the window height panel
   bool              m_movable;                 // Panel movability flag
   int               m_header_h;                // Header height
   int               m_wnd;                     // Chart subwindow index

   uchar             m_header_alpha;            // Header transparency
   uchar             m_header_alpha_c;          // Current header transparency
   color             m_header_back_color;       // Header background color
   color             m_header_back_color_c;     // Current header background color
   color             m_header_fore_color;       // Header text color
   color             m_header_fore_color_c;     // Current header text color
   color             m_header_border_color;     // Header border color
   color             m_header_border_color_c;   // Current header border color

   color             m_butt_close_back_color;   // Close button background color
   color             m_butt_close_back_color_c; // Current close button background color
   color             m_butt_close_fore_color;   // Close button icon color
   color             m_butt_close_fore_color_c; // Current close button color

   color             m_butt_min_back_color;     // Expand/collapse button background color
   color             m_butt_min_back_color_c;   // Current expand/collapse button background color
   color             m_butt_min_fore_color;     // Expand/collapse button icon color
   color             m_butt_min_fore_color_c;   // Current expand/collapse button icon color

   color             m_butt_pin_back_color;     // Pin button background color
   color             m_butt_pin_back_color_c;   // Current pin button background color
   color             m_butt_pin_fore_color;     // Pin button icon color
   color             m_butt_pin_fore_color_c;   // Current pin button icon color

   uchar             m_alpha;                   // Panel transparency
   uchar             m_alpha_c;                 // Current panel transparency
   uchar             m_fore_alpha;              // Text transparency
   uchar             m_fore_alpha_c;            // Current text transparency
   color             m_back_color;              // Background color

   color             m_back_color_c;            // Current background color

   color             m_fore_color;              // Text color
   color             m_fore_color_c;            // Current text color
   color             m_border_color;            // Border color
   color             m_border_color_c;          // Current border color

   string            m_title;                   // Title text
   string            m_title_font;              // Title font
   int               m_title_font_size;         // Title font size
   string            m_font;                    // Font
   int               m_font_size;               // Font size

   bool              m_minimized;               // Collapsed panel window flag
   string            m_program_name;            // Program name
   string            m_name_gv_x;               // Name of the global terminal variable storing the X coordinate
   string            m_name_gv_y;               // Name of the global terminal variable storing the Y coordinate
   string            m_name_gv_m;               // Name of the global terminal variable storing the collapsed panel flag

   string            m_name_gv_u;               // Name of the global terminal variable storing the flag of the pinned panel

   uint              m_array_wpx[];             // Array of pixels to save/restore the workspace
   uint              m_array_ppx[];             // Array of pixels to save/restore the panel background

//--- Return the flag that the panel exceeds (1) the height and (2) the width of the corresponding chart size
   bool              HigherWnd(void)      const { return(this.m_h+2>this.m_chart_h);   }
   bool              WiderWnd(void)       const { return(this.m_w+2>this.m_chart_w);   }
//--- Enable/disable modes of working with the chart
   void              SetChartsTool(const bool flag);

//--- Save (1) the working space and (2) the panel background to the pixel array
   void              SaveWorkspace(void);
   void              SaveBackground(void);
//--- Restore (1) the working space and (2) the panel background from the pixel array
   void              RestoreWorkspace(void);
   void              RestoreBackground(void);

//--- Save the pixel array (1) of the working space and the (2) panel background to the file
   bool              FileSaveWorkspace(void);
   bool              FileSaveBackground(void);
//--- Load the pixel array of the (1) working space and (2) the panel background from the file
   bool              FileLoadWorkspace(void);
   bool              FileLoadBackground(void);

//--- Return the subwindow index
   int               GetSubWindow(void) const
                       {
                        return(this.m_program_type==PROGRAM_EXPERT || this.m_program_type==PROGRAM_SCRIPT ? 0 : ::ChartWindowFind());
                       }

protected:
//--- (1) Hide, (2) show and (3) bring the panel to the foreground
   void              Hide(const bool redraw=false);
   void              Show(const bool redraw=false);
   void              BringToTop(void);
//--- Return the chart ID
   long              ChartID(void)        const { return this.m_chart_id;              }
//--- Draw the header area
   void              DrawHeaderArea(const string title);
//--- Redraw the header area using a new color and text values
   void              RedrawHeaderArea(const color new_color=clrNONE,const string title="",const color title_new_color=clrNONE,const ushort new_alpha=USHORT_MAX);
//--- Draw the panel frame
   void              DrawFrame(void);
//--- (1) Draw and (2) redraw the panel closing button
   void              DrawButtonClose(void);
   void              RedrawButtonClose(const color new_back_color=clrNONE,const color new_fore_color=clrNONE,const ushort new_alpha=USHORT_MAX);
//--- (1) Draw and (2) redraw the panel collapse/expand button
   void              DrawButtonMinimize(void);
   void              RedrawButtonMinimize(const color new_back_color=clrNONE,const color new_fore_color=clrNONE,const ushort new_alpha=USHORT_MAX);
//--- (1) Draw and (2) redraw the panel pin button
   void              DrawButtonPin(void);
   void              RedrawButtonPin(const color new_back_color=clrNONE,const color new_fore_color=clrNONE,const ushort new_alpha=USHORT_MAX);

//--- Return the flag for working in the visual tester
   bool              IsVisualMode(void) const
                       { return (bool)::MQLInfoInteger(MQL_VISUAL_MODE);               }
//--- Return the timeframe description
   string            TimeframeDescription(const ENUM_TIMEFRAMES timeframe) const
                       { return ::StringSubstr(EnumToString(timeframe),7);             }

//--- Return the state of mouse buttons
   ENUM_MOUSE_STATE  MouseButtonState(const int x,const int y,bool pressed);
//--- Shift the panel to new coordinates
   void              Move(int x,int y);

//--- Convert RGB to color
   color             RGBToColor(const double r,const double g,const double b) const;
//--- Write RGB component values to variables
   void              ColorToRGB(const color clr,double &r,double &g,double &b);
//--- Return (1) Red, (2) Green, (3) Blue color components
   double            GetR(const color clr)      { return clr&0xff ;                    }
   double            GetG(const color clr)      { return(clr>>8)&0xff;                 }
   double            GetB(const color clr)      { return(clr>>16)&0xff;                }
//--- Return a new color
   color             NewColor(color base_color, int shift_red, int shift_green, int shift_blue);

//--- Draw a panel
   void              Draw(const string title);
//--- (1) Collapse and (2) expand the panel
   void              Collapse(void);
   void              Expand(void);

//--- Set the (1) X and (2) Y panel coordinates
   bool              SetCoordX(const int coord_x);
   bool              SetCoordY(const int coord_y);
//--- Set the panel (1) width and (2) height
   bool              SetWidth(const int width,const bool redraw=false);
   bool              SetHeight(const int height,const bool redraw=false);

public:
//--- Display the panel
   void              View(const string title)   { this.Draw(title);                    }
//--- Return the (1) CCanvas object, (2) working space, (3) object ID
   CCanvas          *Canvas(void)               { return &this.m_canvas;               }
   CCanvas          *Workspace(void)            { return &this.m_workspace;            }
   uint              ID(void)                   { return this.m_id;                    }

//--- Return the panel (1) X and (2) Y coordinates
   int               CoordX(void)         const { return this.m_x;                     }
   int               CoordY(void)         const { return this.m_y;                     }
//--- Return the panel (1) width and (2) height
   int               Width(void)          const { return this.m_w;                     }
   int               Height(void)         const { return this.m_h;                     }

//--- Return the (1) width, (2) height and (3) size of the specified text
   int               TextWidth(const string text)
                       { return this.m_workspace.TextWidth(text);                      }
   int               TextHeight(const string text)
                       { return this.m_workspace.TextHeight(text);                     }
   void              TextSize(const string text,int &width,int &height)
                       { this.m_workspace.TextSize(text,width,height);                 }

//--- Set the close button (1) presence, (2) absence flag
   void              SetButtonCloseOn(void);
   void              SetButtonCloseOff(void);
//--- Set the collapse/expand button (1) presence, (2) absence flag
   void              SetButtonMinimizeOn(void);
   void              SetButtonMinimizeOff(void);

//--- Set the panel coordinates
   bool              SetCoords(const int x,const int y);
//--- Set the panel size
   bool              SetSizes(const int w,const int h,const bool update=false);
//--- Set panel coordinates and size
   bool              SetParams(const int x,const int y,const int w,const int h,const bool update=false);

//--- Set the transparency of the panel (1) header and (2) working space
   void              SetHeaderTransparency(const uchar value);
   void              SetTransparency(const uchar value);
//--- Set default panel font parameters
   void              SetFontParams(const string name,const int size,const uint flags=0,const uint angle=0);
//--- Display a text message at the specified coordinates
   void              DrawText(const string text,const int x,const int y,const int width=WRONG_VALUE,const int height=WRONG_VALUE);
//--- Draw a (1) background grid (2) with automatic cell size
   void              DrawGrid(const uint x,const uint y,const uint rows,const uint columns,const uint row_size,const uint col_size,const color line_color=clrNONE,bool alternating_color=true);
   void              DrawGridAutoFill(const uint border,const uint rows,const uint columns,const color line_color=clrNONE,bool alternating_color=true);
//--- Print grid data (line intersection coordinates)
   void              GridPrint(const uint indent=0)   { this.m_table_data.Print(indent);  }
//--- Write the X and Y coordinate values of the specified table cell to variables
   void              CellXY(const uint row,const uint column, int &x, int &y) { this.m_table_data.CellXY(row,column,x,y);  }
//--- Return the (1) X and (2) Y coordinate of the specified table cell
   int               CellX(const uint row,const uint column)         { return this.m_table_data.CellX(row,column);         }
   int               CellY(const uint row,const uint column)         { return this.m_table_data.CellY(row,column);         }

//--- Event handler
   void              OnChartEvent(const int id,const long &lparam,const double &dparam,const string &sparam);
//--- Constructor/destructor
                     CDashboard(const uint id,const int x,const int y, const int w,const int h,const int wnd=-1);
                    ~CDashboard();
  };
Las variables y métodos declarados de la clase se comentarán detalladamente en el código. Veamos la implementación de algunos de los métodos.
Constructor de clase:
//+------------------------------------------------------------------+
//| Constructor                                                      |
//+------------------------------------------------------------------+
CDashboard::CDashboard(const uint id,const int x,const int y, const int w,const int h,const int wnd=-1) :
                        m_id(id),
                        m_chart_id(::ChartID()),
                        m_program_type((ENUM_PROGRAM_TYPE)::MQLInfoInteger(MQL_PROGRAM_TYPE)),
                        m_program_name(::MQLInfoString(MQL_PROGRAM_NAME)),
                        m_wnd(wnd==-1 ? GetSubWindow() : wnd),
                        m_chart_w((int)::ChartGetInteger(m_chart_id,CHART_WIDTH_IN_PIXELS,m_wnd)),
                        m_chart_h((int)::ChartGetInteger(m_chart_id,CHART_HEIGHT_IN_PIXELS,m_wnd)),
                        m_mouse_state(MOUSE_STATE_NOT_PRESSED),
                        m_x(x),
                        m_y(::ChartGetInteger(m_chart_id,CHART_SHOW_ONE_CLICK) ? (y<79 ? 79 : y) : y),
                        m_w(w),
                        m_h(h),
                        m_x_dock(m_x),
                        m_y_dock(m_y),
                        m_header(true),
                        m_butt_close(true),
                        m_butt_minimize(true),
                        m_butt_pin(true),
                        m_header_h(18),

                        //--- Panel header implementation
                        m_header_alpha(128),
                        m_header_alpha_c(m_header_alpha),
                        m_header_back_color(C'0,153,188'),
                        m_header_back_color_c(m_header_back_color),
                        m_header_fore_color(C'182,255,244'),
                        m_header_fore_color_c(m_header_fore_color),
                        m_header_border_color(C'167,167,168'),
                        m_header_border_color_c(m_header_border_color),
                        m_title("Dashboard"),
                        m_title_font("Calibri"),
                        m_title_font_size(-100),

                        //--- close button
                        m_butt_close_back_color(C'0,153,188'),
                        m_butt_close_back_color_c(m_butt_close_back_color),
                        m_butt_close_fore_color(clrWhite),
                        m_butt_close_fore_color_c(m_butt_close_fore_color),

                        //--- collapse/expand button
                        m_butt_min_back_color(C'0,153,188'),
                        m_butt_min_back_color_c(m_butt_min_back_color),
                        m_butt_min_fore_color(clrWhite),
                        m_butt_min_fore_color_c(m_butt_min_fore_color),

                        //--- pin button
                        m_butt_pin_back_color(C'0,153,188'),
                        m_butt_pin_back_color_c(m_butt_min_back_color),
                        m_butt_pin_fore_color(clrWhite),
                        m_butt_pin_fore_color_c(m_butt_min_fore_color),

                        //--- Panel implementation
                        m_alpha(240),
                        m_alpha_c(m_alpha),
                        m_fore_alpha(255),
                        m_fore_alpha_c(m_fore_alpha),
                        m_back_color(C'240,240,240'),
                        m_back_color_c(m_back_color),
                        m_fore_color(C'53,0,0'),
                        m_fore_color_c(m_fore_color),
                        m_border_color(C'167,167,168'),
                        m_border_color_c(m_border_color),
                        m_font("Calibri"),
                        m_font_size(-100),

                        m_minimized(false),
                        m_movable(true)
  {
//--- Set the permission for the chart to send messages about events of moving and pressing mouse buttons,
//--- mouse scroll events, as well as graphical object creation/deletion
   ::ChartSetInteger(this.m_chart_id,CHART_EVENT_MOUSE_MOVE,true);
   ::ChartSetInteger(this.m_chart_id,CHART_EVENT_MOUSE_WHEEL,true);
   ::ChartSetInteger(this.m_chart_id,CHART_EVENT_OBJECT_CREATE,true);
   ::ChartSetInteger(this.m_chart_id,CHART_EVENT_OBJECT_DELETE,true);

//--- Set the names of global terminal variables to store panel coordinates, collapsed/expanded state and pinning
   this.m_name_gv_x=this.m_program_name+"_id_"+(string)this.m_id+"_"+(string)this.m_chart_id+"_X";
   this.m_name_gv_y=this.m_program_name+"_id_"+(string)this.m_id+"_"+(string)this.m_chart_id+"_Y";
   this.m_name_gv_m=this.m_program_name+"_id_"+(string)this.m_id+"_"+(string)this.m_chart_id+"_Minimize";
   this.m_name_gv_u=this.m_program_name+"_id_"+(string)this.m_id+"_"+(string)this.m_chart_id+"_Unpin";

//--- If a global variable does not exist, create it and write the current value,
//--- otherwise - read the value from the terminal global variable into it
//--- X coordinate
   if(!::GlobalVariableCheck(this.m_name_gv_x))
      ::GlobalVariableSet(this.m_name_gv_x,this.m_x);
   else
      this.m_x=(int)::GlobalVariableGet(this.m_name_gv_x);
//--- Y coordinate
   if(!::GlobalVariableCheck(this.m_name_gv_y))
      ::GlobalVariableSet(this.m_name_gv_y,this.m_y);
   else
      this.m_y=(int)::GlobalVariableGet(this.m_name_gv_y);
//--- Collapsed/expanded
   if(!::GlobalVariableCheck(this.m_name_gv_m))
      ::GlobalVariableSet(this.m_name_gv_m,this.m_minimized);
   else
      this.m_minimized=(int)::GlobalVariableGet(this.m_name_gv_m);
//--- Collapsed/not collapsed
   if(!::GlobalVariableCheck(this.m_name_gv_u))
      ::GlobalVariableSet(this.m_name_gv_u,this.m_movable);
   else
      this.m_movable=(int)::GlobalVariableGet(this.m_name_gv_u);

//--- Set the flags for the size of the panel exceeding the size of the chart window
   this.m_higher_wnd=this.HigherWnd();
   this.m_wider_wnd=this.WiderWnd();

//--- If the panel graphical resource is created,
   if(this.m_canvas.CreateBitmapLabel(this.m_chart_id,this.m_wnd,"P"+(string)this.m_id,this.m_x,this.m_y,this.m_w,this.m_h,COLOR_FORMAT_ARGB_NORMALIZE))
     {
      //--- set the canvas font and fill the canvas with the transparent color
      this.m_canvas.FontSet(this.m_title_font,this.m_title_font_size,FW_BOLD);
      this.m_canvas.Erase(0x00FFFFFF);
     }
//--- otherwise - report unsuccessful object creation to the journal
   else
      ::PrintFormat("%s: Error. CreateBitmapLabel for canvas failed",(string)__FUNCTION__);

//--- If a working space of a graphical resource is created,
   if(this.m_workspace.CreateBitmapLabel(this.m_chart_id,this.m_wnd,"W"+(string)this.m_id,this.m_x+1,this.m_y+this.m_header_h,this.m_w-2,this.m_h-this.m_header_h-1,COLOR_FORMAT_ARGB_NORMALIZE))
     {
      //--- set the font for the working area and fill it with the transparent color
      this.m_workspace.FontSet(this.m_font,this.m_font_size);
      this.m_workspace.Erase(0x00FFFFFF);
     }
//--- otherwise - report unsuccessful object creation to the journal
   else
      ::PrintFormat("%s: Error. CreateBitmapLabel for workspace failed",(string)__FUNCTION__);
  }
La clase tiene un constructor paramétrico y otro que se creará por defecto. Obviamente, solo nos interesa el paramétrico, que se utilizará al crear un objeto de una clase. El identificador único del objeto, las coordenadas iniciales del panel, su anchura y altura y el número de la subventana en la que se colocará el panel se transmitirán al constructor mediante parámetros formales.
Para que la clase pueda crear objetos con nombres únicos, necesitaremos un identificador de panel único. Si utilizamos varios indicadores con paneles en un gráfico, para evitar un conflicto de nombres de objetos, necesitaremos precisamente este número único añadido al nombre del objeto de panel al crearlo. Al mismo tiempo, la unicidad del identificador deberá ser repetible: en cada nueva ejecución, el número deberá ser el mismo que en la ejecución anterior. Es decir, no podremos utilizar, por ejemplo, GetTickCount() para un identificador.
El número de subventana, si se especifica por defecto (-1), se buscará de forma programática; en caso contrario, utilizaremos el especificado en el parámetro.
Los parámetros por defecto se establecerán en la lista de inicialización del constructor. Para algunos parámetros responsables de la apariencia, hemos creado dos variables (para cada uno): el valor por defecto y el valor actual de la propiedad. Esto es necesario para los cambios interactivos, por ejemplo, el color al pasar el ratón por encima de la zona del panel de la que son responsables dichos parámetros.
En el cuerpo del constructor estableceremos los valores de las variables globales del terminal y crearemos dos objetos gráficos: el lienzo y el área de trabajo del panel.
El código completo del constructor está comentado al detalle.
Destructor de la clase:
//+------------------------------------------------------------------+
//| Destructor                                                       |
//+------------------------------------------------------------------+
CDashboard::~CDashboard()
  {
//--- Write the current values to global terminal variables
   ::GlobalVariableSet(this.m_name_gv_x,this.m_x);
   ::GlobalVariableSet(this.m_name_gv_y,this.m_y);
   ::GlobalVariableSet(this.m_name_gv_m,this.m_minimized);
   ::GlobalVariableSet(this.m_name_gv_u,this.m_movable);
//--- Delete panel objects
   this.m_canvas.Destroy();
   this.m_workspace.Destroy();
  }
Aquí primero resetearemos los valores de las coordenadas y las banderas a las variables globales del terminal, y luego eliminaremos los objetos del lienzo y del área de trabajo.
Para interactuar con el panel usando el cursor y los botones del ratón, deberemos conocer la posición del cursor en relación con el panel y sus controles. Al mover el cursor, podremos seguir sus coordenadas y los estados de los botones en el manejador de eventos de la clase. El manejador de eventos de la clase tiene los mismos parámetros que el manejador de eventos estándar OnChartEvent:
void  OnChartEvent()
   const int       id,       // event ID
   const long&     lparam,   // long type event parameter
   const double&   dparam,   // double type event parameter
   const string&   sparam    // string type event parameter
   );
Parámetros
id
[in] Identificador de evento de la enumeración ENUM_CHART_EVENT.
lparam
[in] Parámetro de evento de tipo long
dparam
[in] Parámetro de evento de tipo doble
sparam
[in] Parámetro de evento de tipo string
Valor retornado
Sin valor retornado
Observación
Existen 11 tipos de eventos que pueden ser procesados usando la función predefinida OnChartEvent(). Existen 65535 identificadores para eventos de usuario que van desde CHARTEVENT_CUSTOM hasta CHARTEVENT_CUSTOM_LAST, ambos inclusive. Para generar un evento personalizado, deberemos utilizar la función EventChartCustom().
Breve descripción de los eventos de la enumeración ENUM_CHART_EVENT:
- CHARTEVENT_KEYDOWN — pulsación del teclado cuando la ventana del gráfico está en foco;
- CHARTEVENT_MOUSE_MOVE — movimiento del ratón y clic de los botones del ratón (si para el gráfico se ha establecido la propiedad CHART_EVENT_MOUSE_MOVE=true);
- CHARTEVENT_OBJECT_CREATE — creación de un objeto gráfico (si para el gráfico se ha establecido la propiedad CHART_EVENT_OBJECT_CREATE=true);
- CHARTEVENT_OBJECT_CHANGE — cambio de las propiedades del objeto usando la ventana de diálogo de propiedades;
- CHARTEVENT_OBJECT_DELETE — eliminación del objeto gráfico (si para el gráfico se ha establecido la propiedad CHART_EVENT_OBJECT_DELETE=true);
- CHARTEVENT_CLICK — clic del ratón en el gráfico;
- CHARTEVENT_OBJECT_CLICK — clic del ratón en un objeto gráfico perteneciente al gráfico;
- CHARTEVENT_OBJECT_DRAG — desplazamiento de un objeto gráfico con el ratón;
- CHARTEVENT_OBJECT_ENDEDIT — fin de la edición del texto en el campo de entrada del objeto gráfico Edit (OBJ_EDIT);
- CHARTEVENT_CHART_CHANGE — cambios en el gráfico;
- CHARTEVENT_CUSTOM+n — identificador de evento de usuario, donde n va de 0 a 65535. CHARTEVENT_CUSTOM_LAST contiene el último identificador de evento de usuario válido (CHARTEVENT_CUSTOM+65535).
El parámetro lparam contendrá la coordenada X, dparam contendrá la coordenada Y, y sparam contendrá los valores-combinaciones de las banderas para determinar el estado de los botones del ratón. Todos estos parámetros deberán obtenerse y procesarse respecto a las coordenadas del panel y sus elementos, asimismo, deberá determinarse el estado y enviarse al manejador de eventos de la clase, donde se prescribirá la reacción a todos estos estados.
Método que retorna el estado del cursor y del botón del ratón en relación con el panel:
//+------------------------------------------------------------------+
//| Returns the state of the mouse cursor and button                 |
//+------------------------------------------------------------------+
ENUM_MOUSE_STATE CDashboard::MouseButtonState(const int x,const int y,bool pressed)
  {
//--- If the button is pressed
   if(pressed)
     {
      //--- If the state has already been saved, exit
      if(this.m_mouse_state!=MOUSE_STATE_NOT_PRESSED)
         return this.m_mouse_state;
      //--- If the button is pressed inside the window
      if(x>this.m_x && x<this.m_x+this.m_w && y>this.m_y && y<this.m_y+this.m_h)
        {
         //--- If the button is pressed inside the header
         if(y>this.m_y && y<=this.m_y+this.m_header_h)
           {
            //--- Bring the panel to the foreground
            this.BringToTop();
            //--- Coordinates of the close, collapse/expand and pin buttons
            int wc=(this.m_butt_close ? this.m_header_h : 0);
            int wm=(this.m_butt_minimize ? this.m_header_h : 0);
            int wp=(this.m_butt_pin ? this.m_header_h : 0);
            //--- If the close button is pressed, return this state
            if(x>this.m_x+this.m_w-wc)
               return MOUSE_STATE_PRESSED_INSIDE_CLOSE;
            //--- If the collapse/expand button is pressed, return this state
            if(x>this.m_x+this.m_w-wc-wm)
               return MOUSE_STATE_PRESSED_INSIDE_MINIMIZE;
            //--- If the pin button is pressed, return this state
            if(x>this.m_x+this.m_w-wc-wm-wp)
               return MOUSE_STATE_PRESSED_INSIDE_PIN;
            //--- If the button is not pressed on the control buttons of the panel, record and return the state of the button press inside the header
            this.m_mouse_state=MOUSE_STATE_PRESSED_INSIDE_HEADER;
            return this.m_mouse_state;
           }
         //--- If a button inside the window is pressed, write the state to a variable and return it
         else if(y>this.m_y+this.m_header_h && y<this.m_y+this.m_h)
           {
            this.m_mouse_state=MOUSE_STATE_PRESSED_INSIDE_WINDOW;
            return this.m_mouse_state;
           }
        }
      //--- The button is pressed outside the window - write the state to a variable and return it
      else
        {
         this.m_mouse_state=MOUSE_STATE_PRESSED_OUTSIDE_WINDOW;
         return this.m_mouse_state;
        }
     }
//--- If the button is not pressed
   else
     {
      //--- Write the state of the unpressed button to the variable
      this.m_mouse_state=MOUSE_STATE_NOT_PRESSED;
      //--- If the cursor is inside the panel
      if(x>this.m_x && x<this.m_x+this.m_w && y>this.m_y && y<this.m_y+this.m_h)
        {
         //--- If the cursor is inside the header
         if(y>this.m_y && y<=this.m_y+this.m_header_h)
           {
            //--- Specify the width of the close, collapse/expand and pin buttons
            int wc=(this.m_butt_close ? this.m_header_h : 0);
            int wm=(this.m_butt_minimize ? this.m_header_h : 0);
            int wp=(this.m_butt_pin ? this.m_header_h : 0);
            //--- If the cursor is inside the close button, return this state
            if(x>this.m_x+this.m_w-wc)
               return MOUSE_STATE_INSIDE_CLOSE;
            //--- If the cursor is inside the minimize/expand button, return this state
            if(x>this.m_x+this.m_w-wc-wm)
               return MOUSE_STATE_INSIDE_MINIMIZE;
            //--- If the cursor is inside the pin button, return this state
            if(x>this.m_x+this.m_w-wc-wm-wp)
               return MOUSE_STATE_INSIDE_PIN;
            //--- If the cursor is outside the buttons inside the header area, return this state
            return MOUSE_STATE_INSIDE_HEADER;
           }
         //--- Otherwise, the cursor is inside the working space. Return this state
         else
            return MOUSE_STATE_INSIDE_WINDOW;
        }
     }
//--- In any other case, return the state of the unpressed mouse button
   return MOUSE_STATE_NOT_PRESSED;
  }
La lógica del método se aclarará en los comentarios al código. Simplemente determinaremos las coordenadas mutuas del cursor y el panel y sus elementos, y retornaremos el estado. La bandera del botón del ratón pulsado o soltado se enviará directamente al método. Para cada uno de estos estados, hay un bloque de código diferente que definirá los estados cuando se pulsa o se suelta el botón. Usar la lógica de esta manera resulta bastante fácil y rápido, pero existen desventajas: no se podrá detectar un clic del ratón sobre un control, solo la pulsación sobre él. Normalmente, los clics se captan al soltar el botón del ratón, mientras que la pulsación y retención se capta al pulsar el botón del ratón. Con la lógica utilizada aquí, el clic y la pulsación mantenida será solo un clic del botón del ratón.
Los estados recibidos en este método deberán enviarse al manejador de eventos, donde cada evento tendrá su propio manejador que cambiará el comportamiento y la apariencia del panel:
//+------------------------------------------------------------------+
//| Event handler                                                    |
//+------------------------------------------------------------------+
void CDashboard::OnChartEvent(const int id,const long &lparam,const double &dparam,const string &sparam)
  {
//--- If a graphical object is created
   if(id==CHARTEVENT_OBJECT_CREATE)
     {
      this.BringToTop();
      ::ObjectSetInteger(this.m_chart_id,sparam,OBJPROP_SELECTED,true);
     }
//--- If the chart is changed
   if(id==CHARTEVENT_CHART_CHANGE)
     {
      //--- Get the chart subwindow index (it may change when removing the window of any indicator)
      this.m_wnd=this.GetSubWindow();
      //--- Get the new chart size
      int w=(int)::ChartGetInteger(this.m_chart_id,CHART_WIDTH_IN_PIXELS,this.m_wnd);
      int h=(int)::ChartGetInteger(this.m_chart_id,CHART_HEIGHT_IN_PIXELS,this.m_wnd);
      //--- Determine whether the panel dimensions extend beyond the chart window
      this.m_higher_wnd=this.HigherWnd();
      this.m_wider_wnd=this.WiderWnd();
      //--- If the chart height has changed, adjust the panel vertical position
      if(this.m_chart_h!=h)
        {
         this.m_chart_h=h;
         int y=this.m_y;
         if(this.m_y+this.m_h>h-1)
            y=h-this.m_h-1;
         if(y<1)
            y=1;
         this.Move(this.m_x,y);
        }
      //--- If the chart weight has changed, adjust the panel horizontal position
      if(this.m_chart_w!=w)
        {
         this.m_chart_w=w;
         int x=this.m_x;
         if(this.m_x+this.m_w>w-1)
            x=w-this.m_w-1;
         if(x<1)
            x=1;
         this.Move(x,this.m_y);
        }
     }

//--- Declare variables to store the current cursor shift relative to the initial coordinates of the panel
   static int diff_x=0;
   static int diff_y=0;

//--- Get the flag of the held mouse button. We also take into account the right button for the visual tester (sparam=="2")
   bool pressed=(!this.IsVisualMode() ? (sparam=="1" || sparam=="" ? true : false) : sparam=="1" || sparam=="2" ? true : false);
//--- Get the cursor X and Y coordinates. Take into account the shift for the Y coordinate when working in the chart subwindow
   int  mouse_x=(int)lparam;
   int  mouse_y=(int)dparam-(int)::ChartGetInteger(this.m_chart_id,CHART_WINDOW_YDISTANCE,this.m_wnd);
//--- Get the state of the cursor and mouse buttons relative to the panel
   ENUM_MOUSE_STATE state=this.MouseButtonState(mouse_x,mouse_y,pressed);
//--- If the cursor moves
   if(id==CHARTEVENT_MOUSE_MOVE)
     {
      //--- If a button is pressed inside the working area of the panel
      if(state==MOUSE_STATE_PRESSED_INSIDE_WINDOW)
        {
         //--- Disable chart scrolling, right-click menu and crosshair
         this.SetChartsTool(false);
         //--- Redraw the header area with the default background color
         if(this.m_header_back_color_c!=this.m_header_back_color)
           {
            this.RedrawHeaderArea(this.m_header_back_color);
            this.m_canvas.Update();
           }
         return;
        }
      //--- If a button is pressed inside the panel header area
      else if(state==MOUSE_STATE_PRESSED_INSIDE_HEADER)
        {
         //--- Disable chart scrolling, right-click menu and crosshair
         this.SetChartsTool(false);
         //--- Redraw the header area with a new background color
         color new_color=this.NewColor(this.m_header_back_color,-10,-10,-10);
         if(this.m_header_back_color_c!=new_color)
           {
            this.RedrawHeaderArea(new_color);
            this.m_canvas.Update();
           }
         //--- Shift the panel following the cursor taking into account the amount of cursor displacement relative to the initial coordinates of the panel
         if(this.m_movable)
            this.Move(mouse_x-diff_x,mouse_y-diff_y);
         return;
        }

      //--- If the close button is pressed
      else if(state==MOUSE_STATE_PRESSED_INSIDE_CLOSE)
        {
         //--- Disable chart scrolling, right-click menu and crosshair
         this.SetChartsTool(false);
         //--- Redraw the close button with a new background color
         color new_color=this.NewColor(clrRed,0,40,40);
         if(this.m_butt_close_back_color_c!=new_color)
           {
            this.RedrawButtonClose(new_color);
            this.m_canvas.Update();
           }
         //--- Close button press handling should be defined in the program.
         //--- Send the click event of this button to its OnChartEvent handler.
         //--- Event ID 1001,
         //--- lparam=panel ID (m_id),
         //--- dparam=0
         //--- sparam="Close button pressed"
         ushort event=CHARTEVENT_CUSTOM+1;
         ::EventChartCustom(this.m_chart_id,ushort(event-CHARTEVENT_CUSTOM),this.m_id,0,"Close button pressed");
        }
      //--- If the panel collapse/expand button is pressed
      else if(state==MOUSE_STATE_PRESSED_INSIDE_MINIMIZE)
        {
         //--- Disable chart scrolling, right-click menu and crosshair
         this.SetChartsTool(false);
         //--- "flip" the panel collapse flag,
         this.m_minimized=!this.m_minimized;
         //--- redraw the panel taking into account the new state of the flag,
         this.Draw(this.m_title);
         //--- redraw the panel header area
         this.RedrawHeaderArea();
         //--- If the panel is pinned and expanded, move it to the stored location coordinates
         if(this.m_minimized && !this.m_movable)
            this.Move(this.m_x_dock,this.m_y_dock);
         //--- Update the canvas with chart redrawing and
         this.m_canvas.Update();
         //--- write the state of the panel expand flag to the global terminal variable
         ::GlobalVariableSet(this.m_name_gv_m,this.m_minimized);
        }
      //--- If the panel pin button is pressed
      else if(state==MOUSE_STATE_PRESSED_INSIDE_PIN)
        {
         //--- Disable chart scrolling, right-click menu and crosshair
         this.SetChartsTool(false);
         //--- "flip" the panel collapse flag,
         this.m_movable=!this.m_movable;
         //--- Redraw the pin button with a new background color
         color new_color=this.NewColor(this.m_butt_pin_back_color,30,30,30);
         if(this.m_butt_pin_back_color_c!=new_color)
            this.RedrawButtonPin(new_color);
         //--- If the panel is collapsed and pinned, save its coordinates
         //--- When expanded and collapsed again, the panel returns to these coordinates
         //--- Relevant for pinning a collapsed panel at the bottom of the screen
         if(this.m_minimized && !this.m_movable)
           {
            this.m_x_dock=this.m_x;
            this.m_y_dock=this.m_y;
           }
         //--- Update the canvas with chart redrawing and
         this.m_canvas.Update();
         //--- write the state of the panel movability flag to the global terminal variable
         ::GlobalVariableSet(this.m_name_gv_u,this.m_movable);
        }

      //--- If the cursor is inside the panel header area
      else if(state==MOUSE_STATE_INSIDE_HEADER)
        {
         //--- Disable chart scrolling, right-click menu and crosshair
         this.SetChartsTool(false);
         //--- Redraw the header area with a new background color
         color new_color=this.NewColor(this.m_header_back_color,20,20,20);
         if(this.m_header_back_color_c!=new_color)
           {
            this.RedrawHeaderArea(new_color);
            this.m_canvas.Update();
           }
        }

      //--- If the cursor is inside the close button
      else if(state==MOUSE_STATE_INSIDE_CLOSE)
        {
         //--- Disable chart scrolling, right-click menu and crosshair
         this.SetChartsTool(false);
         //--- Redraw the header area with a minimal change in the background color
         color new_color=this.NewColor(this.m_header_back_color,0,0,1);
         if(this.m_header_back_color_c!=new_color)
            this.RedrawHeaderArea(new_color);
         //--- Redraw the collapse/expand button with the default background color
         if(this.m_butt_min_back_color_c!=this.m_butt_min_back_color)
            this.RedrawButtonMinimize(this.m_butt_min_back_color);
         //--- Redraw the pin button with the default background color
         if(this.m_butt_pin_back_color_c!=this.m_butt_pin_back_color)
            this.RedrawButtonPin(this.m_butt_pin_back_color);
         //--- Redraw the close button with the red background color
         if(this.m_butt_close_back_color_c!=clrRed)
           {
            this.RedrawButtonClose(clrRed);
            this.m_canvas.Update();
           }
        }

      //--- If the cursor is inside the collapse/expand button
      else if(state==MOUSE_STATE_INSIDE_MINIMIZE)
        {
         //--- Disable chart scrolling, right-click menu and crosshair
         this.SetChartsTool(false);
         //--- Redraw the header area with a minimal change in the background color
         color new_color=this.NewColor(this.m_header_back_color,0,0,1);
         if(this.m_header_back_color_c!=new_color)
            this.RedrawHeaderArea(new_color);
         //--- Redraw the close button with the default background color
         if(this.m_butt_close_back_color_c!=this.m_butt_close_back_color)
            this.RedrawButtonClose(this.m_butt_close_back_color);
         //--- Redraw the pin button with the default background color
         if(this.m_butt_pin_back_color_c!=this.m_butt_pin_back_color)
            this.RedrawButtonPin(this.m_butt_pin_back_color);
         //--- Redraw the collapse/expand button with a new background color
         new_color=this.NewColor(this.m_butt_min_back_color,20,20,20);
         if(this.m_butt_min_back_color_c!=new_color)
           {
            this.RedrawButtonMinimize(new_color);
            this.m_canvas.Update();
           }
        }

      //--- If the cursor is inside the pin button
      else if(state==MOUSE_STATE_INSIDE_PIN)
        {
         //--- Disable chart scrolling, right-click menu and crosshair
         this.SetChartsTool(false);
         //--- Redraw the header area with a minimal change in the background color
         color new_color=this.NewColor(this.m_header_back_color,0,0,1);
         if(this.m_header_back_color_c!=new_color)
            this.RedrawHeaderArea(new_color);
         //--- Redraw the close button with the default background color
         if(this.m_butt_close_back_color_c!=this.m_butt_close_back_color)
            this.RedrawButtonClose(this.m_butt_close_back_color);
         //--- Redraw the collapse/expand button with the default background color
         if(this.m_butt_min_back_color_c!=this.m_butt_min_back_color)
            this.RedrawButtonMinimize(this.m_butt_min_back_color);
         //--- Redraw the pin button with a new background color
         new_color=this.NewColor(this.m_butt_pin_back_color,20,20,20);
         if(this.m_butt_pin_back_color_c!=new_color)
           {
            this.RedrawButtonPin(new_color);
            this.m_canvas.Update();
           }
        }

      //--- If the cursor is inside the working space
      else if(state==MOUSE_STATE_INSIDE_WINDOW)
        {
         //--- Disable chart scrolling, right-click menu and crosshair
         this.SetChartsTool(false);
         //--- Redraw the header area with the default background color
         if(this.m_header_back_color_c!=this.m_header_back_color)
           {
            this.RedrawHeaderArea(this.m_header_back_color);
            this.m_canvas.Update();
           }
        }
      //--- Otherwise (the cursor is outside the panel, and we need to restore the chart parameters)
      else
        {
         //--- Enable chart scrolling, right-click menu and crosshair
         this.SetChartsTool(true);
         //--- Redraw the header area with the default background color
         if(this.m_header_back_color_c!=this.m_header_back_color)
           {
            this.RedrawHeaderArea(this.m_header_back_color);
            this.m_canvas.Update();
           }
        }
      //--- Write the cursor shift by X and Y relative to the panel initial coordinates
      diff_x=mouse_x-this.m_x;
      diff_y=mouse_y-this.m_y;
     }
  }
La lógica del controlador de eventos se comentará en el código con bastante detalle. Vamos a hacer algunas puntualizaciones.
El procesamiento del evento de creación de un nuevo objeto gráfico se describirá al principio:
//--- If a graphical object is created
   if(id==CHARTEVENT_OBJECT_CREATE)
     {
      this.BringToTop();
      ::ObjectSetInteger(this.m_chart_id,sparam,OBJPROP_SELECTED,true);
     }
Pero ¿para qué sirve y qué hace? Si creamos un nuevo objeto gráfico, este se situará por encima de los demás objetos gráficos del gráfico y, en consecuencia, se superpondrá sobre el panel. Por consiguiente, cuando se define un evento de este tipo, el panel pasará inmediatamente a primer plano. Y entonces el nuevo objeto gráfico se hará seleccionado. ¿Para qué? Si no hacemos esto, los objetos gráficos que necesitan varios puntos para ser dibujados, por ejemplo, las líneas de tendencia, no se crearán con normalidad: todos sus puntos de referencia se encontrarán en una coordenada, y el objeto en sí no resultará visible. Esto ocurre debido a la pérdida de control sobre el objeto gráfico al crear este, cuando el panel se desplaza al primer plano. Por ello, deberemos forzar la selección de un nuevo objeto gráfico después de mover el panel al primer plano.
Así, el comportamiento recíproco del panel y de los objetos gráficos cuando se creen será el siguiente:
Fig.6 Un nuevo objeto gráfico se construye "bajo" el panel y no pierde el foco durante la creación
El manejador de eventos tendrá su propio bloque de procesamiento para cada estado, y la lógica de todos estos bloques será idéntica. Por ejemplo, al hacer clic y mantener pulsado el ratón sobre el encabezado de un panel:
      //--- If a button is pressed inside the panel header area
      else if(state==MOUSE_STATE_PRESSED_INSIDE_HEADER)
        {
         //--- Disable chart scrolling, right-click menu and crosshair
         this.SetChartsTool(false);
         //--- Redraw the header area with a new background color
         color new_color=this.NewColor(this.m_header_back_color,-10,-10,-10);
         if(this.m_header_back_color_c!=new_color)
           {
            this.RedrawHeaderArea(new_color);
            this.m_canvas.Update();
           }
         //--- Shift the panel following the cursor taking into account the amount of cursor displacement relative to the initial coordinates of the panel
         if(this.m_movable)
            this.Move(mouse_x-diff_x,mouse_y-diff_y);
         return;
        }
Para evitar que el gráfico se mueva con el panel, los eventos de desplazamiento del gráfico con el ratón, el menú del botón derecho y la cuadrícula estarán desactivados para el gráfico. Como el encabezado tiene que responder visualmente a la captura con el ratón, su color se hará más oscuro. Antes de cambiar el color por uno nuevo, deberemos comprobar si ya se ha cambiado, ¿por qué cambiarlo siempre por el mismo color, restando recursos al procesador? Y entonces, si no está prohibido moverlo (el panel no está fijo), lo desplazaremos a unas nuevas coordenadas calculadas según las coordenadas del ratón menos el desplazamiento de la posición del cursor respecto a la esquina superior izquierda del panel. Si se considera el desplazamiento, el panel se situará exactamente en las coordenadas del cursor con la esquina superior izquierda.
Método para desplazar el panel a las coordenadas especificadas:
//+------------------------------------------------------------------+
//| Move the panel                                                   |
//+------------------------------------------------------------------+
void CDashboard::Move(int x,int y)
  {
   int h=this.m_canvas.Height();
   int w=this.m_canvas.Width();
   if(!this.m_wider_wnd)
     {
      if(x+w>this.m_chart_w-1)
         x=this.m_chart_w-w-1;
      if(x<1)
         x=1;
     }
   else
     {
      if(x>1)
         x=1;
      if(x<this.m_chart_w-w-1)
         x=this.m_chart_w-w-1;
     }
   if(!this.m_higher_wnd)
     {
      if(y+h>this.m_chart_h-2)
         y=this.m_chart_h-h-2;
      if(y<1)
         y=1;
     }
   else
     {
      if(y>1)
         y=1;
      if(y<this.m_chart_h-h-2)
         y=this.m_chart_h-h-2;
     }
   if(this.SetCoords(x,y))
      this.m_canvas.Update();
  }
Las coordenadas a las que deseamos mover el panel se transmitirán al método. Si el panel se sale del gráfico al cambiar las coordenadas, estas se ajustarán para que el panel quede siempre dentro de la ventana del gráfico con un margen de 1 píxel respecto a cualquier borde. Una vez finalizadas todas las comprobaciones y correcciones de las coordenadas del panel, se establecerán las nuevas coordenadas de su ubicación en el gráfico.
Métodos que establecen las coordenadas del panel:
//+------------------------------------------------------------------+
//| Set the panel X coordinate                                       |
//+------------------------------------------------------------------+
bool CDashboard::SetCoordX(const int coord_x)
  {
   int x=(int)::ObjectGetInteger(this.m_chart_id,this.m_canvas.ChartObjectName(),OBJPROP_XDISTANCE);
   if(x==coord_x)
      return true;
   if(!::ObjectSetInteger(this.m_chart_id,this.m_canvas.ChartObjectName(),OBJPROP_XDISTANCE,coord_x))
      return false;
   if(!::ObjectSetInteger(this.m_chart_id,this.m_workspace.ChartObjectName(),OBJPROP_XDISTANCE,coord_x+1))
      return false;
   this.m_x=coord_x;
   return true;
  }
//+------------------------------------------------------------------+
//| Set the panel Y coordinate                                       |
//+------------------------------------------------------------------+
bool CDashboard::SetCoordY(const int coord_y)
  {
   int y=(int)::ObjectGetInteger(this.m_chart_id,this.m_canvas.ChartObjectName(),OBJPROP_YDISTANCE);
   if(y==coord_y)
      return true;
   if(!::ObjectSetInteger(this.m_chart_id,this.m_canvas.ChartObjectName(),OBJPROP_YDISTANCE,coord_y))
      return false;
   if(!::ObjectSetInteger(this.m_chart_id,this.m_workspace.ChartObjectName(),OBJPROP_YDISTANCE,coord_y+this.m_header_h))
      return false;
   this.m_y=coord_y;
   return true;
  }
Si transmitimos al método una coordenada igual a la coordenada del panel, no será necesario establecerla de nuevo, bastará con retornar el éxito de la ejecución del método. Primero se desplazará el lienzo y luego el área de trabajo. El área de trabajo se desplazará en función de su posición relativa en el lienzo: a la izquierda, un píxel dentro del panel, y arriba, un píxel a la altura del encabezado.
Métodos que establecen las dimensiones del panel:
//+------------------------------------------------------------------+
//| Set the panel width                                              |
//+------------------------------------------------------------------+
bool CDashboard::SetWidth(const int width,const bool redraw=false)
  {
   if(width<4)
     {
      ::PrintFormat("%s: Error. Width cannot be less than 4px",(string)__FUNCTION__);
      return false;
     }
   if(width==this.m_canvas.Width())
      return true;
   if(!this.m_canvas.Resize(width,this.m_canvas.Height()))
      return false;
   if(width-2<1)
      ::ObjectSetInteger(this.m_chart_id,this.m_workspace.ChartObjectName(),OBJPROP_TIMEFRAMES,OBJ_NO_PERIODS);
   else
     {
      ::ObjectSetInteger(this.m_chart_id,this.m_workspace.ChartObjectName(),OBJPROP_TIMEFRAMES,OBJ_ALL_PERIODS);
      if(!this.m_workspace.Resize(width-2,this.m_workspace.Height()))
         return false;
     }
   this.m_w=width;
   return true;
  }
//+------------------------------------------------------------------+
//| Set the panel height                                             |
//+------------------------------------------------------------------+
bool CDashboard::SetHeight(const int height,const bool redraw=false)
  {
   if(height<::fmax(this.m_header_h,1))
     {
      ::PrintFormat("%s: Error. Width cannot be less than %lupx",(string)__FUNCTION__,::fmax(this.m_header_h,1));
      return false;
     }
   if(height==this.m_canvas.Height())
      return true;
   if(!this.m_canvas.Resize(this.m_canvas.Width(),height))
      return false;
   if(height-this.m_header_h-2<1)
      ::ObjectSetInteger(this.m_chart_id,this.m_workspace.ChartObjectName(),OBJPROP_TIMEFRAMES,OBJ_NO_PERIODS);
   else
     {
      ::ObjectSetInteger(this.m_chart_id,this.m_workspace.ChartObjectName(),OBJPROP_TIMEFRAMES,OBJ_ALL_PERIODS);
      if(!this.m_workspace.Resize(this.m_workspace.Width(),height-this.m_header_h-2))
         return false;
     }
   this.m_h=height;
   return true;
  }
Es exactamente lo mismo que establecer coordenadas, si el tamaño transmitido a un método es el mismo tamaño que ya tiene el panel, los métodos simplemente retornarán true. Un detalle digno de mención es que el área de trabajo es siempre más pequeña que el lienzo. Si redimensionamos el área de trabajo de modo que el tamaño sea inferior a 1, el área de trabajo simplemente se ocultará sin redimensionar para evitar un error de cambio de tamaño.
Métodos auxiliares que establecen dos coordenadas a la vez, todas las dimensiones al mismo tiempo, y las coordenadas y las dimensiones del panel a la vez:
//+------------------------------------------------------------------+
//| Set the panel coordinates                                        |
//+------------------------------------------------------------------+
bool CDashboard::SetCoords(const int x,const int y)
  {
   bool res=true;
   res &=this.SetCoordX(x);
   res &=this.SetCoordY(y);
   return res;
  }
//+------------------------------------------------------------------+
//| Set the panel size                                               |
//+------------------------------------------------------------------+
bool CDashboard::SetSizes(const int w,const int h,const bool update=false)
  {
   bool res=true;
   res &=this.SetWidth(w);
   res &=this.SetHeight(h);
   if(res && update)
      this.Expand();
   return res;
  }
//+------------------------------------------------------------------+
//| Set panel coordinates and size                                   |
//+------------------------------------------------------------------+
bool CDashboard::SetParams(const int x,const int y,const int w,const int h,const bool update=false)
  {
   bool res=true;
   res &=this.SetCoords(x,y);
   res &=this.SetSizes(w,h);
   if(res && update)
      this.Expand();
   return res;
  }
Los parámetros y la bandera de actualización se transmitirán a los métodos. Una vez que los parámetros se hayan establecido correctamente y, si la bandera de actualización está activada, se llamará al método de despliegue del panel, que redibujará todos los elementos del mismo.
Método que dibuja el área de encabezado:
//+------------------------------------------------------------------+
//| Draw the header area                                             |
//+------------------------------------------------------------------+
void CDashboard::DrawHeaderArea(const string title)
  {
//--- Exit if the header is not used
   if(!this.m_header)
      return;
//--- Set the title text
   this.m_title=title;
//--- The Y coordinate of the text is located vertically in the center of the header area
   int y=this.m_header_h/2;
//--- Fill the area with color
   this.m_canvas.FillRectangle(0,0,this.m_w-1,this.m_header_h-1,::ColorToARGB(this.m_header_back_color,this.m_header_alpha));
//--- Display the header text
   this.m_canvas.TextOut(2,y,this.m_title,::ColorToARGB(this.m_header_fore_color,this.m_header_alpha),TA_LEFT|TA_VCENTER);
//--- Save the current header background color
   this.m_header_back_color_c=this.m_header_back_color;
//--- Draw control elements (close, collapse/expand and pin buttons) and
   this.DrawButtonClose();
   this.DrawButtonMinimize();
   this.DrawButtonPin();
//--- update the canvas without redrawing the screen
   this.m_canvas.Update(false);
  }
El método dibuja el área de el encabezado, pintando un área rectangular en las coordenadas de el encabezado y dibujando los controles, es decir, los botones de cierre, minimización/despliegue y fijación. Para el área de encabezado, se utilizarán los colores y la transparencia por defecto.
Método que redibuja el área de encabezado:
//+------------------------------------------------------------------+
//| Redraw header area                                               |
//+------------------------------------------------------------------+
void CDashboard::RedrawHeaderArea(const color new_color=clrNONE,const string title="",const color title_new_color=clrNONE,const ushort new_alpha=USHORT_MAX)
  {
//--- Exit if the header is not used or all passed parameters have default values
   if(!this.m_header || (new_color==clrNONE && title=="" && title_new_color==clrNONE && new_alpha==USHORT_MAX))
      return;
//--- Exit if all passed parameters are equal to those already set
   if(new_color==this.m_header_back_color && title==this.m_title && title_new_color==this.m_header_fore_color && new_alpha==this.m_header_alpha)
      return;
//--- If the title is not equal to the default value, set a new title
   if(title!="")
      this.m_title=title;
//--- Define new background and text colors, and transparency
   color back_clr=(new_color!=clrNONE ? new_color : this.m_header_back_color);
   color fore_clr=(title_new_color!=clrNONE ? title_new_color : this.m_header_fore_color);
   uchar alpha=uchar(new_alpha==USHORT_MAX ? this.m_header_alpha : new_alpha>255 ? 255 : new_alpha);
//--- The Y coordinate of the text is located vertically in the center of the header area
   int y=this.m_header_h/2;
//--- Fill the area with color
   this.m_canvas.FillRectangle(0,0,this.m_w-1,this.m_header_h-1,::ColorToARGB(back_clr,alpha));
//--- Display the header text
   this.m_canvas.TextOut(2,y,this.m_title,::ColorToARGB(fore_clr,alpha),TA_LEFT|TA_VCENTER);
//--- Save the current header background color, text and transparency
   this.m_header_back_color_c=back_clr;
   this.m_header_fore_color_c=fore_clr;
   this.m_header_alpha_c=alpha;
//--- Draw control elements (close, collapse/expand and pin buttons) and
   this.RedrawButtonClose(back_clr,clrNONE,alpha);
   this.RedrawButtonMinimize(back_clr,clrNONE,alpha);
   this.RedrawButtonPin(back_clr,clrNONE,alpha);
//--- update the canvas without redrawing the screen
   this.m_canvas.Update(true);
  }
Al método se transmitirán el nuevo color de fondo, el nuevo texto de encabezado, el nuevo color de texto del encabezado y la nueva transparencia. Si los parámetros transmitidos son idénticos a los ya establecidos, el método finalizará. Este permitirá actualizar el color de el encabezado, su texto y su transparencia.
Método que dibuja el marco del panel:
//+------------------------------------------------------------------+
//| Draw the panel frame                                             |
//+------------------------------------------------------------------+
void CDashboard::DrawFrame(void)
  {
   this.m_canvas.Rectangle(0,0,this.m_w-1,this.m_h-1,::ColorToARGB(this.m_border_color,this.m_alpha));
   this.m_border_color_c=this.m_border_color;
   this.m_canvas.Update(false);
  }
Este encuadrará el perímetro del lienzo y recordará el color establecido como color actual.
Método que dibuja el botón de cierre del panel:
//+------------------------------------------------------------------+
//| Draws the panel close button                                     |
//+------------------------------------------------------------------+
void CDashboard::DrawButtonClose(void)
  {
//--- Exit if the button is not used
   if(!this.m_butt_close)
      return;
//--- The button width is equal to the height of the header area
   int w=this.m_header_h;
//--- Button coordinates and size
   int x1=this.m_w-w;
   int x2=this.m_w-1;
   int y1=0;
   int y2=w-1;
//--- Shift of the upper left corner of the rectangular area of the image from the upper left corner of the button
   int shift=4;
//--- Draw the button background
   this.m_canvas.FillRectangle(x1,y1,x2,y2,::ColorToARGB(this.m_butt_close_back_color,this.m_header_alpha));
//--- Draw the close button
   this.m_canvas.LineThick(x1+shift+1,y1+shift+1,x2-shift,y2-shift,::ColorToARGB(this.m_butt_close_fore_color,255),3,STYLE_SOLID,LINE_END_ROUND);
   this.m_canvas.LineThick(x1+shift+1,y2-shift-1,x2-shift,y1+shift,::ColorToARGB(this.m_butt_close_fore_color,255),3,STYLE_SOLID,LINE_END_ROUND);
//--- Remember the current background color and button design
   this.m_butt_close_back_color_c=this.m_butt_close_back_color;
   this.m_butt_close_fore_color_c=this.m_butt_close_fore_color;
//--- update the canvas without redrawing the screen
   this.m_canvas.Update(false);
  }
Toda la lógica se describirá en los comentarios al código: dibujaremos un fondo, y sobre el fondo, la imagen del icono de cierre (cruz).
Método que redibuja el botón de cierre del panel:
//+------------------------------------------------------------------+
//| Redraw the panel close button                                    |
//+------------------------------------------------------------------+
void CDashboard::RedrawButtonClose(const color new_back_color=clrNONE,const color new_fore_color=clrNONE,const ushort new_alpha=USHORT_MAX)
  {
//--- Exit if the button is not used or all passed parameters have default values
   if(!this.m_butt_close || (new_back_color==clrNONE && new_fore_color==clrNONE && new_alpha==USHORT_MAX))
      return;
//--- The button width is equal to the height of the header area
   int w=this.m_header_h;
//--- Button coordinates and size
   int x1=this.m_w-w;
   int x2=this.m_w-1;
   int y1=0;
   int y2=w-1;
//--- Shift of the upper left corner of the rectangular area of the image from the upper left corner of the button
   int shift=4;
//--- Define new background and text colors, and transparency
   color back_color=(new_back_color!=clrNONE ? new_back_color : this.m_butt_close_back_color);
   color fore_color=(new_fore_color!=clrNONE ? new_fore_color : this.m_butt_close_fore_color);
   uchar alpha=uchar(new_alpha==USHORT_MAX ? this.m_header_alpha : new_alpha>255 ? 255 : new_alpha);
//--- Draw the button background
   this.m_canvas.FillRectangle(x1,y1,x2,y2,::ColorToARGB(back_color,alpha));
//--- Draw the close button
   this.m_canvas.LineThick(x1+shift+1,y1+shift+1,x2-shift,y2-shift,::ColorToARGB(fore_color,255),3,STYLE_SOLID,LINE_END_ROUND);
   this.m_canvas.LineThick(x1+shift+1,y2-shift-1,x2-shift,y1+shift,::ColorToARGB(fore_color,255),3,STYLE_SOLID,LINE_END_ROUND);
//--- Remember the current background color and button design
   this.m_butt_close_back_color_c=back_color;
   this.m_butt_close_fore_color_c=fore_color;
//--- update the canvas without redrawing the screen
   this.m_canvas.Update(false);
  }
Para redibujar, al menos uno de los parámetros transmitidos deberá ser diferente del actual. El resto es idéntico al método de dibujado con botones, salvo la selección y la configuración de los nuevos parámetros de dibujado.
El resto de los métodos dibujarán y redibujarán los botones minimizar/desplegar y fijar:
//+------------------------------------------------------------------+
//| Draw the panel collapse/expand button                            |
//+------------------------------------------------------------------+
void CDashboard::DrawButtonMinimize(void)
  {
//--- Exit if the button is not used
   if(!this.m_butt_minimize)
      return;
//--- The button width is equal to the height of the header area
   int w=this.m_header_h;
//--- The width of the close button is zero if the button is not used
   int wc=(this.m_butt_close ? w : 0);
//--- Button coordinates and size
   int x1=this.m_w-wc-w;
   int x2=this.m_w-wc-1;
   int y1=0;
   int y2=w-1;
//--- Shift of the upper left corner of the rectangular area of the image from the upper left corner of the button
   int shift=4;
//--- Draw the button background
   this.m_canvas.FillRectangle(x1,y1,x2,y2,::ColorToARGB(this.m_butt_min_back_color,this.m_header_alpha));
//--- If the panel is collapsed, draw a rectangle
   if(this.m_minimized)
      this.m_canvas.Rectangle(x1+shift,y1+shift,x2-shift,y2-shift,::ColorToARGB(this.m_butt_min_fore_color,255));
//--- Otherwise, the panel is expanded. Draw a line segment
   else
      this.m_canvas.LineThick(x1+shift,y2-shift,x2-shift,y2-shift,::ColorToARGB(this.m_butt_min_fore_color,255),3,STYLE_SOLID,LINE_END_ROUND);
//--- Remember the current background color and button design
   this.m_butt_min_back_color_c=this.m_butt_min_back_color;
   this.m_butt_min_fore_color_c=this.m_butt_min_fore_color;
//--- update the canvas without redrawing the screen
   this.m_canvas.Update(false);
  }
//+------------------------------------------------------------------+
//| Redraw the panel collapse/expand button                          |
//+------------------------------------------------------------------+
void CDashboard::RedrawButtonMinimize(const color new_back_color=clrNONE,const color new_fore_color=clrNONE,const ushort new_alpha=USHORT_MAX)
  {
//--- Exit if the button is not used or all passed parameters have default values
   if(!this.m_butt_minimize || (new_back_color==clrNONE && new_fore_color==clrNONE && new_alpha==USHORT_MAX))
      return;
//--- The button width is equal to the height of the header area
   int w=this.m_header_h;
//--- The width of the close button is zero if the button is not used
   int wc=(this.m_butt_close ? w : 0);
//--- Button coordinates and size
   int x1=this.m_w-wc-w;
   int x2=this.m_w-wc-1;
   int y1=0;
   int y2=w-1;
//--- Shift of the upper left corner of the rectangular area of the image from the upper left corner of the button
   int shift=4;
//--- Define new background and text colors, and transparency
   color back_color=(new_back_color!=clrNONE ? new_back_color : this.m_butt_min_back_color);
   color fore_color=(new_fore_color!=clrNONE ? new_fore_color : this.m_butt_min_fore_color);
   uchar alpha=uchar(new_alpha==USHORT_MAX ? this.m_header_alpha : new_alpha>255 ? 255 : new_alpha);
//--- Draw the button background
   this.m_canvas.FillRectangle(x1,y1,x2,y2,::ColorToARGB(back_color,alpha));
//--- If the panel is collapsed, draw a rectangle
   if(this.m_minimized)
      this.m_canvas.Rectangle(x1+shift,y1+shift,x2-shift,y2-shift,::ColorToARGB(fore_color,255));
//--- Otherwise, the panel is expanded. Draw a line segment
   else
      this.m_canvas.LineThick(x1+shift,y2-shift,x2-shift,y2-shift,::ColorToARGB(fore_color,255),3,STYLE_SOLID,LINE_END_ROUND);
//--- Remember the current background color and button design
   this.m_butt_min_back_color_c=back_color;
   this.m_butt_min_fore_color_c=fore_color;
//--- update the canvas without redrawing the screen
   this.m_canvas.Update(false);
  }
//+------------------------------------------------------------------+
//| Draw the panel pin button                                        |
//+------------------------------------------------------------------+
void CDashboard::DrawButtonPin(void)
  {
//--- Exit if the button is not used
   if(!this.m_butt_pin)
      return;
//--- The button width is equal to the height of the header area
   int w=this.m_header_h;
//--- The width of the close and collapse buttons is zero if the button is not used
   int wc=(this.m_butt_close ? w : 0);
   int wm=(this.m_butt_minimize ? w : 0);
//--- Button coordinates and size
   int x1=this.m_w-wc-wm-w;
   int x2=this.m_w-wc-wm-1;
   int y1=0;
   int y2=w-1;
//--- Draw the button background
   this.m_canvas.FillRectangle(x1,y1,x2,y2,::ColorToARGB(this.m_butt_pin_back_color,this.m_header_alpha));
//--- Coordinates of the broken line points
   int x[]={x1+3, x1+6, x1+3,x1+4,x1+6,x1+9,x1+9,x1+10,x1+15,x1+14,x1+13,x1+10,x1+10,x1+9,x1+6};
   int y[]={y1+14,y1+11,y1+8,y1+7,y1+7,y1+4,y1+3,y1+2, y1+7, y1+8, y1+8, y1+11,y1+13,y1+14,y1+11};
//--- Draw the "button" shape
   this.m_canvas.Polygon(x,y,::ColorToARGB(this.m_butt_pin_fore_color,255));
//--- If the movability flag is reset (pinned) - cross out the drawn button
   if(!this.m_movable)
      this.m_canvas.Line(x1+3,y1+2,x1+15,y1+14,::ColorToARGB(this.m_butt_pin_fore_color,255));
//--- Remember the current background color and button design
   this.m_butt_pin_back_color_c=this.m_butt_pin_back_color;
   this.m_butt_pin_fore_color_c=this.m_butt_pin_fore_color;
//--- update the canvas without redrawing the screen
   this.m_canvas.Update(false);
  }
//+------------------------------------------------------------------+
//| Redraw the panel pin button                                      |
//+------------------------------------------------------------------+
void CDashboard::RedrawButtonPin(const color new_back_color=clrNONE,const color new_fore_color=clrNONE,const ushort new_alpha=USHORT_MAX)
  {
//--- Exit if the button is not used or all passed parameters have default values
   if(!this.m_butt_pin || (new_back_color==clrNONE && new_fore_color==clrNONE && new_alpha==USHORT_MAX))
      return;
//--- The button width is equal to the height of the header area
   int w=this.m_header_h;
//--- The width of the close and collapse buttons is zero if the button is not used
   int wc=(this.m_butt_close ? w : 0);
   int wm=(this.m_butt_minimize ? w : 0);
//--- Button coordinates and size
   int x1=this.m_w-wc-wm-w;
   int x2=this.m_w-wc-wm-1;
   int y1=0;
   int y2=w-1;
//--- Define new background and text colors, and transparency
   color back_color=(new_back_color!=clrNONE ? new_back_color : this.m_butt_pin_back_color);
   color fore_color=(new_fore_color!=clrNONE ? new_fore_color : this.m_butt_pin_fore_color);
   uchar alpha=uchar(new_alpha==USHORT_MAX ? this.m_header_alpha : new_alpha>255 ? 255 : new_alpha);
//--- Draw the button background
   this.m_canvas.FillRectangle(x1,y1,x2,y2,::ColorToARGB(back_color,alpha));
//--- Coordinates of the broken line points
   int x[]={x1+3, x1+6, x1+3,x1+4,x1+6,x1+9,x1+9,x1+10,x1+15,x1+14,x1+13,x1+10,x1+10,x1+9,x1+6};
   int y[]={y1+14,y1+11,y1+8,y1+7,y1+7,y1+4,y1+3,y1+2, y1+7, y1+8, y1+8, y1+11,y1+13,y1+14,y1+11};
//--- Draw the "button" shape
   this.m_canvas.Polygon(x,y,::ColorToARGB(this.m_butt_pin_fore_color,255));
//--- If the movability flag is reset (pinned) - cross out the drawn button
   if(!this.m_movable)
      this.m_canvas.Line(x1+3,y1+2,x1+15,y1+14,::ColorToARGB(this.m_butt_pin_fore_color,255));
//--- Remember the current background color and button design
   this.m_butt_pin_back_color_c=back_color;
   this.m_butt_pin_fore_color_c=fore_color;
//--- update the canvas without redrawing the screen
   this.m_canvas.Update(false);
  }
Los métodos son idénticos a los métodos de dibujado y redibujado del botón de cierre. La lógica es exactamente la misma, y la hemos explicado en los comentarios del código.
Método que dibuja un panel:
//+------------------------------------------------------------------+
//| Draw the panel                                                   |
//+------------------------------------------------------------------+
void CDashboard::Draw(const string title)
  {
//--- Set the title text
   this.m_title=title;
//--- If the collapse flag is not set, expand the panel
   if(!this.m_minimized)
      this.Expand();
//--- Otherwise, collapse the panel
   else
      this.Collapse();
//--- Update the canvas without redrawing the chart
   this.m_canvas.Update(false);
//--- Update the working space and redraw the chart
   this.m_workspace.Update();
  }
Si la bandera de minimización no está activada, desplegaremos el panel, es decir, lo dibujaremos de forma desplegada. Si la bandera de minimizado está activada, minimizaremos el panel, es decir, dibujaremos el panel minimizado, solo el encabezado.
Método que minimiza el panel:
//+------------------------------------------------------------------+
//| Collapse the panel                                               |
//+------------------------------------------------------------------+
void CDashboard::Collapse(void)
  {
//--- Save the pixels of the working space and the panel background into arrays
   this.SaveWorkspace();
   this.SaveBackground();
//--- Remember the current height of the panel
   int h=this.m_h;
//--- Change the dimensions (height) of the canvas and working space
   if(!this.SetSizes(this.m_canvas.Width(),this.m_header_h))
      return;
//--- Draw the header area
   this.DrawHeaderArea(this.m_title);
//--- Return the saved panel height to the variable
   this.m_h=h;
  }
Antes de minimizar el panel desde el estado desplegado, deberemos guardar todos los píxeles del fondo y del área de trabajo en arrays. Esto será necesario para desplegar rápidamente el panel, de forma que no tengamos que redibujarlo, sino simplemente reconstruir las imágenes del panel y del área de trabajo a partir de los arrays de píxeles. Además, se podría haber dibujado algo en el fondo del panel como decoración adicional, en este caso podría tratarse de una tabla. También se guardará junto con el fondo y, además, se restaurará.
Método que despliega el panel:
//+------------------------------------------------------------------+
//| Expand the panel                                                 |
//+------------------------------------------------------------------+
void CDashboard::Expand(void)
  {
//--- Resize the panel
   if(!this.SetSizes(this.m_canvas.Width(),this.m_h))
      return;
//--- If the panel background pixels have never been saved into an array
   if(this.m_array_ppx.Size()==0)
     {
      //--- Draw the panel and
      this.m_canvas.Erase(::ColorToARGB(this.m_back_color,this.m_alpha));
      this.DrawFrame();
      this.DrawHeaderArea(this.m_title);
      //--- save the background pixels of the panel and working space into arrays
      this.SaveWorkspace();
      this.SaveBackground();
     }
//--- If the background pixels of the panel and working space were previously saved,
   else
     {
      //--- restore the background pixels of the panel and working space from arrays
      this.RestoreBackground();
      if(this.m_array_wpx.Size()>0)
         this.RestoreWorkspace();
     }
//--- If, after expanding, the panel goes beyond the chart window, adjust the panel location
   if(this.m_y+this.m_canvas.Height()>this.m_chart_h-1)
      this.Move(this.m_x,this.m_chart_h-1-this.m_canvas.Height());
  }
Si los arrays en los que se almacenan los píxeles del fondo y del área de trabajo están vacíos, dibujaremos el panel al completo utilizando los métodos de dibujado. Si los arrays ya han sido rellenados, simplemente restauraremos el fondo del panel y su área de trabajo a partir de los arrays.
Métodos auxiliares para trabajar el color:
//+------------------------------------------------------------------+
//| Returns color with a new color component                         |
//+------------------------------------------------------------------+
color CDashboard::NewColor(color base_color, int shift_red, int shift_green, int shift_blue)
  {
   double clR=0, clG=0, clB=0;
   this.ColorToRGB(base_color,clR,clG,clB);
   double clRn=(clR+shift_red  < 0 ? 0 : clR+shift_red  > 255 ? 255 : clR+shift_red);
   double clGn=(clG+shift_green< 0 ? 0 : clG+shift_green> 255 ? 255 : clG+shift_green);
   double clBn=(clB+shift_blue < 0 ? 0 : clB+shift_blue > 255 ? 255 : clB+shift_blue);
   return this.RGBToColor(clRn,clGn,clBn);
  }
//+------------------------------------------------------------------+
//| Convert RGB to color                                             |
//+------------------------------------------------------------------+
color CDashboard::RGBToColor(const double r,const double g,const double b) const
  {
   int int_r=(int)::round(r);
   int int_g=(int)::round(g);
   int int_b=(int)::round(b);
   int clr=0;
   clr=int_b;
   clr<<=8;
   clr|=int_g;
   clr<<=8;
   clr|=int_r;
//---
   return (color)clr;
  }
//+------------------------------------------------------------------+
//| Getting values of the RGB components                             |
//+------------------------------------------------------------------+
void CDashboard::ColorToRGB(const color clr,double &r,double &g,double &b)
  {
   r=GetR(clr);
   g=GetG(clr);
   b=GetB(clr);
  }
Necesitaremos métodos para cambiar el color cuando el cursor interactúe con los controles del panel.
Método que establece la transparencia del encabezado:
//+------------------------------------------------------------------+
//| Set the header transparency                                      |
//+------------------------------------------------------------------+
void CDashboard::SetHeaderTransparency(const uchar value)
  {
   this.m_header_alpha=value;
   if(this.m_header_alpha_c!=this.m_header_alpha)
      this.RedrawHeaderArea(clrNONE,NULL,clrNONE,value);
   this.m_header_alpha_c=value;
  }
En primer lugar, el valor de transparencia transmitido al método se escribirá en una variable que almacena la transparencia por defecto y, a continuación, el nuevo valor se comparará con el valor actual. Si los valores no son iguales, el área de encabezado se redibujará completamente. Al final, la transparencia establecida se escribirá en la transparencia actual.
Método que fija la transparencia del panel:
//+------------------------------------------------------------------+
//| Set the panel transparency                                       |
//+------------------------------------------------------------------+
void CDashboard::SetTransparency(const uchar value)
  {
   this.m_alpha=value;
   if(this.m_alpha_c!=this.m_alpha)
     {
      this.m_canvas.Erase(::ColorToARGB(this.m_back_color,value));
      this.DrawFrame();
      this.RedrawHeaderArea(clrNONE,NULL,clrNONE,value);
      this.m_canvas.Update(false);
     }
   this.m_alpha_c=value;
  }
La lógica resulta similar al método comentado anteriormente. Si la transparencia transmitida al método no es igual a la transparencia actual, el panel se redibujará completamente con la nueva transparencia.
Método que establece la configuración de la fuente predeterminada del área de trabajo:
//+------------------------------------------------------------------+
//| Set the default font parameters of the working space             |
//+------------------------------------------------------------------+
void CDashboard::SetFontParams(const string name,const int size,const uint flags=0,const uint angle=0)
  {
   if(!this.m_workspace.FontSet(name,size*-10,flags,angle))
     {
      ::PrintFormat("%s: Failed to set font options. Error %lu",(string)__FUNCTION__,::GetLastError());
      return;
     }
   this.m_font=name;
   this.m_font_size=size*-10;
  }
Los parámetros de fuente (nombre de la fuente, su tamaño, banderas y ángulo) transmitidos al método se establecerán en el objeto CCanvas del área de trabajo y se almacenarán en variables.
El tamaño de fuente transmitido al método se multiplicará por -10 por la razón descrita en la nota de la función TextSetFont:
El tamaño de la fuente se establecerá usando valores positivos o negativos; el signo definirá la dependencia del tamaño del texto respecto a la configuración del sistema operativo (escala de fuentes).
- Si el tamaño se establece en un número positivo, al asignar una fuente lógica a una fuente física, el tamaño se convertirá a unidades del dispositivo físico (píxeles) y este tamaño se corresponderá con la altura de las celdas de los caracteres de las fuentes disponibles. No se recomienda en los casos en que se supone que se utilizan textos emitidos por la función TextOut() y textos visualizados con la ayuda del objeto gráfico OBJ_LABEL ("Etiqueta de texto") juntos en el gráfico.
- Si el tamaño se especifica como un número negativo, se supone que el tamaño especificado se indicará en décimas de punto lógico (un valor de -350 equivaldrá a 35 puntos lógicos) y se dividirá por 10, y luego el valor resultante se convertirá a unidades físicas del dispositivo (píxeles) y se corresponderá con el valor absoluto de la altura del carácter de las fuentes disponibles. Para obtener en pantalla el mismo tamaño de texto que en el objeto OBJ_LABEL, tomaremos el tamaño de fuente especificado en las propiedades del objeto y lo multiplicaremos por -10.
Método que activa/desactiva los modos de trabajo con el gráfico:
//+------------------------------------------------------------------+
//| Enable/disable modes of working with the chart                   |
//+------------------------------------------------------------------+
void CDashboard::SetChartsTool(const bool flag)
  {
//--- If the 'true' flag is passed and if chart scrolling is disabled
   if(flag && !::ChartGetInteger(this.m_chart_id,CHART_MOUSE_SCROLL))
     {
      //--- enable chart scrolling, right-click menu and crosshair
      ::ChartSetInteger(0,CHART_MOUSE_SCROLL,true);
      ::ChartSetInteger(0,CHART_CONTEXT_MENU,true);
      ::ChartSetInteger(0,CHART_CROSSHAIR_TOOL,true);
     }
//--- otherwise, if the 'false' flag is passed and if chart scrolling is enabled
   else if(!flag && ::ChartGetInteger(this.m_chart_id,CHART_MOUSE_SCROLL))
     {
      //--- disable chart scrolling, right-click menu and crosshair
      ::ChartSetInteger(0,CHART_MOUSE_SCROLL,false);
      ::ChartSetInteger(0,CHART_CONTEXT_MENU,false);
      ::ChartSetInteger(0,CHART_CROSSHAIR_TOOL,false);
     }
  }
Dependiendo de la bandera transmitida, el método comprobará el estado de desplazamiento del gráfico con el ratón y activará o desactivará todos los modos del gráfico. La comprobación del modo de desplazamiento será necesaria para evitar enviar constantemente un comando para ajustar los modos cuando el cursor está dentro o fuera de la ventana del panel. El cambio de modo solo tendrá lugar cuando el cursor entra en el panel o cuando el cursor salga del mismo.
Método que envía un mensaje de texto a las coordenadas especificadas:
//+------------------------------------------------------------------+
//| Display a text message at the specified coordinates              |
//+------------------------------------------------------------------+
void CDashboard::DrawText(const string text,const int x,const int y,const int width=WRONG_VALUE,const int height=WRONG_VALUE)
  {
//--- Declare variables to record the text width and height in them
   int w=width;
   int h=height;
//--- If the width and height of the text passed to the method have zero values,
//--- then the entire working space is completely cleared using the transparent color
   if(width==0 && height==0)
      this.m_workspace.Erase(0x00FFFFFF);
//--- Otherwise
   else
     {
      //--- If the passed width and height have default values (-1), we get its width and height from the text
      if(width==WRONG_VALUE && height==WRONG_VALUE)
         this.m_workspace.TextSize(text,w,h);
      //--- otherwise,
      else
        {
         //--- if the width passed to the method has the default value (-1) - get the width from the text, or
         //--- if the width passed to the method has a value greater than zero, use the width passed to the method, or
         //--- if the width passed to the method has a zero value, use the value 1 for the width
         w=(width ==WRONG_VALUE ? this.m_workspace.TextWidth(text)  : width>0  ? width  : 1);
         //--- if the height passed to the method has a default value (-1), get the height from the text, or
         //--- if the height passed to the method has a value greater than zero, use the height passed to the method, or
         //--- if the height passed to the method has a zero value, use value 1 for the height
         h=(height==WRONG_VALUE ? this.m_workspace.TextHeight(text) : height>0 ? height : 1);
        }
      //--- Fill the space according to the specified coordinates and the resulting width and height with a transparent color (erase the previous entry)
      this.m_workspace.FillRectangle(x,y,x+w,y+h,0x00FFFFFF);
     }
//--- Display the text to the space cleared of previous text and update the working space without redrawing the screen
   this.m_workspace.TextOut(x,y,text,::ColorToARGB(this.m_fore_color));
   this.m_workspace.Update(false);
  }
El trabajo con el lienzo en el caso de mostrar gráficos en él consistirá en dibujar dichos gráficos en el lienzo como lo hace un pintor con el pincel en un lienzo físico. Una imagen pintada sobre el lienzo se encontrará encima de otra pintada en primer lugar. Para sustituir una imagen, deberemos redibujar todo el lienzo o calcular las dimensiones de la imagen anterior, borrar esa zona y dibujar otra imagen en la zona borrada.
En el caso de los textos, podemos obtener las dimensiones del texto ya dibujado en el lienzo para borrar esa zona antes de mostrar el siguiente texto, pero almacenar todos los textos y figuras previamente dibujados en algún lugar del objeto no será lo ideal. Por ello, aquí deberemos elegir entre precisión y simplicidad con calidad. Aquí obtendremos las dimensiones del texto actual (que puede no tener la misma anchura que el texto dibujado anteriormente en ese lugar), y usaremos dichas dimensiones para borrar el texto dibujado anteriormente antes de mostrar el siguiente.
Si el texto transmitido no tiene la misma anchura que el texto actual, o es más grande, no se eliminará. Para estos casos, el método prevé la transmisión de parámetros que especifiquen las dimensiones requeridas de altura y anchura de la zona a borrar:
- Si los valores de anchura y altura transmitidos al método son -1 (por defecto), se eliminará un área igual a la anchura y altura del texto actual,
- Si transmitimos ceros, se borrará totalmente el área de trabajo al completo,
- Si transmitimos un valor de anchura o altura superior a cero, estos valores se utilizarán para la anchura y la altura respectivamente.
La clase de panel está diseñada para mostrar los datos en formato tabular. Para facilitar el cálculo de las coordenadas de los datos mostrados en el panel y el diseño visual del mismo, se ofrecen dos métodos que calcularán las coordenadas de las celdas de la tabla y dibujarán las tablas (de ser necesario) sobre el fondo del panel.
- El primer método calculará las coordenadas de las celdas de la tabla según los datos que se le hayan transmitido: las coordenadas X e Y iniciales de la tabla en el panel, el número de filas y columnas, la altura de las filas y la anchura de las columnas. También podemos especificar el color de las líneas de la cuadrícula de la tabla y la función de filas "alternas".
- El segundo método calculará automáticamente el tamaño de las filas y columnas en función de su número y de la anchura de separación de la tabla respecto a los bordes del panel. En él, también podemos especificar nuestro propio color para las líneas de la cuadrícula de la tabla y la función de filas "alternas".
Método que dibuja una cuadrícula de fondo según los parámetros dados:
//+------------------------------------------------------------------+
//| Draw the background grid                                         |
//+------------------------------------------------------------------+
void CDashboard::DrawGrid(const uint x,const uint y,const uint rows,const uint columns,const uint row_size,const uint col_size,
                          const color line_color=clrNONE,bool alternating_color=true)
  {
//--- If the panel is collapsed, leave
   if(this.m_minimized)
      return;
//--- Clear all lists of the tabular data object (remove cells from rows and all rows)
   this.m_table_data.Clear();
//--- Line height cannot be less than 2
   int row_h=int(row_size<2 ? 2 : row_size);
//--- Column width cannot be less than 2
   int col_w=int(col_size<2 ? 2 : col_size);

//--- The X1 (left) coordinate of the table cannot be less than 1 (to leave one pixel around the perimeter of the panel for the frame)
   int x1=int(x<1 ? 1 : x);
//--- Calculate the X2 coordinate (right) depending on the number of columns and their width
   int x2=x1+col_w*int(columns>0 ? columns : 1);
//--- The Y1 coordinate is located under the panel title area
   int y1=this.m_header_h+(int)y;
//--- Calculate the Y2 coordinate (bottom) depending on the number of lines and their height
   int y2=y1+row_h*int(rows>0 ? rows : 1);

//--- Get the color of the table grid lines, either by default or passed to the method
   color clr=(line_color==clrNONE ? C'200,200,200' : line_color);
//--- If the initial X coordinate is greater than 1, draw a table frame
//--- (in case of the coordinate 1, the table frame is the panel frame)
   if(x1>1)
      this.m_canvas.Rectangle(x1,y1,x2,y2,::ColorToARGB(clr,this.m_alpha));
//--- In the loop by table rows,
   for(int i=0;i<(int)rows;i++)
     {
      //--- calculate the Y coordinate of the next horizontal grid line (Y coordinate of the next table row)
      int row_y=y1+row_h*i;
      //--- if the flag of "alternating" line colors is passed and the line is even
      if(alternating_color && i%2==0)
        {
         //--- lighten the table background color and draw a background rectangle
         color new_color=this.NewColor(clr,45,45,45);
         this.m_canvas.FillRectangle(x1+1,row_y+1,x2-1,row_y+row_h-1,::ColorToARGB(new_color,this.m_alpha));
        }
      //--- Draw a table grid horizontal line
      this.m_canvas.Line(x1,row_y,x2,row_y,::ColorToARGB(clr,this.m_alpha));

      //--- Create a new table row object
      CTableRow *row_obj=new CTableRow(i);
      if(row_obj==NULL)
        {
         ::PrintFormat("%s: Failed to create table row object at index %lu",(string)__FUNCTION__,i);
         continue;
        }
      //--- Add it to the list of rows of the tabular data object
      //--- (if adding an object failed, delete the created object)
      if(!this.m_table_data.AddRow(row_obj))
         delete row_obj;
      //--- Set its Y coordinate in the created row object taking into account the offset from the panel title
      row_obj.SetY(row_y-this.m_header_h);
     }
//--- In the loop by table columns,
   for(int i=0;i<(int)columns;i++)
     {
      //--- calculate the X coordinate of the next vertical grid line (X coordinate of the next table row)
      int col_x=x1+col_w*i;
      //--- If the grid line goes beyond the panel, interrupt the loop
      if(x1==1 && col_x>=x1+m_canvas.Width()-2)
         break;
      //--- Draw a vertical line of the table grid
      this.m_canvas.Line(col_x,y1,col_x,y2,::ColorToARGB(clr,this.m_alpha));

      //--- Get the number of created rows from the table data object
      int total=this.m_table_data.RowsTotal();
      //--- In the loop by table rows
      for(int j=0;j<total;j++)
        {
         //--- get the next row
         CTableRow *row=m_table_data.GetRow(j);
         if(row==NULL)
            continue;
         //--- Create a new table cell
         CTableCell *cell=new CTableCell(row.Row(),i);
         if(cell==NULL)
           {
            ::PrintFormat("%s: Failed to create table cell object at index %lu",(string)__FUNCTION__,i);
            continue;
           }
         //--- Add the created cell to the row
         //--- (if adding an object failed, delete the created object)
         if(!row.AddCell(cell))
           {
            delete cell;
            continue;
           }
         //--- In the created cell object, set its X coordinate and the Y coordinate from the row object
         cell.SetXY(col_x,row.Y());
        }
     }
//--- Update the canvas without redrawing the chart
   this.m_canvas.Update(false);
  }
La lógica del método y la secuencia de dibujado de las tablas, así como la creación de su ejemplar en el objeto de datos de tabla se detallarán en el código en casi todas las líneas. Los datos que se escriben en el ejemplar de la tabla dibujada en el objeto de datos tabulares serán necesarios para obtener las coordenadas de cada celda, para que resulte cómodo especificar las coordenadas requeridas al mostrar los datos en el panel. Bastará con indicar el número de celda según su ubicación en la tabla (Row y Column) y obtener las coordenadas de la esquina superior izquierda de esta celda en el panel.
Método que dibuja una tabla de fondo con dimensionamiento automático de las celdas:
//+------------------------------------------------------------------+
//| Draws the background grid with automatic cell sizing             |
//+------------------------------------------------------------------+
void CDashboard::DrawGridAutoFill(const uint border,const uint rows,const uint columns,const color line_color=clrNONE,bool alternating_color=true)
  {
//--- If the panel is collapsed, leave
   if(this.m_minimized)
      return;
//--- X1 (left) table coordinate
   int x1=(int)border;
//--- X2 (right) table coordinate
   int x2=this.m_canvas.Width()-(int)border-1;
//--- Y1 (upper) table coordinate
   int y1=this.m_header_h+(int)border;
//--- Y2 (lower) table coordinate
   int y2=this.m_canvas.Height()-(int)border-1;

//--- Get the color of the table grid lines, either by default or passed to the method
   color clr=(line_color==clrNONE ? C'200,200,200' : line_color);
//--- If the offset from the edge of the panel is greater than zero, draw a table border,
//--- otherwise, the panel border is used as the table border
   if(border>0)
      this.m_canvas.Rectangle(x1,y1,x2,y2,::ColorToARGB(clr,this.m_alpha));

//--- Height of the entire table grid
   int greed_h=y2-y1;
//--- Calculate the row height depending on the table height and the number of rows
   int row_h=(int)::round((double)greed_h/(double)rows);
//--- In the loop based on the number of rows
   for(int i=0;i<(int)rows;i++)
     {
      //--- calculate the Y coordinate of the next horizontal grid line (Y coordinate of the next table row)
      int row_y=y1+row_h*i;
      //--- if the flag of "alternating" line colors is passed and the line is even
      if(alternating_color && i%2==0)
        {
         //--- lighten the table background color and draw a background rectangle
         color new_color=this.NewColor(clr,45,45,45);
         this.m_canvas.FillRectangle(x1+1,row_y+1,x2-1,row_y+row_h-1,::ColorToARGB(new_color,this.m_alpha));
        }
      //--- Draw a table grid horizontal line
      this.m_canvas.Line(x1,row_y,x2,row_y,::ColorToARGB(clr,this.m_alpha));

      //--- Create a new table row object
      CTableRow *row_obj=new CTableRow(i);
      if(row_obj==NULL)
        {
         ::PrintFormat("%s: Failed to create table row object at index %lu",(string)__FUNCTION__,i);
         continue;
        }
      //--- Add it to the list of rows of the tabular data object
      //--- (if adding an object failed, delete the created object)
      if(!this.m_table_data.AddRow(row_obj))
         delete row_obj;
      //--- Set its Y coordinate in the created row object taking into account the offset from the panel title
      row_obj.SetY(row_y-this.m_header_h);
     }

//--- Table grid width
   int greed_w=x2-x1;
//--- Calculate the column width depending on the table width and the number of columns
   int col_w=(int)::round((double)greed_w/(double)columns);
//--- In the loop by table columns,
   for(int i=0;i<(int)columns;i++)
     {
      //--- calculate the X coordinate of the next vertical grid line (X coordinate of the next table row)
      int col_x=x1+col_w*i;
      //--- If this is not the very first vertical line, draw it
      //--- (the first vertical line is either the table frame or the panel frame)
      if(i>0)
         this.m_canvas.Line(col_x,y1,col_x,y2,::ColorToARGB(clr,this.m_alpha));

      //--- Get the number of created rows from the table data object
      int total=this.m_table_data.RowsTotal();
      //--- In the loop by table rows
      for(int j=0;j<total;j++)
        {
         //--- get the next row
         CTableRow *row=this.m_table_data.GetRow(j);
         if(row==NULL)
            continue;
         //--- Create a new table cell
         CTableCell *cell=new CTableCell(row.Row(),i);
         if(cell==NULL)
           {
            ::PrintFormat("%s: Failed to create table cell object at index %lu",(string)__FUNCTION__,i);
            continue;
           }
         //--- Add the created cell to the row
         //--- (if adding an object failed, delete the created object)
         if(!row.AddCell(cell))
           {
            delete cell;
            continue;
           }
         //--- In the created cell object, set its X coordinate and the Y coordinate from the row object
         cell.SetXY(col_x,row.Y());
        }
     }
//--- Update the canvas without redrawing the chart
   this.m_canvas.Update(false);
  }
Este método se distinguirá del anterior únicamente en el cálculo automático de la anchura y la altura de la tabla según la separación de la tabla respecto al borde del panel, la altura de la fila (altura de la tabla/número de filas) y la anchura de la columna (anchura de la tabla/número de columnas). También lo hemos comentado al completo en el código.
Estas tablas deberán crearse (dibujarse en el panel) después de crear el panel y dibujarlo en el gráfico. De lo contrario, la tabla no se dibujará, pero los datos tabulares seguirán estando todos calculados y podrán usarse. Es decir, dibujar una tabla después de que el panel aparezca en el gráfico solo será necesario en los casos en que la tabla deba dibujarse en el panel.
Para restaurar rápidamente el fondo del panel y del área de trabajo, se ofrecen arrays en los que se copian los píxeles de la imagen del área de trabajo y del panel antes de, por ejemplo, minimizar el panel. Cuando se despliega el panel, en lugar de redibujar todo lo dibujado previamente en él, simplemente reconstruiremos el fondo del panel y el área de trabajo a partir de los arrays de píxeles. Esto resultará mucho más práctico que tener que memorizar en algún lugar todo lo que se ha dibujado en el lienzo, y con qué parámetros, para redibujarlo más tarde.
Existen dos métodos para el panel y el área de trabajo: para guardar una imagen en un array de píxeles y para restaurar una imagen desde un array de píxeles.
Método que almacena el área de trabajo en un array de píxeles:
//+------------------------------------------------------------------+
//| Save the working space to the array of pixels                    |
//+------------------------------------------------------------------+
void CDashboard::SaveWorkspace(void)
  {
//--- Calculate the required size of the array (width * height of the working space)
   uint size=this.m_workspace.Width()*this.m_workspace.Height();
//--- If the size of the array is not equal to the calculated one, change it
   if(this.m_array_wpx.Size()!=size)
     {
      ::ResetLastError();
      if(::ArrayResize(this.m_array_wpx,size)!=size)
        {
         ::PrintFormat("%s: ArrayResize failed. Error %lu",(string)__FUNCTION__,::GetLastError());
         return;
        }
     }
   uint n=0;
//--- In the loop along the height of the working space (pixel Y coordinate)
   for(int y=0;y<this.m_workspace.Height();y++)
      //--- in the loop by the working space width (pixel X coordinate)
      for(int x=0;x<this.m_workspace.Width();x++)
        {
         //--- calculate the pixel index in the receiving array
         n=this.m_workspace.Width()*y+x;
         if(n>this.m_array_wpx.Size()-1)
            break;
         //--- copy pixel to the receiving array from the working space X and Y
         this.m_array_wpx[n]=this.m_workspace.PixelGet(x,y);
        }
  }
En dos ciclos anidados, recorreremos cada píxel de cada línea de la imagen y los copiaremos en el array de destino.
Método que reconstruye el área de trabajo a partir de un array de píxeles:
//+------------------------------------------------------------------+
//| Restore the working space from the array of pixels               |
//+------------------------------------------------------------------+
void CDashboard::RestoreWorkspace(void)
  {
//--- Exit if the array is empty
   if(this.m_array_wpx.Size()==0)
      return;
   uint n=0;
//--- In the loop along the height of the working space (pixel Y coordinate)
   for(int y=0;y<this.m_workspace.Height();y++)
      //--- in the loop by the working space width (pixel X coordinate)
      for(int x=0;x<this.m_workspace.Width();x++)
        {
         //--- calculate the pixel index in the array
         n=this.m_workspace.Width()*y+x;
         if(n>this.m_array_wpx.Size()-1)
            break;
         //--- copy the pixel from the array to the X and Y coordinates of the working space
         this.m_workspace.PixelSet(x,y,this.m_array_wpx[n]);
        }
  }
En dos ciclos anidados, calcularemos el índice de cada píxel de cada línea de la imagen en el array y los copiaremos de el array a las coordenadas X e Y de la imagen.
Método que almacena el fondo del panel en un array de píxeles:
//+------------------------------------------------------------------+
//| Save the panel background to the pixel array                     |
//+------------------------------------------------------------------+
void CDashboard::SaveBackground(void)
  {
//--- Calculate the required size of the array (panel width * height)
   uint size=this.m_canvas.Width()*this.m_canvas.Height();
//--- If the size of the array is not equal to the calculated one, change it
   if(this.m_array_ppx.Size()!=size)
     {
      ::ResetLastError();
      if(::ArrayResize(this.m_array_ppx,size)!=size)
        {
         ::PrintFormat("%s: ArrayResize failed. Error %lu",(string)__FUNCTION__,::GetLastError());
         return;
        }
     }
   uint n=0;
//--- In the loop by the panel height (pixel Y coordinate)
   for(int y=0;y<this.m_canvas.Height();y++)
      //--- in the loop by the panel width (pixel X coordinate)
      for(int x=0;x<this.m_canvas.Width();x++)
        {
         //--- calculate the pixel index in the receiving array
         n=this.m_canvas.Width()*y+x;
         if(n>this.m_array_ppx.Size()-1)
            break;
         //--- copy pixel to the receiving array from the panel X and Y
         this.m_array_ppx[n]=this.m_canvas.PixelGet(x,y);
        }
  }
Método que reconstruye el fondo del panel a partir de un array de píxeles:
//+------------------------------------------------------------------+
//| Restore the panel background from the array of pixels            |
//+------------------------------------------------------------------+
void CDashboard::RestoreBackground(void)
  {
//--- Exit if the array is empty
   if(this.m_array_ppx.Size()==0)
      return;
   uint n=0;
//--- In the loop by the panel height (pixel Y coordinate)
   for(int y=0;y<this.m_canvas.Height();y++)
      //--- in the loop by the panel width (pixel X coordinate)
      for(int x=0;x<this.m_canvas.Width();x++)
        {
         //--- calculate the pixel index in the array
         n=this.m_canvas.Width()*y+x;
         if(n>this.m_array_ppx.Size()-1)
            break;
         //--- copy the pixel from the array to the X and Y coordinates of the panel
         this.m_canvas.PixelSet(x,y,this.m_array_ppx[n]);
        }
  }
Para traer un objeto al primer plano, deberemos realizar dos operaciones seguidas: ocultar el objeto y mostrarlo inmediatamente. Cada objeto gráfico tiene una propiedad OBJPROP_TIMEFRAMES responsable de su visibilidad en cada uno de los marcos temporales. Para ocultar un objeto en todos los marcos temporales, estableceremos esta propiedad en OBJ_NO_PERIODS. Como consecuencia, para mostrar el objeto, deberemos establecer la propiedad OBJPROP_TIMEFRAMES en OBJ_ALL_PERIODS.
Método que oculta el panel:
//+------------------------------------------------------------------+
//| Hide the panel                                                   |
//+------------------------------------------------------------------+
void CDashboard::Hide(const bool redraw=false)
  {
   ::ObjectSetInteger(this.m_chart_id,this.m_workspace.ChartObjectName(),OBJPROP_TIMEFRAMES,OBJ_NO_PERIODS);
   ::ObjectSetInteger(this.m_chart_id,this.m_canvas.ChartObjectName(),OBJPROP_TIMEFRAMES,OBJ_NO_PERIODS);
   if(redraw)
      ::ChartRedraw(this.m_chart_id);
  }
La propiedad OBJPROP_TIMEFRAMES de los objetos de panel y de área de trabajo se establecerá en OBJ_NO_PERIODS, y para mostrar inmediatamente los cambios, el gráfico se redibujará (si se establece la bandera correspondiente).
Método que representa el panel:
//+------------------------------------------------------------------+
//| Display the panel                                                |
//+------------------------------------------------------------------+
void CDashboard::Show(const bool redraw=false)
  {
   ::ObjectSetInteger(this.m_chart_id,this.m_canvas.ChartObjectName(),OBJPROP_TIMEFRAMES,OBJ_ALL_PERIODS);
   if(!this.m_minimized)
      ::ObjectSetInteger(this.m_chart_id,this.m_workspace.ChartObjectName(),OBJPROP_TIMEFRAMES,OBJ_ALL_PERIODS);
   if(redraw)
      ::ChartRedraw(this.m_chart_id);
  }
La propiedad OBJPROP_TIMEFRAMES se establecerá inmediatamente en OBJ_ALL_PERIODS para el objeto de panel. Y para el objeto de área de trabajo, el valor se establecerá solo cuando el panel se encuentre en el estado desplegado.
Si la bandera de redibujado está activada, el gráfico se redibujará para mostrar los cambios directamente.
Método que trae el panel al primer plano:
//+------------------------------------------------------------------+
//| Bring the panel to the foreground                                |
//+------------------------------------------------------------------+
void CDashboard::BringToTop(void)
  {
   this.Hide(false);
   this.Show(true);
  }
El panel y el área de trabajo se ocultarán primero sin redibujar el gráfico y, a continuación, se mostrarán inmediatamente y el gráfico se redibujará.
En algunos casos, cuando los arrays de píxeles no pueden almacenarse en la memoria, deberemos guardarlos en archivos y luego cargarlos desde allí. La clase tiene métodos preparados para guardar los arrays de píxeles en un archivo y cargarlos desde un archivo:
//+------------------------------------------------------------------+
//| Save the pixel array of the working space to a file              |
//+------------------------------------------------------------------+
bool CDashboard::FileSaveWorkspace(void)
  {
//--- Define the folder and file name
   string filename=this.m_program_name+"\\Dashboard"+(string)this.m_id+"\\workspace.bin";
//--- If the saved array is empty, inform of that and return 'false'
   if(this.m_array_wpx.Size()==0)
     {
      ::PrintFormat("%s: Error. The workspace pixel array is empty.",__FUNCTION__);
      return false;
     }
//--- If the array could not be saved to a file, report this and return 'false'
   if(!::FileSave(filename,this.m_array_wpx))
     {
      ::PrintFormat("%s: FileSave '%s' failed. Error %lu",__FUNCTION__,filename,::GetLastError());
      return false;
     }
//--- Successful, return 'true'
   return true;
  }
//+------------------------------------------------------------------+
//| Save the pixel array of the panel background to a file           |
//+------------------------------------------------------------------+
bool CDashboard::FileSaveBackground(void)
  {
//--- Define the folder and file name
   string filename=this.m_program_name+"\\Dashboard"+(string)this.m_id+"\\background.bin";
//--- If the saved array is empty, inform of that and return 'false'
   if(this.m_array_ppx.Size()==0)
     {
      ::PrintFormat("%s: Error. The background pixel array is empty.",__FUNCTION__);
      return false;
     }
//--- If the array could not be saved to a file, report this and return 'false'
   if(!::FileSave(filename,this.m_array_ppx))
     {
      ::PrintFormat("%s: FileSave '%s' failed. Error %lu",__FUNCTION__,filename,::GetLastError());
      return false;
     }
//--- Successful, return 'true'
   return true;
  }
//+------------------------------------------------------------------+
//| Upload the array of working space pixels from a file             |
//+------------------------------------------------------------------+
bool CDashboard::FileLoadWorkspace(void)
  {
//--- Define the folder and file name
   string filename=this.m_program_name+"\\Dashboard"+(string)this.m_id+"\\workspace.bin";
//--- If failed to upload data from the file into the array, report this and return 'false'
   if(::FileLoad(filename,this.m_array_wpx)==WRONG_VALUE)
     {
      ::PrintFormat("%s: FileLoad '%s' failed. Error %lu",__FUNCTION__,filename,::GetLastError());
      return false;
     }
//--- Successful, return 'true'
   return true;
  }
//+------------------------------------------------------------------+
//| Upload the array of panel background pixels from a file          |
//+------------------------------------------------------------------+
bool CDashboard::FileLoadBackground(void)
  {
//--- Define the folder and file name
   string filename=this.m_program_name+"\\Dashboard"+(string)this.m_id+"\\background.bin";
//--- If failed to upload data from the file into the array, report this and return 'false'
   if(::FileLoad(filename,this.m_array_ppx)==WRONG_VALUE)
     {
      ::PrintFormat("%s: FileLoad '%s' failed. Error %lu",__FUNCTION__,filename,::GetLastError());
      return false;
     }
//--- Successful, return 'true'
   return true;
  }
Por el momento no hemos implementado el trabajo con estos métodos, pues hemos descubierto que eran necesarios al redactar el presente artículo. En futuros artículos en los que se utilice la clase de panel informativo, es probable que estos métodos ya estén en uso.
Indicador con panel informativo
Para comprobar el funcionamiento del panel informativo, crearemos un sencillo indicador que dibuje una media móvil normal. El panel mostrará el Ask y Bid actual, así como los datos de la vela sobre la que se sitúe el cursor del ratón.
En la carpeta Indicators crearemos la nueva carpeta TestDashboard, y en ella crearemos un nuevo indicador personalizado:
A continuación, estableceremos los parámetros:

Luego elegiremos el primer tipo OnCalculate, OnChartEvent y OnTimer en caso de mejoras posteriores:
Después seleccionaremos el búfer que deseamos dibujar y clicaremos en "Listo":

Obtendremos una plantilla como esta:
//+------------------------------------------------------------------+
//|                                                TestDashboard.mq5 |
//|                                  Copyright 2023, MetaQuotes Ltd. |
//|                                             https://www.mql5.com |
//+------------------------------------------------------------------+
#property copyright "Copyright 2023, MetaQuotes Ltd."
#property link      "https://www.mql5.com"
#property version   "1.00"
#property indicator_chart_window
#property indicator_buffers 1
#property indicator_plots   1
//--- plot MA
#property indicator_label1  "MA"
#property indicator_type1   DRAW_LINE
#property indicator_color1  clrRed
#property indicator_style1  STYLE_SOLID
#property indicator_width1  1
//--- input parameters
input int      InpPeriodMA=10;
input int      InpMethodMA=0;
input int      InpPriceMA=0;
input int      InpPanelX=20;
input int      InpPanelY=20;
input int      InpUniqID=0;
//--- indicator buffers
double         MABuffer[];
//+------------------------------------------------------------------+
//| Custom indicator initialization function                         |
//+------------------------------------------------------------------+
int OnInit()
  {
//--- indicator buffers mapping
   SetIndexBuffer(0,MABuffer,INDICATOR_DATA);

//---
   return(INIT_SUCCEEDED);
  }
//+------------------------------------------------------------------+
//| Custom indicator iteration function                              |
//+------------------------------------------------------------------+
int OnCalculate(const int rates_total,
                const int prev_calculated,
                const datetime &time[],
                const double &open[],
                const double &high[],
                const double &low[],
                const double &close[],
                const long &tick_volume[],
                const long &volume[],
                const int &spread[])
  {
//---

//--- return value of prev_calculated for the next call
   return(rates_total);
  }
//+------------------------------------------------------------------+
//| Timer function                                                   |
//+------------------------------------------------------------------+
void OnTimer()
  {
//---

  }
//+------------------------------------------------------------------+
//| ChartEvent function                                              |
//+------------------------------------------------------------------+
void OnChartEvent(const int id,
                  const long &lparam,
                  const double &dparam,
                  const string &sparam)
  {
//---

  }
//+------------------------------------------------------------------+
Guarde el archivo de clase del objeto de panel en la carpeta del indicador creada, solo para asegurarse de que el archivo de inclusión de la clase de panel está en la misma carpeta que el indicador. Una vez finalizada la clase del panel, su versión definitiva podrá colocarse en la carpeta Include del sandbox de archivos del terminal comercial para utilizarla en sus propios programas.
Vamos a ajustar la plantilla de indicadores creada. Conectaremos la clase de objeto de panel, inicializaremos los parámetros de entrada con valores iniciales más claros, corregiremos el nombre del búfer a dibujar y declararemos las variables globales:
//+------------------------------------------------------------------+
//|                                                TestDashboard.mq5 |
//|                                  Copyright 2023, MetaQuotes Ltd. |
//|                                             https://www.mql5.com |
//+------------------------------------------------------------------+
#property copyright "Copyright 2023, MetaQuotes Ltd."
#property link      "https://www.mql5.com"
#property version   "1.00"
#property indicator_chart_window
#property indicator_buffers 1
#property indicator_plots   1
//--- plot MA
#property indicator_label1  "MA"
#property indicator_type1   DRAW_LINE
#property indicator_color1  clrRed
#property indicator_style1  STYLE_SOLID
#property indicator_width1  1
//--- includes
#include "Dashboard.mqh"
//--- input variables
input int                  InpPeriodMA =  10;            /* MA Period   */ // Moving average calculation period
input ENUM_MA_METHOD       InpMethodMA =  MODE_SMA;      /* MA Method   */ // Moving average calculation method
input ENUM_APPLIED_PRICE   InpPriceMA  =  PRICE_CLOSE;   /* MA Price    */ // Moving average calculation price
input int                  InpPanelX   =  20;            /* Dashboard X */ // Panel X coordinate
input int                  InpPanelY   =  20;            /* Dashboard Y */ // Panel Y coordinate
input int                  InpUniqID   =  0;             /* Unique ID   */ // Unique ID for the panel object
//--- indicator buffers
double         BufferMA[];
//--- global variables
CDashboard    *dashboard=NULL;
int            handle_ma;        // Moving Average indicator handle
int            period_ma;        // Moving Average calculation period
int            mouse_bar_index;  // Index of the bar the data is taken from
string         plot_label;       // Name of the graphical indicator series displayed in DataWindow
//+------------------------------------------------------------------+
//| Custom indicator initialization function                         |
//+------------------------------------------------------------------+
int OnInit()
  {
En el manejador OnInit(), crearemos un manejador del indicador estándar Moving Average, y estableceremos los parámetros del indicador y el búfer a dibujar. Como el cálculo del indicador se realizará desde el principio de la historia hasta el dato actual, configuraremos el búfer de indicador para que se indexe como en las series temporales. El objeto de panel informativo también se creará en el mismo manejador. Inmediatamente después de crear el objeto, lo mostraremos, y luego dibujaremos la cuadrícula de la tabla. A continuación, enviaremos los datos tabulares al diario de registro:
//+------------------------------------------------------------------+
//| Custom indicator initialization function                         |
//+------------------------------------------------------------------+
int OnInit()
  {
//--- indicator buffers mapping
   SetIndexBuffer(0,BufferMA,INDICATOR_DATA);

//--- Create indicator handle
   period_ma=(InpPeriodMA<1 ? 1 : InpPeriodMA);
   ResetLastError();
   handle_ma=iMA(Symbol(),PERIOD_CURRENT,period_ma,0,InpMethodMA,InpPriceMA);
   if(handle_ma==INVALID_HANDLE)
     {
      PrintFormat("%s Failed to create MA indicator handle. Error %lu",__FUNCTION__,GetLastError());
      return INIT_FAILED;
     }
//--- Set the indicator parameters
   IndicatorSetInteger(INDICATOR_DIGITS,Digits());
   IndicatorSetString(INDICATOR_SHORTNAME,"Test Dashboard");
//--- Set the parameters of the buffer being drawn
   plot_label="MA("+(string)period_ma+","+StringSubstr(EnumToString(Period()),7)+")";
   PlotIndexSetString(0,PLOT_LABEL,plot_label);
   ArraySetAsSeries(BufferMA,true);

//--- Create the panel object
   dashboard=new CDashboard(InpUniqID,InpPanelX,InpPanelY,200,250);
   if(dashboard==NULL)
     {
      Print("Error. Failed to create dashboard object");
      return INIT_FAILED;
     }
//--- Display the panel with the "Symbol, Timeframe description" header text
   dashboard.View(Symbol()+", "+StringSubstr(EnumToString(Period()),7));
//--- Draw the name plate on the panel background
   dashboard.DrawGridAutoFill(2,12,2);
   //dashboard.DrawGrid(2,1,12,2,19,97);
//--- Display tabular data in the journal
   dashboard.GridPrint(2);
//--- Initialize the variable with the index of the mouse cursor bar
   mouse_bar_index=0;
//--- Successful initialization
   return(INIT_SUCCEEDED);
  }
Toda la lógica está comentada en el código. La tabla se creará con el cálculo automático del tamaño de las filas y columnas. La creación de las tablas simple se comentará en el código. Podrá intercambiar los lugares: comentar la tabla automática y descomentar la simple y recompilar el indicador. La diferencia será bastante pequeña con estos parámetros de la tabla.
En el manejador OnDeinit(), eliminaremos el panel, liberaremos el manejador del indicador y borraremos los comentarios en el gráfico:
//+------------------------------------------------------------------+
//| Custom indicator deinitialization function                       |
//+------------------------------------------------------------------+
void OnDeinit(const int reason)
  {
//--- If the panel object exists, delete it
   if(dashboard!=NULL)
      delete dashboard;
//--- Release the handle of the MA indicator
   ResetLastError();
   if(!IndicatorRelease(handle_ma))
      PrintFormat("%s: IndicatorRelease failed. Error %ld",__FUNCTION__,GetLastError());
//--- Delete all comments
   Comment("");
  }
En el manejador OnCalculate() haremos todos los arrays de series temporales predefinidos con la indexación como en las series temporales, para que coincidan con la indexación del búfer que se está dibujando. Todo lo demás se comentará en el código del manejador:
//+------------------------------------------------------------------+
//| Custom indicator iteration function                              |
//+------------------------------------------------------------------+
int OnCalculate(const int rates_total,
                const int prev_calculated,
                const datetime &time[],
                const double &open[],
                const double &high[],
                const double &low[],
                const double &close[],
                const long &tick_volume[],
                const long &volume[],
                const int &spread[])
  {
//--- Set indexing for the arrays as in a timeseries
   ArraySetAsSeries(time,true);
   ArraySetAsSeries(open,true);
   ArraySetAsSeries(high,true);
   ArraySetAsSeries(low,true);
   ArraySetAsSeries(close,true);
   ArraySetAsSeries(tick_volume,true);
   ArraySetAsSeries(volume,true);
   ArraySetAsSeries(spread,true);

//--- Check for the minimum number of bars for calculation
   if(rates_total<period_ma) return 0;

//--- Check and calculate the number of calculated bars
   int limit=rates_total-prev_calculated;
//--- If 'limit' is 0, then only the current bar is calculated
//--- If 'limit' is 1 (opening a new bar), then two bars are calculated - the current newly opened one and the previous one
//--- If 'limit' is more than 1, then this is either the first launch of the indicator, or some changes in history - the indicator is completely recalculated
   if(limit>1)
     {
      limit=rates_total-period_ma-1;
      ArrayInitialize(BufferMA,EMPTY_VALUE);
     }

//--- Calculate the amount of data copied from the indicator handle to the drawing buffer
   int count=(limit>1 ? rates_total : 1),copied=0;
//--- Prepare data (receive data to the moving average buffer by handle)
   copied=CopyBuffer(handle_ma,0,0,count,BufferMA);
   if(copied!=count) return 0;

//--- Loop of indicator calculation based on the moving average data
   for(int i=limit; i>=0 && !IsStopped(); i--)
     {
      // Here we calculate a certain indicator based on the standard Moving Average data
     }

//--- Receive price and timeseries data and display it on the panel
//--- At the first launch, we display the data of the current bar on the panel
   static bool first=true;
   if(first)
     {
      DrawData(0,TimeCurrent());
      first=false;
     }

//--- Declare the price structure and get the current prices
   MqlTick  tick={0};
   if(!SymbolInfoTick(Symbol(),tick))
      return 0;

//--- If the cursor is on the current bar, display the data of the current bar on the panel
   if(mouse_bar_index==0)
      DrawData(0,time[0]);
//--- Otherwise, display only the Bid and Ask prices on the panel (we update the prices on the panel at each tick)
   else
     {
      dashboard.DrawText("Bid",dashboard.CellX(0,0)+2,dashboard.CellY(0,0)+2); dashboard.DrawText(DoubleToString(tick.bid,Digits()),dashboard.CellX(0,1)+2,dashboard.CellY(0,1)+2,90);
      dashboard.DrawText("Ask",dashboard.CellX(1,0)+2,dashboard.CellY(1,0)+2); dashboard.DrawText(DoubleToString(tick.ask,Digits()),dashboard.CellX(1,1)+2,dashboard.CellY(1,1)+2,90);
     }

//--- return value of prev_calculated for the next call
   return(rates_total);
  }
En el manejador OnChartEvent() del indicador, primero llamaremos al manejador OnChartEvent del panel, y luego procesaremos los eventos necesarios:
//+------------------------------------------------------------------+
//| ChartEvent function                                              |
//+------------------------------------------------------------------+
void OnChartEvent(const int id,
                  const long &lparam,
                  const double &dparam,
                  const string &sparam)
  {
//--- Call the panel event handler
   dashboard.OnChartEvent(id,lparam,dparam,sparam);

//--- If the cursor moves or a click is made on the chart
   if(id==CHARTEVENT_MOUSE_MOVE || id==CHARTEVENT_CLICK)
     {
      //--- Declare the variables to record time and price coordinates in them
      datetime time=0;
      double price=0;
      int wnd=0;
      //--- If the cursor coordinates are converted to date and time
      if(ChartXYToTimePrice(ChartID(),(int)lparam,(int)dparam,wnd,time,price))
        {
         //--- write the bar index where the cursor is located to a global variable
         mouse_bar_index=iBarShift(Symbol(),PERIOD_CURRENT,time);
         //--- Display the bar data under the cursor on the panel
         DrawData(mouse_bar_index,time);
        }
     }

//--- If we received a custom event, display the appropriate message in the journal
   if(id>CHARTEVENT_CUSTOM)
     {
      //--- Here we can implement handling a click on the close button on the panel
      PrintFormat("%s: Event id=%ld, object id (lparam): %lu, event message (sparam): %s",__FUNCTION__,id,lparam,sparam);
     }
  }
Aquí, al obtener el evento de pulsación del botón de cierre desde el panel, y si fuera necesario reaccionar a tal evento, deberemos escribir su procesamiento. La decisión sobre el comportamiento del programa para este evento corresponderá al desarrollador del programa.
Función que muestra el precio actual y los datos de la barra según el índice:
//+------------------------------------------------------------------+
//| Display data from the specified timeseries index to the panel    |
//+------------------------------------------------------------------+
void DrawData(const int index,const datetime time)
  {
//--- Declare the variables to receive data in them
   MqlTick  tick={0};
   MqlRates rates[1];
//--- Exit if unable to get the current prices
   if(!SymbolInfoTick(Symbol(),tick))
      return;
//--- Exit if unable to get the bar data by the specified index
   if(CopyRates(Symbol(),PERIOD_CURRENT,index,1,rates)!=1)
      return;
//--- Display the current prices and data of the specified bar on the panel
   dashboard.DrawText("Bid",        dashboard.CellX(0,0)+2,   dashboard.CellY(0,0)+2);  dashboard.DrawText(DoubleToString(tick.bid,Digits()),       dashboard.CellX(0,1)+2,   dashboard.CellY(0,1)+2,90);
   dashboard.DrawText("Ask",        dashboard.CellX(1,0)+2,   dashboard.CellY(1,0)+2);  dashboard.DrawText(DoubleToString(tick.ask,Digits()),       dashboard.CellX(1,1)+2,   dashboard.CellY(1,1)+2,90);
   dashboard.DrawText("Date",       dashboard.CellX(2,0)+2,   dashboard.CellY(2,0)+2);  dashboard.DrawText(TimeToString(rates[0].time,TIME_DATE),   dashboard.CellX(2,1)+2,   dashboard.CellY(2,1)+2,90);
   dashboard.DrawText("Time",       dashboard.CellX(3,0)+2,   dashboard.CellY(3,0)+2);  dashboard.DrawText(TimeToString(rates[0].time,TIME_MINUTES),dashboard.CellX(3,1)+2,   dashboard.CellY(3,1)+2,90);

   dashboard.DrawText("Open",       dashboard.CellX(4,0)+2,   dashboard.CellY(4,0)+2);  dashboard.DrawText(DoubleToString(rates[0].open,Digits()),  dashboard.CellX(4,1)+2,   dashboard.CellY(4,1)+2,90);
   dashboard.DrawText("High",       dashboard.CellX(5,0)+2,   dashboard.CellY(5,0)+2);  dashboard.DrawText(DoubleToString(rates[0].high,Digits()),  dashboard.CellX(5,1)+2,   dashboard.CellY(5,1)+2,90);
   dashboard.DrawText("Low",        dashboard.CellX(6,0)+2,   dashboard.CellY(6,0)+2);  dashboard.DrawText(DoubleToString(rates[0].low,Digits()),   dashboard.CellX(6,1)+2,   dashboard.CellY(6,1)+2,90);
   dashboard.DrawText("Close",      dashboard.CellX(7,0)+2,   dashboard.CellY(7,0)+2);  dashboard.DrawText(DoubleToString(rates[0].close,Digits()), dashboard.CellX(7,1)+2,   dashboard.CellY(7,1)+2,90);

   dashboard.DrawText("Volume",     dashboard.CellX(8,0)+2,   dashboard.CellY(8,0)+2);  dashboard.DrawText((string)rates[0].real_volume,            dashboard.CellX(8,1)+2,   dashboard.CellY(8,1)+2,90);
   dashboard.DrawText("Tick Volume",dashboard.CellX(9,0)+2,   dashboard.CellY(9,0)+2);  dashboard.DrawText((string)rates[0].tick_volume,            dashboard.CellX(9,1)+2,   dashboard.CellY(9,1)+2,90);
   dashboard.DrawText("Spread",     dashboard.CellX(10,0)+2,  dashboard.CellY(10,0)+2); dashboard.DrawText((string)rates[0].spread,                 dashboard.CellX(10,1)+2,  dashboard.CellY(10,1)+2,90);
   dashboard.DrawText(plot_label,   dashboard.CellX(11,0)+2,  dashboard.CellY(11,0)+2); dashboard.DrawText(DoubleToString(BufferMA[index],Digits()),dashboard.CellX(11,1)+2,  dashboard.CellY(11,1)+2,90);
//--- Redraw the chart to immediately display all changes on the panel
   ChartRedraw(ChartID());
  }
Si prestamos atención al método DrawText de la clase panel
void CDashboard::DrawText(const string text,const int x,const int y,const int width=WRONG_VALUE,const int height=WRONG_VALUE)
veremos que después del texto se transmiten al método las coordenadas X e Y. Esto será lo que obtendremos de los datos tabulares, especificando la ubicación de la celda de la tabla según su número de fila y columna.
Por ejemplo, los precios Bid y Ask se mostrarán en el panel en la "dirección" de las celdas de la tabla para Bid 0,0 (texto "Bid") y 0,1 (valor del precio Bid):
dashboard.DrawText("Bid", dashboard.CellX(0,0)+2, dashboard.CellY(0,0)+2); dashboard.DrawText(DoubleToString(tick.bid,Digits()), dashboard.CellX(0,1)+2, dashboard.CellY(0,1)+2,90);
Aquí se tomarán los valores de las celdas
para el texto "Bid":
- CellX(0,0) - la celda en la fila cero y la columna cero será el valor de la coordenada X,
- CeldaY0,0) - la celda en la fila cero y columna cero será el valor de la coordenada Y.
para el valor del precio Bid:
- CellX(0,1) - la celda en la fila cero y la primera columna será el valor de la coordenada X,
- CeldaY0,1) - la celda en la fila cero y la primera columna será el valor de la coordenada Y.
El valor 90 para la anchura del texto mostrado en la segunda celda precisamente será el caso en que el texto actual puede ser menos ancho que el texto anterior, por lo que el texto anterior no se borrará completamente y los dos textos se superpondrán. Así que aquí indicaremos explícitamente la anchura del rótulo mostrado, lo cual borrará al 100% el texto dibujado anteriormente, pero sin borrar los datos adyacentes, ya que el campo de tabla donde se escribe el texto es de una anchura superior a 90 píxeles.
Así, para cada celda de la tabla podremos obtener sus coordenadas en el panel y mostrar el texto en ellas. Como las coordenadas se especifican para los puntos de intersección de las líneas de la cuadrícula de la tabla, añadiremos dos píxeles X e Y a las coordenadas para alinear el texto dentro de las celdas de la tabla.
Tras compilar el indicador y ejecutarlo en el gráfico, los datos de la tabla creada y dibujada en el panel se mostrarán en el registro:
Table: Rows: 12, Columns: 2
  Row   0    Column   0      Cell X:  2      Cell Y:  2
  Row   0    Column   1      Cell X:  100    Cell Y:  2
  Row   1    Column   0      Cell X:  2      Cell Y:  21
  Row   1    Column   1      Cell X:  100    Cell Y:  21
  Row   2    Column   0      Cell X:  2      Cell Y:  40
  Row   2    Column   1      Cell X:  100    Cell Y:  40
  Row   3    Column   0      Cell X:  2      Cell Y:  59
  Row   3    Column   1      Cell X:  100    Cell Y:  59
  Row   4    Column   0      Cell X:  2      Cell Y:  78
  Row   4    Column   1      Cell X:  100    Cell Y:  78
  Row   5    Column   0      Cell X:  2      Cell Y:  97
  Row   5    Column   1      Cell X:  100    Cell Y:  97
  Row   6    Column   0      Cell X:  2      Cell Y:  116
  Row   6    Column   1      Cell X:  100    Cell Y:  116
  Row   7    Column   0      Cell X:  2      Cell Y:  135
  Row   7    Column   1      Cell X:  100    Cell Y:  135
  Row   8    Column   0      Cell X:  2      Cell Y:  154
  Row   8    Column   1      Cell X:  100    Cell Y:  154
  Row   9    Column   0      Cell X:  2      Cell Y:  173
  Row   9    Column   1      Cell X:  100    Cell Y:  173
  Row   10   Column   0      Cell X:  2      Cell Y:  192
  Row   10   Column   1      Cell X:  100    Cell Y:  192
  Row   11   Column   0      Cell X:  2      Cell Y:  211
  Row   11   Column   1      Cell X:  100    Cell Y:  211
Si ejecutamos dos indicadores con un panel en el mismo gráfico, especificando valores diferentes del identificador único del panel, estos funcionarán independientemente el uno del otro:
Aquí podemos ver que aunque los paneles funcionan por separado (uno para cada indicador), estos tienen un conflicto: al desplazar los paneles, el gráfico también intentará moverse. La razón es que un panel, el que movemos, desactivará el movimiento del gráfico, mientras que el segundo panel, al ver que el cursor está fuera de él, lo activará.
Para evitar este comportamiento, lo más sencillo que podemos hacer es crear en las variables globales del terminal un semáforo donde se escribirá el identificador del panel activo. Los demás, al ver ahí un ID que no es el suyo, no intentarán gestionar el gráfico.
Si ejecutamos el indicador en el modo visual del simulador e intentamos mover el panel, este se desplazará por la pantalla con cierta dificultad. Al mismo tiempo, lo cual resulta muy útil, podremos obtener los datos de las barras del gráfico que se está probando: si clicamos en una barra, sus datos se mostrarán en el panel. Asimismo, el botón derecho del ratón (manteniéndolo pulsado y moviendo el cursor sobre el gráfico) ayudará a indicar el panel donde está ahora el cursor y mostrar los datos, o bien servirá para coger el panel por la zona de el encabezado y moverlo al lugar deseado. Lamentablemente, en el modo visual del simulador, tenemos que recurrir a este tipo de trucos debido a que no hemos implementado al completo el manejo de eventos.
Conclusión
Hoy hemos creado un pequeño panel que puede convertirse en un asistente a la hora de desarrollar nuestras propias estrategias utilizando indicadores; además, en los próximos artículos consideraremos la conexión de los indicadores y el trabajo con sus datos en asesores para todos los indicadores estándar.
Traducción del ruso hecha por MetaQuotes Ltd.
Artículo original: https://www.mql5.com/ru/articles/13179
Advertencia: todos los derechos de estos materiales pertenecen a MetaQuotes Ltd. Queda totalmente prohibido el copiado total o parcial.
Este artículo ha sido escrito por un usuario del sitio web y refleja su punto de vista personal. MetaQuotes Ltd. no se responsabiliza de la exactitud de la información ofrecida, ni de las posibles consecuencias del uso de las soluciones, estrategias o recomendaciones descritas.

- Aplicaciones de trading gratuitas
- 8 000+ señales para copiar
- Noticias económicas para analizar los mercados financieros
Usted acepta la política del sitio web y las condiciones de uso
Artem, tengo una pregunta. En el método void CDashboard::Move(int x, int y) existe tal cosa:
En concreto, me interesa este bloque. Es decir, si la altura del panel es menor que la ventana del gráfico, y si su punto Y (esquina superior izquierda) es menor que la diferencia entre la altura de la ventana y la altura del panel, corregida en 2 píxeles, entonces al punto superior del panel se le asignará el valor de esta diferencia. ¿Por qué es así, a qué se debe?
En resumen, es debido al método CDashboard::Move(int x, int y) que se produce el atasco. Cuando se intenta mover el panel después de cambiar el tamaño del gráfico, éste corrige constantemente las coordenadas y no permite mover la ventana del panel libremente...
Mover(int x, int y)
Hay un error en alguna parte. Necesitas imprimir (o mirar en el depurador, pero a menudo no funciona) los valores de coordenadas y tamaño.
Aquí está la lógica en los comentarios:
Al intentar mover el panel después de cambiar el tamaño del gráfico, corrige constantemente las coordenadas y no deja mover la ventana del panel libremente...
Lo más probable es que el valor de la variable this.m_higher_wnd no sea relevante en el método Move(). Estos valores se establecen en el manejador de eventos:
Es muy posible que en algún lugar de aquí no se establezcan correctamente las banderas de sobredimensionamiento cuando se expande la ventana del gráfico.
Si escribe estas líneas
al principio del método Move() - para forzar el establecimiento de los valores correctos en cada movimiento del ratón, ¿desaparecerá el error? Si lo hace, significa que el asunto está en los valores de estas variables, y que necesitas mirar en el manejador de eventos para ver por qué no obtienen sus valores cuando se expande la ventana. Bien, si todo es normal allí, entonces necesitas imprimir el método Move() para encontrar el error.
El error ha desaparecido. He hecho estos cambios en el método CDashboard::OnChartEvent():
Para no cargar constantemente el método CDashboard:: Move(), he añadido la comprobación de banderas de sobredimensionamiento en aquellos bloques en los que se modifica directamente la anchura y altura de la ventana del gráfico.
El error ha desaparecido. En el método CDashboard::OnChartEvent() he hecho estos cambios:
Para no cargar constantemente el método CDashboard:: Move(), he añadido la comprobación de banderas de sobredimensionamiento en aquellos bloques en los que se modifica directamente la anchura y altura de la ventana del gráfico.