Mean Volume indicator for MT5
- Indicators
-
Renaud Herve Francois Candel
 ITC SOFTWARE is a technology company based in the United States since 2010.
🟠🔴 The company develops financial software and indicators for different trading platforms:
-Metatrader 4 and Metatrader 5
-TradingView
-NinjaTrader - Version: 1.30
- Updated: 4 July 2023
- Activations: 5
Mean Volume
Most indicators are based on price analysis.
This indicator is based on volume. Volume is overlooked piece of information in most trading systems.
And this is a big mistake since volume gives important information about market participants.
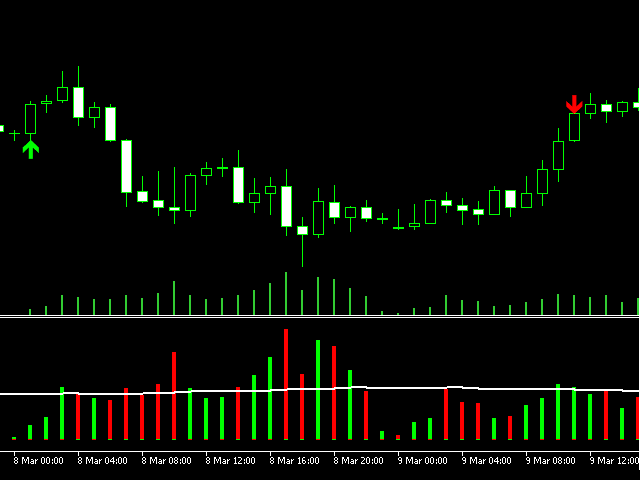
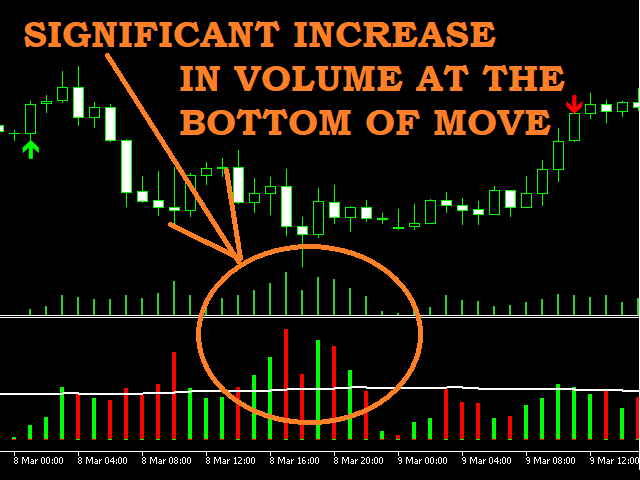
Mean Volume is an indicator that can be used to spot when volume is above average.
It usually means that institutional traders are active.
Peak in volume can be used to confirm an entry since increased volume can sustain the move in one or another direction.
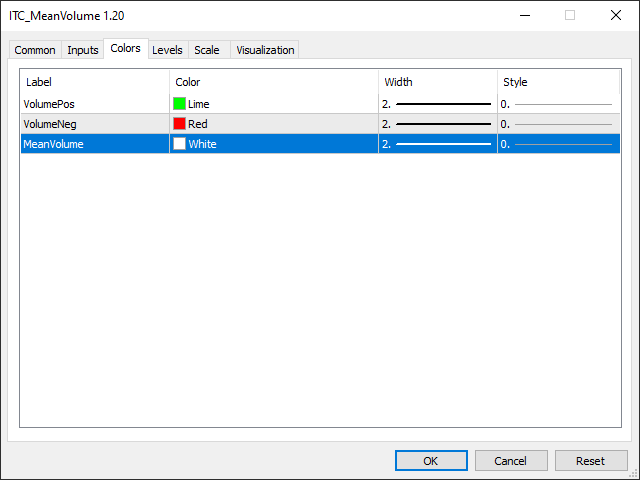
The indicator code volume with colors indicating bullish and bearish move in the price action.
You could enhance dramatically your trading system using volume analysis.
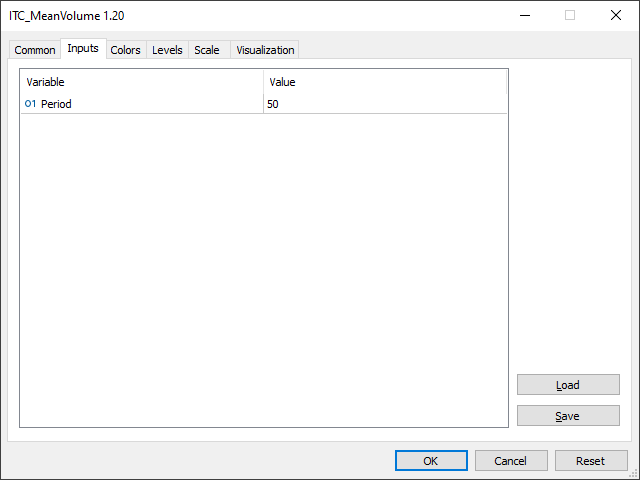
Inputs of the indicator are:
- Period: period to be used to calculate normalized volume
Trading requires an edge over the market. Volume could be your edge over other participants who do not use volume.
The indicator can be used with any time frame.
The indicator can be used with any class of assets: Forex, Stocks, Indices, Futures, Commodities, and Cryptos.
Other indicators for MT4:
We developed more than 60 indicators and utilities for Metatrader 4 and Metatrader 5.
Indicators for MT5:
All our indicator are developed both for MT4 and MT5.
List of all our indicators:
You can get the complete list of our indicators visiting our profile page.