• Übersicht
  • Bewertungen (1)
  • Diskussion (4)
  • Neue Funktionen

TheStrat Monitor MT5

5

Wenn Sie die Handelsstrategie von The Strat noch nicht kennen, googeln Sie sie jetzt. Ich verspreche, es wird keine Zeitverschwendung sein, und Sie werden wahrscheinlich einige neue Tricks lernen, ob Sie es verwenden oder nicht.

OK, jetzt, da Sie wissen, was TheStrat ist, können Sie verstehen, was dieser Indikator für Sie tun kann.

Hauptmerkmale

Kurz gesagt, der Indikator wird:

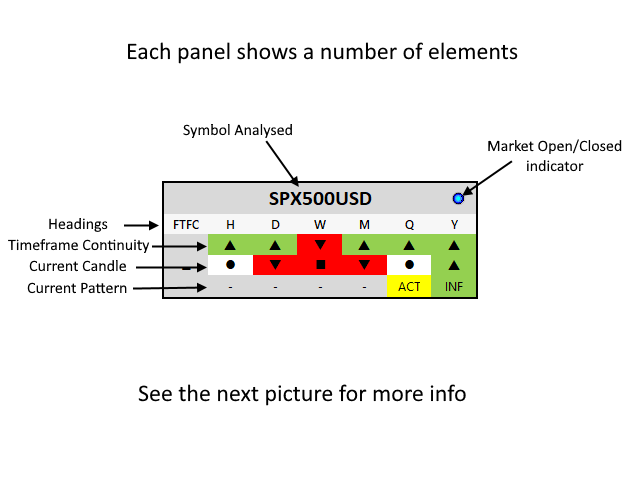
  • Zeitrahmenkontinuität für alle unterstützten Zeitrahmen anzeigen
  • Unterstützt zwei Timeset-Ansichten, Daytrader und Swingtrader
  • Zeigen Sie an, wann die vollständige Zeitrahmenkontinuität für 4 aufeinanderfolgende Zeitrahmen vorhanden ist
  • Zeigen Sie den aktuellen Kerzenstatus für jeden Zeitrahmen an
  • Zeigen Sie das aktuelle Muster, falls vorhanden, in allen Zeiträumen an
  • Zeigt sowohl gültige als auch umsetzbare Muster an
  • Aktualisierung alle 5 Sekunden (konfigurierbar ab 1 Sekunde)
  • Ermöglicht Ihnen, auf das Feld zu klicken, um einen Chart für das ausgewählte Symbol und den ausgewählten Zeitrahmen zu öffnen
  • Sie können auswählen, welche Diagrammvorlage zum Öffnen von Diagrammen verwendet wird
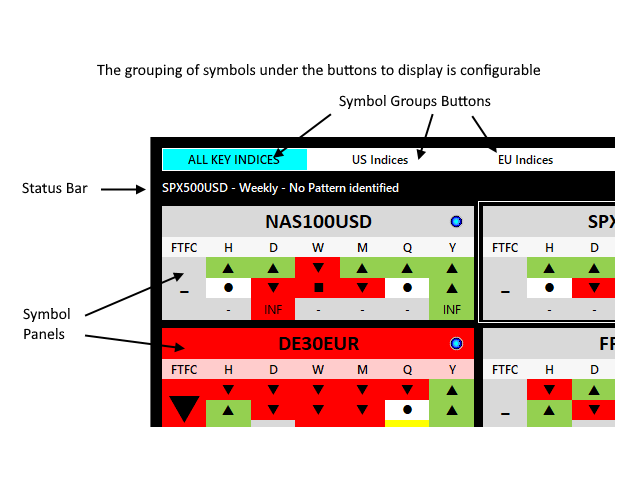
  • Sie wählen aus, welche Gruppen und Symbole in diesen Gruppen angezeigt werden sollen

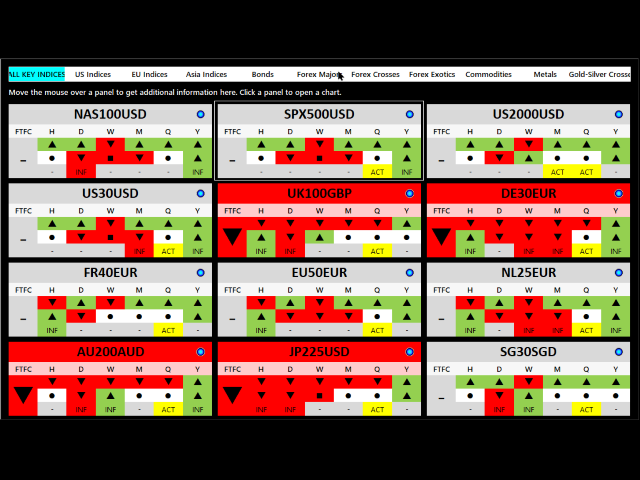
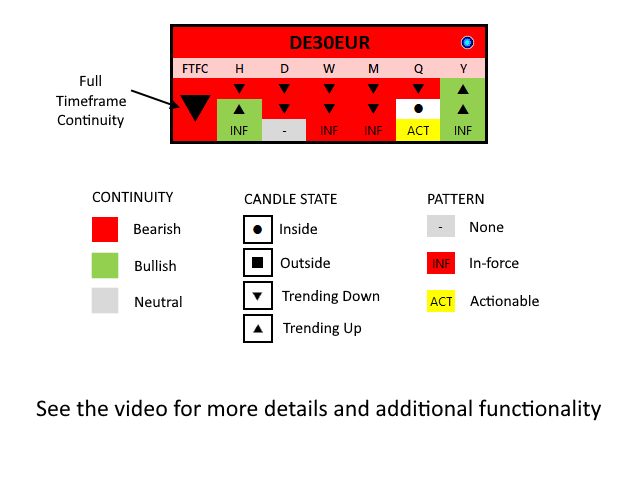
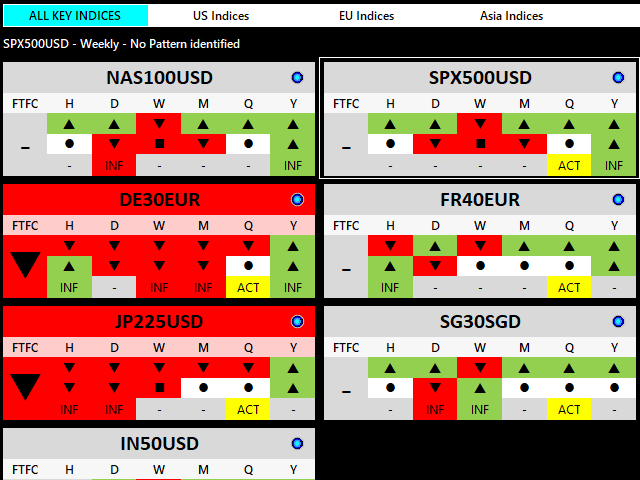
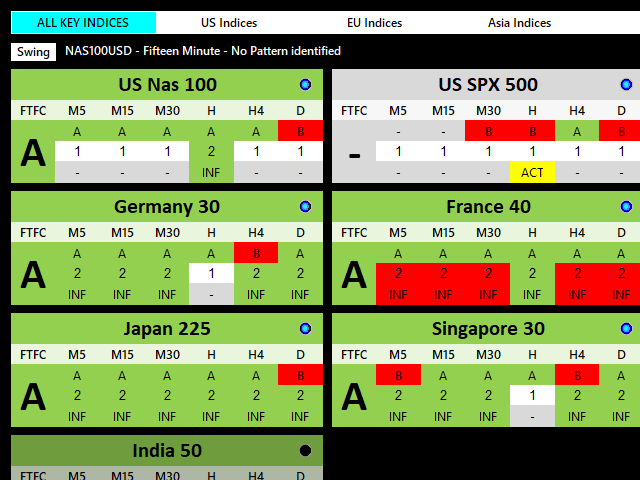
Der Indikator zeigt eine Momentaufnahme aller wichtigen Strat-Elemente, Zeitrahmenkontinuität, aktuelle Muster und aktuelle Kerzenstände aller von Ihrem Broker unterstützten Symbole an. Dies geschieht für alle unterstützten Zeitrahmen, sodass Sie genau sehen können, was gerade auf dem Markt passiert.

Sie können die Symbole beliebig gruppieren und die Titel der Schaltflächen für jede Gruppe auswählen. Wenn alle Symbole eines bestimmten Typs gleichzeitig auf dem Bildschirm angezeigt werden, können Sie Ähnlichkeiten in der Gruppe erkennen, was Ihre Analyse unterstützt.

Weitere Informationen zur Konfigurationsdatei finden Sie hier: https://www.mql5.com/en/blogs/post/746142

Wenn ein Symbol derzeit nicht handelbar, der Markt geschlossen, der Broker deaktiviert usw. ist, zeigt das Symbolfeld die neuesten verfügbaren Daten, aber die Anzeige wird ausgegraut. Ein kleines LED-Leuchtsymbol zeigt dies ebenfalls an.
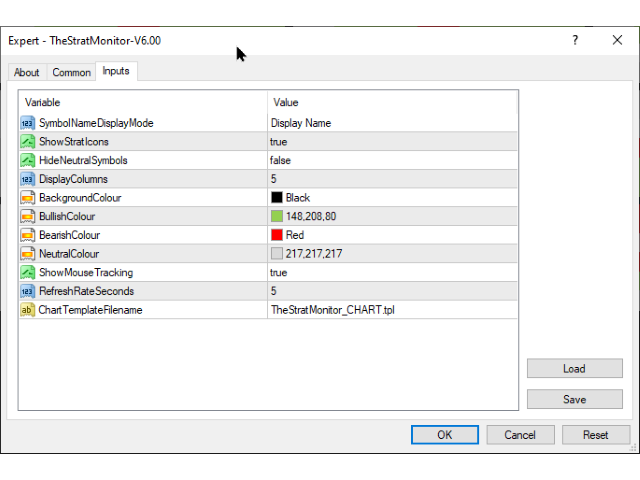
EINSTELLUNGEN

SymbolNameAnzeigemodus

Wählen Sie aus Name, Beschreibung oder Beides für die Beschriftung jedes Symbolfelds.

Zeiteinstellung

Legt die Standard-Timeset-Ansicht für den Indikator fest. Wählen Sie zwischen Daytrader oder Swingtrader. Sie können diese Einstellung jederzeit ändern, indem Sie auf die Schaltfläche auf dem Bildschirm klicken.

Die Day-Trader-Ansicht zeigt die Zeitrahmen M5, M15, M30, H1, H4 und D1 auf jedem Panel, während die Swing-Trader-Ansicht H1, D1, W1, MN1, Q und Y anzeigt.
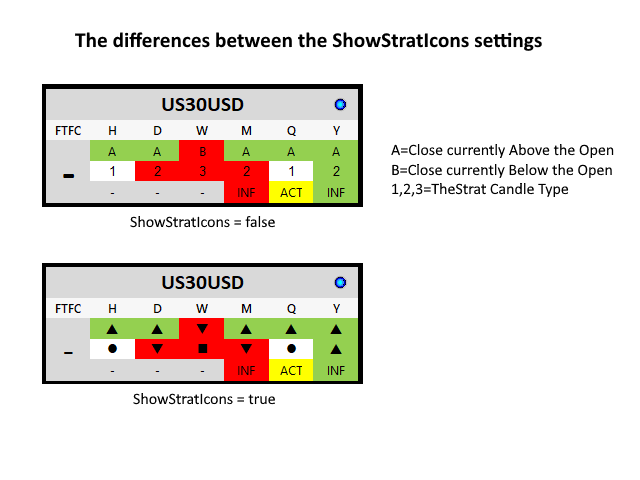
ShowStratIcons

Wenn wahr, zeigen die Panels Symbole für die Kontinuitätsrichtung, aktuelle Kerzenzustände, Muster und die gesamte FTFC an.

NeutraleSymbole ausblenden

Wenn wahr, werden alle Symbole, die keine FTFC-Richtung haben, ausgeblendet.

Spalten anzeigen

Wie viele Panel-Spalten möchten Sie im Diagramm anzeigen?

ShowMouseTracking

Wenn wahr, wird ein Umriss um das Symbolfeld gezogen, über dem sich die Maus gerade befindet.

RefreshRateSeconds

Der Standardwert ist 5, was einfach bedeutet, dass die Daten für jedes Panel alle 5 Sekunden aktualisiert werden. Der Wert muss eine positive ganze Zahl sein, also etwas größer als 0

Dateiname der Diagrammvorlage

Der Dateiname der Vorlage, die beim Öffnen eines Diagramms verwendet werden soll. Wenn die angegebene Vorlage nicht gefunden werden kann, wird die Standardvorlage verwendet.


Hintergrundfarbe

Bullische Farbe

Bärische Farbe

Neutrale Farbe

Wählen Sie die Farbe, die Sie verwenden möchten, aus der Standardauswahl von MetaTrader aus.


Bewertungen 1
renetrader07
130
renetrader07 2023.11.23 18:19 
 

Great help for filtering markets to improve probability

Empfohlene Produkte
Owl Smart Levels MT5
Sergey Ermolov
4.47 (36)
MT4-Version  |  FAQ Der Owl Smart Levels Indikator ist ein komplettes Handelssystem innerhalb eines Indikators, der so beliebte Marktanalysetools wie die fortschrittlichen Fraktale von Bill Williams , Valable ZigZag, das die richtige Wellenstruktur des Marktes aufbaut, und Fibonacci-Levels , die die genauen Einstiegslevels markieren, enthält in den Markt und Orte, um Gewinne mitzunehmen. Detaillierte Strategiebeschreibung Anleitung zur Verwendung des Indikators Berater-Assistent im Handel Owl H
All about time and price by ICT. This indicator provides a comprehensive view of ICT killzones, Silver Bullet times, and ICT Macros, enhancing your trading experience.  In those time windows price either seeks liquidity or imbalances and you often find the most energetic price moves and turning points. Features: Automatic Adaptation: The ICT killzones intelligently adapt to the specific chart you are using. For Forex charts, it follows the ICT Forex times: In EST timezone: Session: Asia: 20h00-0
Renko System
Marco Montemari
This indicator can be considered as a trading system. It offers a different view to see the currency pair: full timeless indicator, can be used for manual trading or for automatized trading with some expert advisor. When the price reaches a threshold a new block is created according to the set mode. The indicator beside the Renko bars, shows also 3 moving averages. Features renko mode median renko custom median renko 3 moving averages wicks datetime indicator for each block custom notificatio
Order Book, known also as Market Book, market depth, Level 2, - is a dynamically updated table with current volumes of orders to buy and to sell specific financial instument at price levels near Bid and Ask. MetaTrader 5 provides the means for receiving market book from your broker, but in real time only, without access to its history. The indicator OrderBook Cumulative Indicator accumulates market book data online and visualizes them on the chart. In addition, the indicator can show the market
Donchian Channel DC is the indicator of Donchian Channels, that plots maximum and minimum values of a specific period, besides mean value line. It´s possible to configure simple period for analysis and the indicator will plot all three values. You can trade with this indicator as trend or reversal, according to each strategy. Do not let to test others indicators as soon as others expert advisors.
Renko Plus
Eadvisors Software Inc.
With Renko Plus you can use the features in the Indicator functionality, just add it to the Metatrader5 chart.             The Renko chart is a type of chart, developed by the Japanese, that is constructed using price movement rather than standardized prices and time intervals like most charts. It is believed to be named after the Japanese word for bricks, "renga", as the graphic looks like a series of bricks.             A new brick is created when the price moves a specified p
Diese innovative Währung Stärke Messindikator von INFINITY ist ein unverzichtbarer Helfer für Scalper und Händler, die in langen Handel. Das System der Analyse der Stärke / Schwäche der Währungen ist seit langem bekannt und wird auf dem Markt von den führenden Händlern der Welt verwendet. Jeder Arbitrage-Handel kommt nicht ohne diese Analyse aus. Unser Indikator bestimmt leicht die Stärke der zugrunde liegenden Währungen in Bezug aufeinander. Es zeigt Liniendiagramme für alle oder das aktuelle
Follow The Line MT5
Oliver Gideon Amofa Appiah
4.4 (30)
This indicator obeys the popular maxim that: "THE TREND IS YOUR FRIEND" It paints a GREEN line for BUY and also paints a RED line for SELL. (you can change the colors). It gives alarms and alerts of all kinds. IT DOES NOT REPAINT and can be used for all currency pairs and timeframes. Yes, as easy and simple as that. Even a newbie can use it to make great and reliable trades. NB: For best results, get my other premium indicators for more powerful and reliable signals. Get them here: https://www.m
FREE
Half ma
Artem Svistunov
The Half ma arrow indicator for the MetaTrader 5 trading terminal is a simple but effective tool that gives a signal about a change in the current trend. The Half ma indicator looks like a solid dynamic line that changes color at the points where the trend changes. At these points, the indicator draws arrows of the corresponding color and direction.The Half ma arrow indicator for the MT5 terminal is not an independent source of input signals. It will be most effective to use it as a trend filte
Premium-Level ist ein einzigartiger Indikator mit mehr als 80% Genauigkeit der richtigen Vorhersagen! Dieser Indikator wurde von den besten Trading-Spezialisten seit mehr als zwei Monaten getestet! Den Indikator des Autors finden Sie nirgendwo anders! Anhand der Screenshots können Sie sich von der Genauigkeit dieses Tools überzeugen! 1 ist ideal für den Handel mit binären Optionen mit einer Ablaufzeit von 1 Kerze. 2 funktioniert bei allen Währungspaaren, Aktien, Rohstoffen, Kryptowähr
Point Black
Ignacio Agustin Mene Franco
Black Card Pack indicator 5/1 point black It has the strategy of professional bollingers where each arrow gives you a different entry signal. It is used to operate in m1 and in d1 It is used for scalping and intraday, modified for forex markets ! suitable for all pairs modified for synthetic index markets suitable for all pairs! Ideal for volatility and jumps!
Trend Monitor MT5
Pavel Zamoshnikov
3.67 (3)
The indicator generates early signals basing on ADX reading data combined with elements of price patterns. Works on all symbols and timeframes. The indicator does not redraw its signals. You see the same things on history and in real time. For better visual perception signals are displayed as arrows (in order not to overload the chart). Features The best results are obtained when the indicator works on two timeframes. For example: M30 – the indicator shows the main trend; M5 – the indicator ge
Noize Absorption Index - is the manual trading system that measures the difference of pressure between bears forces and bulls forces. Green line - is a noize free index that showing curent situation. Zero value of index shows totally choppy/flat market.Values above zero level shows how powerfull bullish wave is and values below zero measures bearish forces.Up arrow appears on bearish market when it's ready to reverse, dn arrow appears on weak bullish market, as a result of reverse expectation.
TrendDetect
Pavel Gotkevitch
The Trend Detect indicator combines the features of both trend indicators and oscillators. This indicator is a convenient tool for detecting short-term market cycles and identifying overbought and oversold levels. A long position can be opened when the indicator starts leaving the oversold area and breaks the zero level from below. A short position can be opened when the indicator starts leaving the overbought area and breaks the zero level from above. An opposite signal of the indicator can
HMA Trend Professional MT5
Pavel Zamoshnikov
4.4 (5)
Improved version of the free HMA Trend indicator (for MetaTrader 4) with statistical analysis. HMA Trend is a trend indicator based on the Hull Moving Average (HMA) with two periods. HMA with a slow period identifies the trend, while HMA with a fast period determines the short-term movements and signals in the trend direction. The main differences from the free version: Ability to predict the probability of a trend reversal using analysis of history data. Plotting statistical charts for analyz
Renko Gold
Ignacio Agustin Mene Franco
Renko Gold! clearly indicates the floors and ceilings where it goes from 4 lines, the line below that marks the floor in green confirming with the thinnest line clarifies the purchase entry, the same is for sale, the top line marks the ceiling and the thinnest red line marks the sale, This indicator works for all temporalities! For Forex and Synthetic Indices markets! It also works for crypto markets! Good profit! World Investor.
Ichimoku Aiko MTF
Michael Jonah Randriamampionontsoa
Ichimoku Aiko MTF is a collection of technical indicators that show support and resistance levels, as well as momentum and trend direction. It is a multi-timeframe indicator so you don't need to change the chart timeframe when you want to see the ichimoku clouds on a higher timeframe.  eg. The chart timeframe is M15 and you want to see on the M15 timeframe chart the H1 ichimoku indicators (the ichimoku in Metatrader can't do that) that's why you need to use Ichimoku Aiko MTF.
Indicator and Expert Adviser  EA Available in the comments section of this product. Download with Indicator must have indicator installed for EA to work. Mt5 indicator alerts for bollinger band and envelope extremes occurring at the same time. Buy signal alerts occur when A bullish candle has formed below both the lower bollinger band and the lower envelope  Bar must open and close below both these indicators. Sell signal occur when A bear bar is formed above the upper bollinger band and upp
The standard Bollinger Bands indicator has been improved by integrating additional indications from the Standard Deviation indicator (StdDev), which gives an additional filter for confirming trading signals. In addition, the color of the indicator's lines shows the beginning of a trend, its development and exhaustion. This indicator has a signal block that notifies the trader of the beginning of the trend on any time frame to which it is attached. Settings Type of messages - select the type of
Supertrend   indicator uses a combination of a moving average and average true range to detect the trend of a trading instrument. Supertrend indicator for MetaTrader 5 easily shows the trend as a line following the price. You can use the second my indicator: You will see 3 supertrends and EMA 200 lines on the screen. Working with my product : https://www.mql5.com/en/market/product/80692
Range Target
Ignacio Agustin Mene Franco
Range Target! indicator that marks the depletion of strength of the candle where it touches the floor and catches a trend, whether it is up or down The indicator has two support lines where it marks the floor and the ceiling. where on the same line marks the entry for rise or fall, the lines have Gold and Blue colors the gold line shows the purchase the blue line shows the sale works for any season works for forex markets works for synthetic index markets! Good Profit, World Investor.
Big Player Range
Thalles Nascimento De Carvalho
5 (2)
Willkommen beim "BigPlayerRange"-Indikator, einem technischen Analysewerkzeug, das entwickelt wurde, um signifikante Interessensbereiche von Finanzinstituten auf den Märkten zu identifizieren. Dieser Indikator bietet eine präzise Analyse von Preisbereichen, in denen große Marktteilnehmer eine erhebliche Aktivität und Interesse zeigen. Hauptmerkmale: 1. Kartierung der Interessensbereiche von Institutionen: "BigPlayerRange" hebt genau die Bereiche im Chart hervor, in denen Finanzinstitute st
One of the most famous phrases in the trading world is "The Trend Is Your Friend". Trading following the current trend is one of the most successful ways in terms of probability. The hard part of it is to recognize when the market is trending or not. that's the role of our indicator we called The Trend Is Your Friend Until It Is Not. Apart from its big name it is really easy to use and see when the market is trending or ranging. Through a little window of 3 colors you will identify if the ma
LT Rainbow Trend
Thiago Duarte
5 (1)
Do you, like me, like to trade with the trend? Then this indicator will help you! Rainbow Trend is a trend indicator, which uses several Moving Averages on the chart. It measures different trend strenght zones for different periods: very long term, long term, mid term, short term and very short term. Each zone has its color, and it is possible to have sound alert when the prices leaves a zone and enters another. Its configuration is very simple. If you find any bug or have any suggestions, co
Dieser Indikator zeigt Ihnen die TP- und SL-Werte (in dieser Währung), die Sie bereits für jede Order in den Charts (geschlossen zur Transaktions-/Orderzeile) festgelegt haben, was Ihnen sehr dabei helfen wird, Ihren Gewinn und Verlust für jede Order zu schätzen. Und es zeigt Ihnen auch die PIPs-Werte. das angezeigte Format ist „Währungswerte unserer Gewinn- oder Verlust-/PIPs-Werte“. Der TP-Wert wird in grüner Farbe und der SL-Wert in roter Farbe angezeigt. Bei Fragen oder weiteren Informati
Time And Sales Delta
Evgeny Shevtsov
5 (2)
The indicator displays the delta and the cumulative delta based on the "Time & Sales" deals list data. In addition to the standard timeframes, the indicator displays data regarding the seconds timeframes (S5, S10, S15, S20, S30) to choose from. Using the rectangle, user can select an arbitrary area in the indicator subwindow to view the ratio of the volumes of deals of buyers and sellers within this area. Indicator features: The indicator works correctly only on those trading symbols for whi
This is Gekko's Cutomized Cutomized Average Directional Index (ADX), a customized version of the famous ADX indicator. Use the regular ADX and take advantage two entry signals calculations and different ways of being alerted whenever there is potential entry or exit point. Inputs Period: Period for the ADX calculation; PlotSignalType: How will the indicator calculate entry (swing) signals: 1- ShowSwingsOnTrendLevel : Show Signals for Trend Confirmation Swings; 2- ShowSwingsOnTrendLevelDirectio
Slopes are an increasingly key concept in Technical Analysis. The most basic type is to calculate them on the prices, but also on technical indicators such as moving averages and the RSI. In technical analysis, you generally use the RSI to detect imminent reversal moves within a range. In the case of the Blue indicator, we are calculating the slope of the market price and then calculating the RSI of that slope in order to detect instances of reversal. The Blue indicator is therefore used
Heiken Ashi Smoothed Strategy is a very simple but powerful system to get forex market trend direction. This indicator is actually 2 indicators in 1 pack, Heiken Ashi and Heiken Ashi Smoothed Moving Average both included. Because HA (Heiken Ashi) and HAS (Heiken Ashi Smoothed) are calculated in the same one system event with necessary buffers and loop only, so it is the FAST, OPTIMIZED and EFFICIENT HA having the combined indicator of MetaTrader 5. You can choose to display HA and HAS in the sam
Indikator zur Bestimmung von Flat und Trend. Wenn der Preis unter einem der beiden Histogramme und zwei Linien (rot und blau) liegt, ist dies eine Verkaufszone. Beim Kauf dieser Version des Indikators, MT4-Version für ein echtes und ein Demo-Konto - als Geschenk (zum Erhalten, schreiben Sie mir eine private Nachricht)! Wenn der Preis über einem der beiden Histogramme und zwei Linien (rot und blau) liegt, ist dies eine Kaufzone. MT4-Version: https://www.mql5.com/en/market/product/3793 Wenn der P
Käufer dieses Produkts erwarben auch
Atomic Analyst MT5
Issam Kassas
4.22 (9)
Zunächst einmal ist es erwähnenswert, dass dieser Handelsindikator nicht neu malt, nicht neu zeichnet und keine Verzögerung aufweist, was ihn sowohl für manuellen als auch für Roboterhandel ideal macht. Der Atom-Analyst ist ein PA-Preisaktionsindikator, der die Stärke und das Momentum des Preises nutzt, um einen besseren Vorteil auf dem Markt zu finden. Ausgestattet mit fortschrittlichen Filtern, die helfen, Rauschen und falsche Signale zu entfernen, und das Handelspotenzial zu erhöhen. Durch
Advanced Supply Demand MT5
Bernhard Schweigert
4.53 (15)
Derzeit 33% Rabatt! Die beste Lösung für jeden Anfänger oder erfahrenen Händler! Dieser Indikator ist ein einzigartiges, qualitativ hochwertiges und erschwingliches Trading-Tool, da wir eine Reihe von proprietären Funktionen und eine neue Formel integriert haben. Mit diesem Update werden Sie in der Lage sein, doppelte Zeitrahmenzonen anzuzeigen. Sie können nicht nur einen höheren TF (Zeitrahmen) anzeigen, sondern sowohl den Chart-TF als auch den höheren TF: SHOWING NESTED ZONES. Alle Supply Dema
FX Volume MT5
Daniel Stein
4.94 (17)
Erhalten Sie Ihr tägliches Marktupdate mit Details und Screenshots über unser Morning Briefing hier auf mql5 und auf Telegram ! FX Volume ist der ERSTE und EINZIGE Volumenindikator, der einen ECHTEN Einblick in die Marktstimmung aus Sicht eines Brokers bietet. Es bietet fantastische Einblicke in die Positionierung von institutionellen Marktteilnehmern, wie z.B. Brokern, auf dem Forex-Markt, viel schneller als COT-Berichte. Diese Informationen direkt auf Ihrem Chart zu sehen, ist der wahre Game
Bill Williams Advanced
Siarhei Vashchylka
5 (3)
Bill Williams Advanced is designed for automatic chart analysis using Bill Williams' "Profitunity" system. The indicator analyzes four timeframes at once. Manual (Be sure to read before purchasing) Advantages 1. Automatically analyzes the chart using the "Profitunity" system of Bill Williams. The found signals are placed in a table in the corner of the screen. 2. Equipped with a trend filter based on the Alligator indicator. Most of the system signals are recommended to be used only accordi
TrendMaestro5
Stefano Frisetti
note: this indicator is for METATRADER4, if you want the version for METATRADER5 this is the link:  https://www.mql5.com/it/market/product/108106 TRENDMAESTRO recognizes a new TREND in the bud, he never makes mistakes. The certainty of identifying a new TREND is priceless. DESCRIPTION TRENDMAESTRO identifies a new TREND in the bud, this indicator examines the volatility, volumes and momentum to identify the moment in which there is an explosion of one or more of these data and therefore the mome
XQ Indicator MetaTrader 5
Marzena Maria Szmit
5 (1)
Step into the realm of Forex trading with confidence and precision using XQ, a cutting-edge Forex indicator designed to elevate your trading game to unprecedented heights. Whether you're a seasoned trader or just stepping into the world of currency exchange, XQ Forex Indicator empowers you with the insights and signals needed to make informed trading decisions. The signal conditions are a combination of three indicators, and XQ Forex Indicator only display  medium and long-term trends . The ind
A key element in trading is zones or levels from which decisions to buy or sell a trading instrument are made. Despite attempts by major players to conceal their presence in the market, they inevitably leave traces. Our task was to learn how to identify these traces and interpret them correctly. Reversal First Impulse levels (RFI)   -  Version MT4                  INSTRUCTIONS                 RUS                 ENG                         R ecommended to use with an indicator   -  TREND PRO  
Golden Gate Algo MT5
James David Lane
4 (6)
40% RABATT ZU WEIHNACHTEN! PREISERHÖHUNG AUF $250 AM 1. JANUAR! Vorstellung von GoldenGate Entries: Eine hochmoderne Handelslösung! Entdecken Sie einen revolutionären Ansatz zum Handel mit GoldenGate Entries (GGE), einem fortschrittlichen Indikator, der entwickelt wurde, um Ihr Handelserlebnis zu verbessern. GGE bietet eine umfassende Palette von Funktionen, um Benutzer mit Präzision und Vertrauen in ihren Handelsentscheidungen auszustatten. Paare: Beliebig (FX - Rohstoffe - Aktien - Akti
PZ Swing Trading MT5
PZ TRADING SLU
5 (4)
Swing Trading ist der erste Indikator, der Schwankungen in Trendrichtung und mögliche Umkehrschwankungen erkennt. Es wird der in der Handelsliteratur weit verbreitete Baseline-Swing-Trading-Ansatz verwendet. Der Indikator untersucht mehrere Preis- und Zeitvektoren, um die aggregierte Trendrichtung zu verfolgen und erkennt Situationen, in denen der Markt überverkauft oder überkauft ist und zur Korrektur bereit ist. [ Installationsanleitung | Update-Anleitung | Fehlerbehebung | FAQ | Alle Produkte
Professional Scalping Tool on Deriv Attention! The indicator will be sold in limited quantities!!! Description: This trading indicator is designed for professional traders focused on scalping. Designed with the market in mind, it provides highly accurate spike trading signals. It works on the M1 timeframe and supports the following symbols: Boom 300 Index, Boom 500 Index, Boom 1000 Index, Crash 300 Index, Crash 500 Index, Crash 1000 Index. Functional Features: - Direction: - Trading is ca
Der Forex TPA Indikator deckt die wahren Aktionen der Marktmacher auf, immer dann wenn sie passieren. "Kämpfe nicht gegen die Marktmacher an, sondern folge ihnen", ist wohl der beste Rat, den ein Trader bekommen kann. Der TPA Indikator zeigt jedesmal seine Signale an wenn die Bullen definitiv stärker sind als die Bären und umgekehrt. Dieser Indikator wurde VON Tradern FÜR Trader gemacht und ist 100% NICHT NACHZEICHNEND! Signale werden STRENG am Schluss einer Kerze  generiert. Das sagen unsere Ku
IVISTscalp5
Vadym Zhukovskyi
5 (3)
Wir stellen Ihnen den iVISTscalp5-Indikator vor, der nicht nur einzigartig, sondern auch effektiv im Handel ist. Dieser Indikator basiert auf Zeitdaten und ist das Ergebnis jahrelanger Erfahrung und eingehender Analyse der Finanzmärkte. Der iVISTscalp5-Indikator ist ein ausgezeichnetes Werkzeug für manuellen Handel. Bequemlichkeit, Einfachheit und Visualisierung - die gesamte Komplexität ist verborgen. Wir haben die Einstellungen und Verwendung des iVISTscalp5-Indikators auf das Maximum vereinfa
Weis Wave with Alert MT5
Trade The Volume Waves Single Member P.C.
4.93 (15)
Rental/Lifetime Package Options and Privileges  * For optimum results the yearly or lifetime package is suggested due to live training ! Rent Monthly Six Months   Yearly/Lifetime Weis Wave with Speed with Alert+Speed Index x x x Manual  x x x Quick Set up Video x x x Blog x x x Lifetime Updates x x x Setup and Training Material x x Free Rectangle Break Alert Tool      x Discord Access Channel "The SI traders" x 2-hour live methodology training x How to trade with it:    http://
Dies ist wahrscheinlich der vollständigste Indikator für die automatische Erkennung der harmonischen Preisbildung, den Sie für die MetaTrader-Plattform finden können. Es erkennt 19 verschiedene Muster, nimmt Fibonacci-Projektionen genauso ernst wie Sie, zeigt die potenzielle Umkehrzone (PRZ) an und findet geeignete Stop-Loss- und Take-Profit-Werte. [ Installationsanleitung | Update-Anleitung | Fehlerbehebung | FAQ | Alle Produkte ] Es erkennt 19 verschiedene harmonische Preisbildungen Dar
The indicator is designed to close positions on the market in time. For example: to take profits ahead of schedule if the price has not reached TakeProfit, and the market is turning around. The indicator analyzes the momentum, not the trend. He does not give any information about the trend. The indicator is well suited for finding divergence. The Ershov 38 Parrots indicator dynamically adjusts to the market and detects price movement impulses of medium and high amplitude. It almost does not rea
Multi-currency, multi-timeframe, harmonic pattern indicator AB = CD. Supports sending push notifications about signals to a mobile device, messages on e-mail, as well as messages using alerts on all available currency pairs and timeframes. This indicator was based on the indicator Harmonic ABCD Universal. Version for MetaTrader 5:  https://www.mql5.com/en/market/product/44972 . See also: Harmonic ABCD Universal for MetaTrader 4 . Using modern software development methods has made the indicator a
Malaysian SNR Levels
Matthias Horst Pieroth
This indicator can be used to display Support and Resistance levels according to  the  Malaysian SNR concept , in which Support and Resistance are exact levels of a line chart. Malaysian SNR There are 3 different horizontal levels in Malaysian SNR: A-Level : This level is located at the peak of this line chart. (shape looks like the letter A) V-Level : Level at the valley of a line chart, (shape looks like the letter V) Gap-Leve l: This level is located at the Close/Open gap between two cand
Native Channels
BeeXXI Corporation
5 (2)
This indicator recognizes all support and resistance levels. A number of unique high-performance techniques have been applied, which made the existence of this indicator possible. All formed channels are naturally visible: horizontal linear linear parabolic cubic (Polynomial 3 degrees - Wave) This is due to a bundle of approximating channels. The formed channels form "standing waves" in a hierarchical sequence. Thus, all support and resistance levels are visible. All parameter management is
RAD CRITICAL LEVES RAD indicator tracks “Relevant Volume” in real time, identifying accumulation and distribution processes, projecting them in the chart as SUPPORT or RESISTANCE zones. Natural   support   and resistance levels are generated by Volume Accumulation and Distribution processes. As these processes evolve, levels at which the relevant volume in the market place is positioned, become difficult areas to cross upwards or downwards. By using this information, traders can identify very s
Divergenzen sind schwierig zu finden und seltener anzutreffen. Sie sind eines der zuverlässigsten Handelsszenarien. Dieser Indikator sucht automatisch mit Ihrem bevorzugten Oszillator nach regelmäßigen und versteckten Abweichungen. [ Installationsanleitung | Update-Anleitung | Fehlerbehebung | FAQ | Alle Produkte ] Einfach zu handeln Findet regelmäßige und versteckte Abweichungen Unterstützt viele bekannte Oszillatoren Implementiert Handelssignale basierend auf Ausbrüchen Zeigt geeignete
Introduction to X3 Chart Pattern Scanner X3 Cherart Pattern Scanner is the non-repainting and non-lagging indicator detecting X3 chart patterns including Harmonic pattern, Elliott Wave pattern, X3 patterns, and Japanese Candlestick patterns. Historical patterns match with signal patterns. Hence, you can readily develop the solid trading strategy in your chart. More importantly, this superb pattern scanner can detect the optimal pattern of its kind. In addition, you can switch on and off individu
[ MT4 Version ] Backtesting Simulator Are you tired of spending months on demo or live accounts to test your trading strategies? The Backtesting Simulator is the ultimate tool designed to elevate your backtesting experience to new heights. Utilizing Metatrader historical symbol information, it offers an unparalleled simulation of real market conditions. Take control of your testing speed, test ideas quickly or at a slower pace, and witness remarkable improvements in your testing performance.
"Piranha" - an autonomous trading system that determines overbought and oversold levels on the chart. Red and blue zones represent overbought and oversold levels respectively. Entry points are marked with arrows: a downward arrow in the red zone for "sell" and an upward arrow in the blue zone for "buy". The Take profit level is indicated by the green moving average. Key features: Adjusting the Take profit level as the green moving average changes position. Averaging ability when a new market e
PZ Trend Trading MT5
PZ TRADING SLU
3.67 (3)
Trend Trading ist ein Indikator, der so weit wie möglich von den Markttrends profitiert, indem er Pullbacks und Breakouts zeitlich festlegt. Sie findet Handelsmöglichkeiten, indem sie analysiert, was der Preis während etablierter Trends tut. [ Installationsanleitung | Update-Anleitung | Fehlerbehebung | FAQ | Alle Produkte ] Handeln Sie mit Zuversicht und Effizienz an den Finanzmärkten Profitieren Sie von etablierten Trends, ohne ins Wanken zu geraten Profitable Pullbacks, Ausbrüche und vor
INDIKATOR basierend auf KÜNSTLICHER INTELLIGENZ, der mögliche Call- und Put-Eingaben für binäre Optionen generiert. Der Indikator funktioniert nach drei verschiedenen Strategien: 1) Durch das Ablesen der Volumina wird ein Signal gesendet, wann sich der Preis umkehren sollte 2) Durch die Divergenz zwischen Preis und Volumen sendet es ein Signal, wann sich der Trend fortsetzen oder umkehren sollte 3) Durch die Konvergenz zwischen Preis und Volumen sendet es ein Signal, wann sich der Trend
MetaForecast M5
Vahidreza Heidar Gholami
5 (2)
MetaForecast prognostiziert und visualisiert die Zukunft eines beliebigen Marktes basierend auf den Harmonien in den Preisdaten. Obwohl der Markt nicht immer vorhersehbar ist, kann MetaForecast, wenn es ein Muster im Preis gibt, die Zukunft so genau wie möglich voraussagen. Im Vergleich zu ähnlichen Produkten kann MetaForecast durch die Analyse von Markttrends genauere Ergebnisse erzeugen. Eingabeparameter Past size (Vergangene Größe) Gibt an, wie viele Balken MetaForecast verwendet, um ein Mo
Welcome to the world of SMC (Smart Money Concepts) Trading, where we empower traders with the tools and knowledge to make smarter trading decisions. Our latest addition to our suite of trading tools is the SMC Trading Pro indicator, version 1.0. Key Features: Major Market Structure Identification with BODY break. Order Block must be in Major Swing ( not Small Swing ). Order Block with Fair Value Gap Detection. Order Block in Discount | Premium zone. Filter for only Bullish, Bearish or All Order
VTrende Pro
Andrii Diachenko
5 (1)
VTrende Pro - MTF indicator for trend trading with a display panel for MT5 *** Videos can be translated into any language using subtitles (video language - Russian) Although the signals of the VTrende Pro indicator can be used as signals of a full-fledged trading system, it is recommended to use them in conjunction with the Bill Williams TS. VTrende Pro is an extended version of the VTrende indicator. Difference between Pro version and VTrende: - Time zones - Signal V - signal 1-2 waves
Good day! I present to you a trading technical indicator for Deriv broker synthetic indices. This indicator ONLY works with the following indices: Boom 300 Index Boom 500 Index Boom 1000 Index Crash 300 Index Crash 500 Index Crash 1000 Index The indicator was created to give signals to open medium-term trades in the direction of Spikes. But you can open trades in the opposite direction to Spikes, at your own risk. Trade only on M1. Other TFs do not guarantee the correct operation of the indic
Der Gann Square Indikator ist ein leistungsstolles Marktanalyse-Tool, das auf dem Artikel "Mathematische Formel für Marktvorhersagen" von W.D. Gann basiert. Dieses Tool verwendet mathematische Konzepte und Gann-Theorien für eine präzise Marktanalyse. Es beinhaltet Quadratwerte von 144, 90, 52 und auch das Quadrat von 9. Darüber hinaus integriert es die Methode von  zur Quadratwurzel von 9 und deren Beziehung zu Kanälen und dem Sternmuster. Benutzerhandbuch und Anwendung: Vor der Verwendung diese
Weitere Produkte dieses Autors
Multi Chart Crosshairs MT5
Robert Gerald Wood
5 (7)
Dieser Indikator wurde entwickelt, um die Überprüfung vieler Diagramme auf verschiedenen Zeitskalen schneller und einfacher zu machen. Verfolgen Sie Zeit und Preis über mehrere Charts hinweg Ändern Sie das Symbol auf einem Chart und alle anderen Charts desselben Symbols werden ebenfalls geändert. Einfach zu bedienen, schnell zu beherrschen Der Indikator ermöglicht es Ihnen, den Preis und die Zeit zu identifizieren, in der sich der Mauszeiger auf dem aktuellen Chart befindet, über alle anderen Ch
TheStrat Levels MT5
Robert Gerald Wood
5 (1)
This indicator draws the prior Highs and Lows for multiple timeframes, and can display potential Take Profit and Stop Loss levels. In Rob Smith's # The Strat  terms, these are potential entry points, or alternatively potential targets for open positions. I like to use them in both ways. On a lower timeframe, say 5 minutes to get a good entry on a daily or weekly level, and then as a potential target. Very small stops required giving an excellent risk/reward ratio. Key Features  - Levels from Ho
TheStrat TFC Monitor MT5
Robert Gerald Wood
5 (1)
Beim Handel mit   The Strat   ist es wichtig, mehrere Zeitrahmen im Auge zu behalten. Dieser Indikator zeigt den täglichen, wöchentlichen, monatlichen und vierteljährlichen Status der aktuellen Kerze für jeden Zeitrahmen an. Ein Kreissymbol zeigt an, dass die Kerze in diesem Zeitrahmen derzeit eine Inside ist, oder Typ 1 in der TheStrat-Terminologie. Eine Inside-Day-Kerze konsolidiert die Kursbewegung, und wir suchen nach einem Ausbruch aus der Spanne. Ein Dreieckssymbol, das nach oben oder unte
This indicator will draw a label above or below each candle based on   Rob Smith's   The Strat   as they develop over time on your chart. As price evolves, a candle can switch between three states. When the candle first opens, if it sits completely within the previous candles high and low, then it will start as a Type 1. As time moves on, if it breaks either the high or low of the previous candle, it will be come a type 2, and should the price action be volatile and directionless, it may then
TheStrat Monitor
Robert Gerald Wood
3 (2)
If you've not already learnt about The Strat trading strategy , go google it now. I promise it won't be a waste of your time, and you will likely learn some new tricks whether you use it or not. OK, so now you know what TheStrat is, you will be able to understand what this indicator can do for you. Key Features In short, the Indicator will: Show Timeframe Continuity for all supported timeframes Supports two timeset views, Day trader and Swing trader Show when Full Timeframe Continuity is in pl
Multi Chart Crosshairs
Robert Gerald Wood
5 (2)
This indicator is designed to make reviews of many charts on different timescales quicker, and easier to do. Track Time and Price across multiple charts Change Symbol on one chart and all other charts of the same symbol will be changed too. Easy to use, quick to master The indicator allows you to identify the price and time where the mouse pointer is on the current chart, across all other charts open on the same Symbol. This allows you to quickly see information on multiple charts whereas normal
TheStrat Levels
Robert Gerald Wood
This indicator draws the prior Highs and Lows for multiple timeframes, and can display potential Take Profit and Stop Loss levels. In Rob Smith's # The Strat   terms,   these are potential entry points, or alternatively potential targets for open positions. I like to use them in both ways. On a lower timeframe, say 5 minutes to get a good entry on a daily or weekly level, and then as a potential target. Very small stops required giving an excellent risk/reward ratio. Please watch the DEMO video
TheStrat Candles
Robert Gerald Wood
4.5 (2)
Dieser Indikator zeichnet eine Beschriftung über oder unter jeder Kerze, basierend auf       Rob Smiths       Die Strat       wie sie sich im Laufe der Zeit auf Ihrem Diagramm entwickeln. Wenn sich der Preis entwickelt, kann eine Kerze zwischen drei Zuständen wechseln. Wenn sich die Kerze zum ersten Mal öffnet und vollständig innerhalb der vorherigen Kerzen hoch und niedrig sitzt, beginnt sie als Typ 1. Wenn sie im Laufe der Zeit entweder das Hoch oder das Tief der vorherigen Kerze durchbrich
TheStrat Patterns
Robert Gerald Wood
This indicator will draw patterns based on Rob Smith's The Strat as they emerge in real time on your chart. As price evolves, TheStrat offers 18 distinct price action patterns that can help you get good entries in the market. Each pattern involves two or three candles, and this indicator will draw a bounding box around the candles and name the pattern. The indicator also shows when a potential setup is forming, known by stratters as an Actionable signal. Candles Each candle is defined by i
Chart Drawing Cloner
Robert Gerald Wood
5 (4)
Mit diesem Skript können Sie beliebige Zeichnungsobjekte wie Trendlinien, Fibonachi-Retracements usw. in einen oder mehrere andere Charts kopieren. Standardmäßig kopiert das Skript alle Objekte auf dem aktuellen Chart, d. h. dem Chart, auf den das Skript angewendet wurde, in jeden anderen Chart mit demselben aktuell geladenen Symbol. Einstellungen ZielZeitrahmen Wenn es auf etwas anderes als PERIOD_CURRENT eingestellt ist, kopiert es die Objekte in jeden offenen Chart mit demselben Symbol
FREE
A simple script that can delete all the drawing objects on a chart, or just the objects of a specific type. Settings: DeleteObjectsOfType By default the value will be blank which means ALL drawing objects on the chart will be deleted. If you only wish to delete specific types of drawing object, change this setting to the type of object to delete. For example, Fibonacci Retracement, Text, Label or Trend Line. Please see the demonstration video for more information.
FREE
Ich habe diesen einfachen Indikator erstellt, während ich etwas über Rob Smiths TheStrat lernte, und finde ihn so hilfreich, dass ich dachte, ich würde ihn mit Ihnen teilen. Wenn Sie es nützlich finden, schauen Sie sich bitte die anderen Indikatoren an, die ich auf MQL5 veröffentlicht habe. Der Indikator zeichnet einfach eine einzelne Linie auf dem Chart, die das von Ihnen ausgewählte Preisniveau aus einem höheren Zeitrahmen anzeigt. Mit den Einstellungen haben Sie die volle Kontrolle über den a
FREE
This script allows you to toggle the "Show Trade Levels" option, but for the current chart only. Normally, you can only change the setting using the Options -> Chart menu for ALL charts, but this script allows you to do it for a SINGLE chart. I'm using it when I take screenshots, because most of the time I'm not trying to show the trades, just some functionality of one of my other tools. Iif you need that functionality, then this script is very helpful! If the script helps you, please let me
FREE
TheStrat FTFC
Robert Gerald Wood
FTFC bezieht sich auf Full Timeframe Continuity, wie in Rob Smiths   The Strat   definiert. Dieser Indikator zeichnet zwei Linien auf dem Chart, eine der höchsten der vierteljährlichen, monatlichen, wöchentlichen, täglichen oder stündlichen Eröffnungsniveaus und die zweite der niedrigsten dieser Werte. Dadurch erhalten Sie einen Kanal, über oder unter dem der Handel eher sehr stark in eine Richtung verläuft. Zwischen den Linien wird die Preisbewegung abgehackter und Sie können breitere Stopps ve
Die Märkte lieben runde Zahlen wirklich und sie wirken oft als Unterstützung in einem fallenden Markt oder als Widerstand, wenn der Preis steigt. Dieser Indikator wurde entwickelt, um Preisniveaus bei runden Werten zu zeichnen. Dies geschieht automatisch, aber Sie haben auch die Möglichkeit, dies zu überschreiben und die Ebenen zu bestimmen, die Sie sehen möchten. Ein rundes Niveau kann so einfach sein wie 10er-Schritte, also 10, 20, 30 usw., oder wenn Sie mit Forex arbeiten, möchten Sie viellei
Beim Handel mit   The Strat   ist es wichtig, mehrere Zeitrahmen im Auge zu behalten. Dieser Indikator zeigt den täglichen, wöchentlichen, monatlichen und vierteljährlichen Status der aktuellen Kerze für jeden Zeitrahmen an. Ein Kreissymbol zeigt an, dass die Kerze in diesem Zeitrahmen derzeit eine Inside ist, oder Typ 1 in der TheStrat-Terminologie. Eine Inside-Day-Kerze konsolidiert die Kursbewegung, und wir suchen nach einem Ausbruch aus der Spanne. Ein Dreieckssymbol, das nach oben oder unte
Active Pivot Levels
Robert Gerald Wood
5 (1)
Pivot-Ebenen sind eine etablierte technische Ebene, die in jedem Markt anerkannt ist. Dieser Indikator zeichnet die aktuellen vierteljährlichen, monatlichen, wöchentlichen, täglichen und vierstündlichen Pivots für jedes Symbol auf dem Chart. Sie können auch die Unterstützungs- und Widerstandsstufen für jeden Zeitraum anzeigen und auswählen, welche von Stufen 1 bis 4 angezeigt werden sollen.     Wählen Sie den Pivot-Typ aus: Standard Camarilla DeMark Woodie Fibonacci Bitte beachten Sie, dass DeMa
ATR Extremes
Robert Gerald Wood
Average True Range (ATR) ist ein häufig verwendeter Indikator, der die Höhe der Kursbewegung über eine festgelegte Dauer misst. Der Wert, den es gibt, ist jedoch nicht innerhalb einer Art von Grenze definiert, was es fast unmöglich macht, ihn für andere Zwecke als Stop-Loss- oder Take-Profit-Berechnungen zu verwenden. Dieser Indikator ist Ihr Standard-ATR-Indikator, aber wir haben Perzentilabgrenzungen eingeführt, damit Sie die Extreme sehen können. Sie können zwischen Perzentilen und etwas
Range Exhaustion
Robert Gerald Wood
Spannenerschöpfung tritt auf, wenn der Preis die erwartete Spanne für den aktuellen Zeitraum erreicht oder überschreitet. Auf diesen Niveaus beginnt der Preis im Vergleich zu früher im Berichtszeitraum an Dynamik zu verlieren, daher ist es ein guter Zeitpunkt, um sicherzustellen, dass Sie keine neuen Positionen eingehen. Dieser Indikator zeigt Ihnen, wo dies in Ihrem Diagramm wahrscheinlich passieren wird, und zeigt die Niveaus für tägliche, wöchentliche und monatliche Zeiträume an. Wenn Sie seh
TheStrat FTFC MT5
Robert Gerald Wood
FTFC bezieht sich auf Full Timeframe Continuity, wie in Rob Smiths   The Strat   definiert. Dieser Indikator zeichnet zwei Linien auf dem Chart, eine der höchsten der vierteljährlichen, monatlichen, wöchentlichen, täglichen oder stündlichen Eröffnungsniveaus und die zweite der niedrigsten dieser Werte. Dadurch erhalten Sie einen Kanal, über oder unter dem der Handel eher sehr stark in eine Richtung verläuft. Zwischen den Linien wird die Preisbewegung abgehackter und Sie können breitere Stopps ve
This indicator will draw patterns based on   Rob Smith's   The Strat   as they emerge in real time on your chart. As price evolves,   TheStrat   offers 18 distinct price action patterns that can help you get good entries in the market. Each pattern involves two or three candles, and this indicator will draw a bounding box around the candles and name the pattern. The indicator also shows when a potential setup is forming, known by stratters as an Actionable signal. Candles Each candle is de
Pivot-Ebenen sind eine etablierte technische Ebene, die in jedem Markt anerkannt ist. Dieser Indikator zeichnet die aktuellen vierteljährlichen, monatlichen, wöchentlichen, täglichen und vierstündlichen Pivots für jedes Symbol auf dem Chart. Sie können auch die Unterstützungs- und Widerstandsstufen für jeden Zeitraum anzeigen und auswählen, welche von Stufen 1 bis 4 angezeigt werden sollen.     Wählen Sie den Pivot-Typ aus: Standard Camarilla DeMark Woodie Fibonacci Bitte beachten Sie, dass DeMa
Die Märkte lieben runde Zahlen wirklich und sie wirken oft als Unterstützung in einem fallenden Markt oder als Widerstand, wenn der Preis steigt. Dieser Indikator wurde entwickelt, um Preisniveaus bei runden Werten zu zeichnen. Dies geschieht automatisch, aber Sie haben auch die Möglichkeit, dies zu überschreiben und die Ebenen zu bestimmen, die Sie sehen möchten. Ein rundes Niveau kann so einfach sein wie 10er-Schritte, also 10, 20, 30 usw., oder wenn Sie mit Forex arbeiten, möchten Sie viellei
ATR Extremes MT5
Robert Gerald Wood
Average True Range (ATR) ist ein häufig verwendeter Indikator, der das Ausmaß der Preisbewegung über eine festgelegte Dauer misst. Der Wert, den es gibt, ist jedoch nicht innerhalb irgendeiner Grenze definiert, was es fast unmöglich macht, es für etwas anderes als Stop-Loss- oder Take-Profit-Berechnungen zu verwenden. Dieser Indikator ist Ihr Standard-ATR-Indikator, aber wir haben Perzentil-Abgrenzungen eingeführt, damit Sie die Extreme sehen können. Sie können zwischen Perzentilen und etwas wäh
Spannenerschöpfung tritt auf, wenn der Preis die erwartete Spanne für den aktuellen Zeitraum erreicht oder überschreitet. Auf diesen Niveaus beginnt der Preis im Vergleich zu früher im Berichtszeitraum an Dynamik zu verlieren, daher ist es ein guter Zeitpunkt, um sicherzustellen, dass Sie keine neuen Positionen eingehen. Dieser Indikator zeigt Ihnen, wo dies in Ihrem Diagramm wahrscheinlich passieren wird, und zeigt die Niveaus für tägliche, wöchentliche und monatliche Zeiträume an. Wenn Sie seh
Auswahl:
renetrader07
130
renetrader07 2023.11.23 18:19 
 

Great help for filtering markets to improve probability

Robert Gerald Wood
4238
Antwort vom Entwickler Robert Gerald Wood 2023.11.23 18:20
Thanks for the review, and very happy you like the indicator.
Antwort auf eine Rezension
Version 1.21 2021.10.22
Bug fix for issue with display on day trader mode.
Speed enhancement on startup
Version 1.20 2021.10.20
New Feature!
You can now toggle between a Day Trader view, showing M5, M15, M30, H1, H4 and D1 or the Swing Trader view with H1, D1, W1, MN1, Q and Y timeframes displayed.