TheStrat Monitor MT5
- 指标
- 版本: 1.21
- 更新: 22 十月 2021
- 激活: 10

如果您还没有了解Strat 交易策略,现在就去谷歌搜索吧。我保证这不会浪费您的时间,而且无论您是否使用它,您都可能会学到一些新技巧。
好的,现在您知道 TheStrat 是什么,您将能够理解该指标可以为您做什么。
主要特征
简而言之,该指标将:
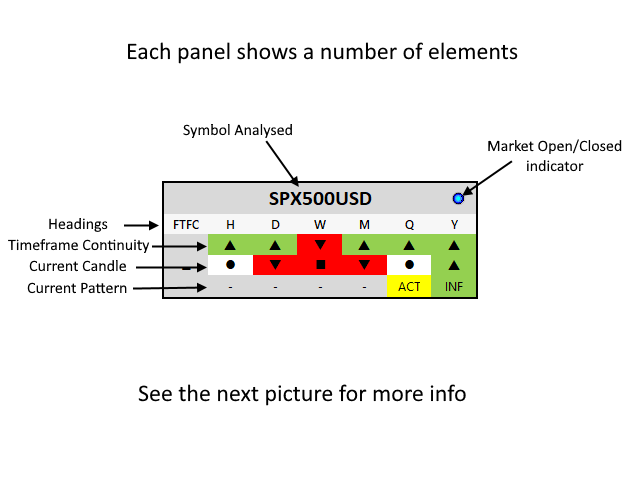
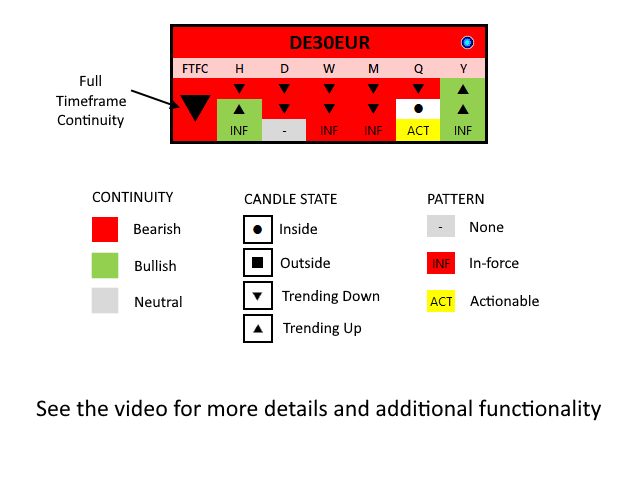
- 显示所有支持的时间范围的时间范围连续性
- 支持两种时间视图,即日交易者和波段交易者
- 显示任何 4 个连续时间帧的全时间帧连续性何时到位
- 显示每个时间范围的当前蜡烛状态
- 显示所有时间范围内的当前形态(如果有)
- 显示有效和可操作模式
- 每 5 秒更新一次(可从 1 秒开始配置)
- 允许您单击面板以在选定的交易品种和时间范围内打开图表
- 您可以选择用于打开图表的图表模板
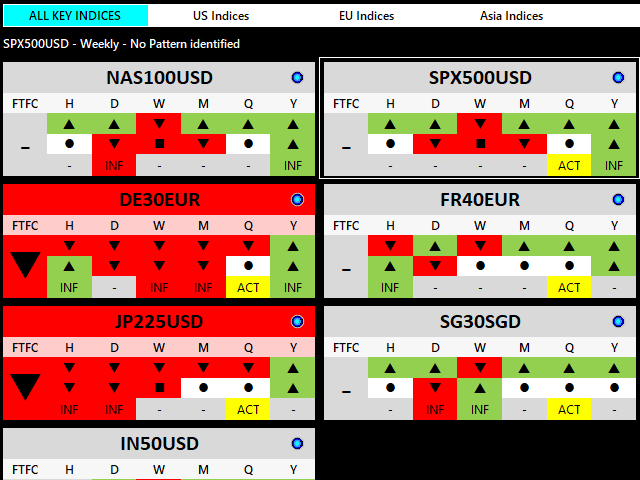
- 您选择要显示的组和这些组中的符号
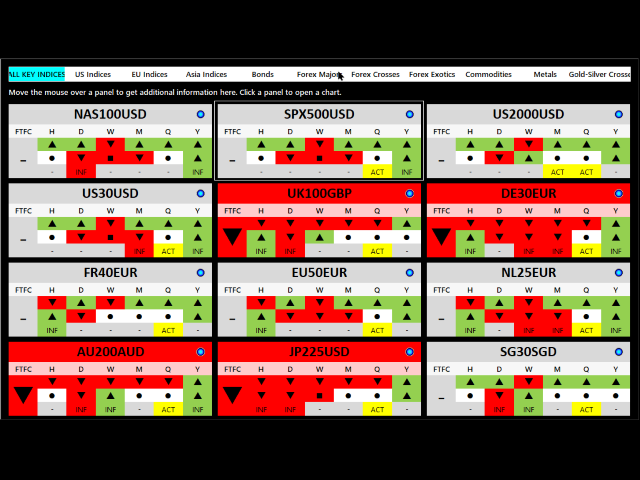
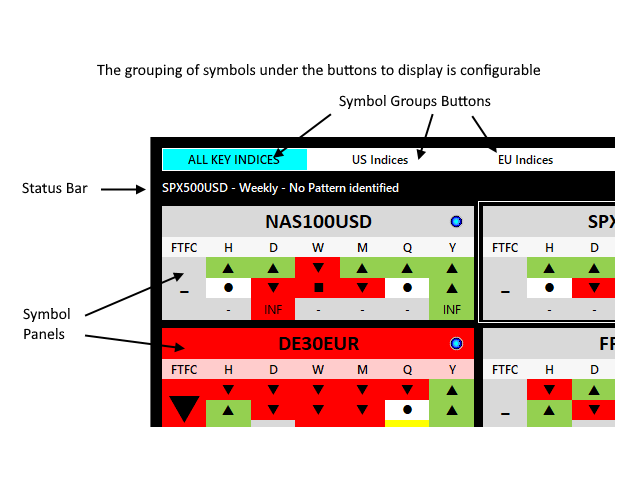
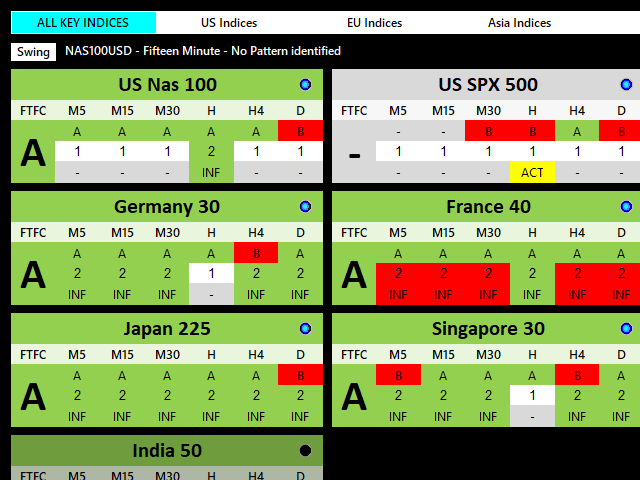
该指标显示您经纪商支持的任何交易品种的所有关键 Strat 元素、时间框架连续性、当前模式和当前蜡烛状态的快照概览。它针对所有受支持的时间范围执行此操作,因此您可以准确地看到市场上正在发生的事情。
您可以根据需要对符号进行分组,并选择与每个组相关的按钮的标题。同时在屏幕上显示特定类型的所有符号可以让您发现整个组的相似之处,从而有助于您的分析。
有关配置文件的更多信息可在此处找到: https ://www.mql5.com/en/blogs/post/746142
如果某个符号当前不可交易、市场关闭、经纪商禁用等,则符号面板将显示最新的可用数据,但显示会变灰。一个小的 LED 灯图标也显示了这一点。
设置
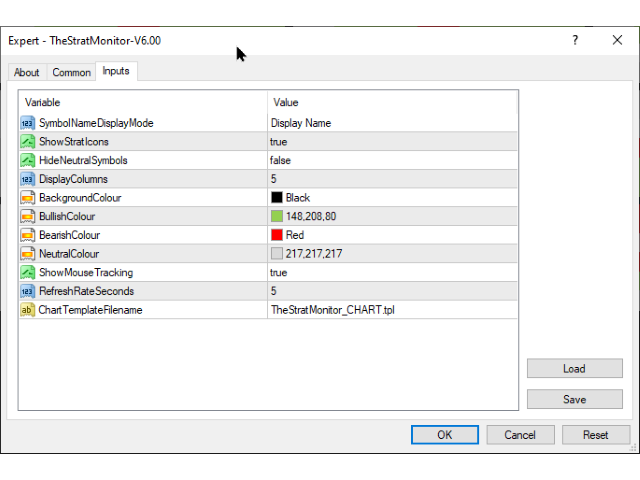
符号名称显示模式
从名称、描述或两者中选择每个符号面板的标题。
时间设定
设置指示器的默认时间设置视图。从日内交易者或波段交易者中选择。您可以随时单击屏幕上的按钮更改此设置。
Day Trader 视图在每个面板上显示 M5、M15、M30、H1、H4 和 D1 时间帧,而 Swing Trader 视图显示 H1、D1、W1、MN1、Q 和 Y。
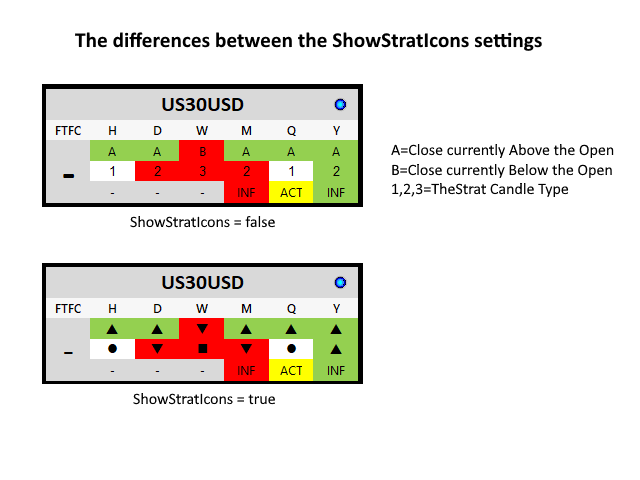
显示StratIcons
为真时,面板显示连续性方向、当前蜡烛状态、形态和整体 FTFC 的图标。
隐藏中性符号
如果为真,则隐藏任何没有 FTFC 方向的符号。
显示列
您希望在图表中显示多少列面板。
显示鼠标跟踪
如果为真,则在鼠标当前位于的符号面板周围绘制一个轮廓。
刷新率秒数
默认值为 5,这意味着每个面板的数据每 5 秒更新一次。该值必须是正整数,因此大于 0
图表模板文件名
打开图表时使用的模板文件名。如果找不到给定的模板,将使用默认模板。
背景色
看涨颜色
看跌颜色
中性色
从标准 MetaTrader 选择中选择您希望使用的颜色。
Great help for filtering markets to improve probability