TheStrat Monitor MT5

5

Se você ainda não aprendeu sobre a estratégia de negociação The Strat , vá ao Google agora. Prometo que não será uma perda de tempo e você provavelmente aprenderá alguns truques novos, quer os use ou não.

OK, agora que você sabe o que é TheStrat, você será capaz de entender o que este indicador pode fazer por você.

Características principais

Em suma, o Indicador irá:

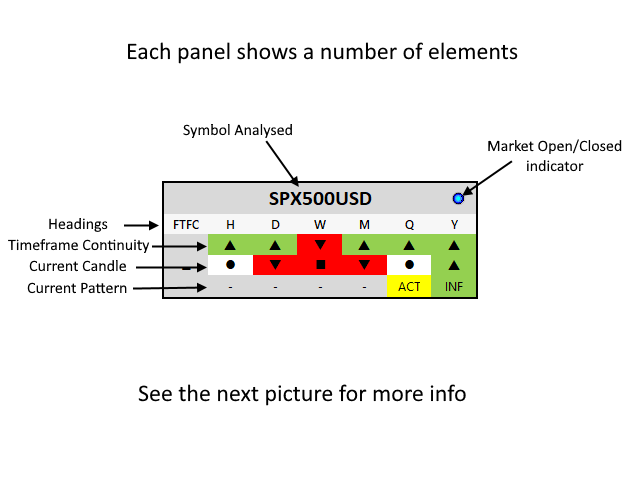
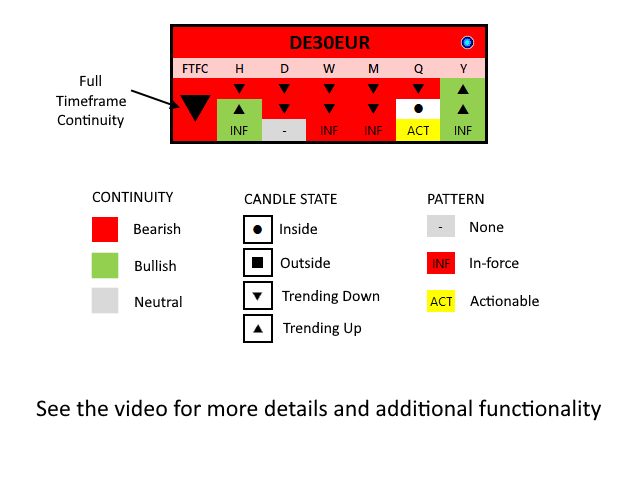
  • Mostrar continuidade de cronograma para todos os cronogramas suportados
  • Compatível com duas exibições de horário, Day trader e Swing trader
  • Mostrar quando a Continuidade do período de tempo completo estiver em vigor para quaisquer 4 períodos de tempo consecutivos
  • Mostrar o estado atual da vela para cada período de tempo
  • Mostre o padrão atual, se houver, em todos os prazos
  • Mostra padrões em vigor e acionáveis
  • Atualização a cada 5 segundos (configurável a partir de 1 segundo)
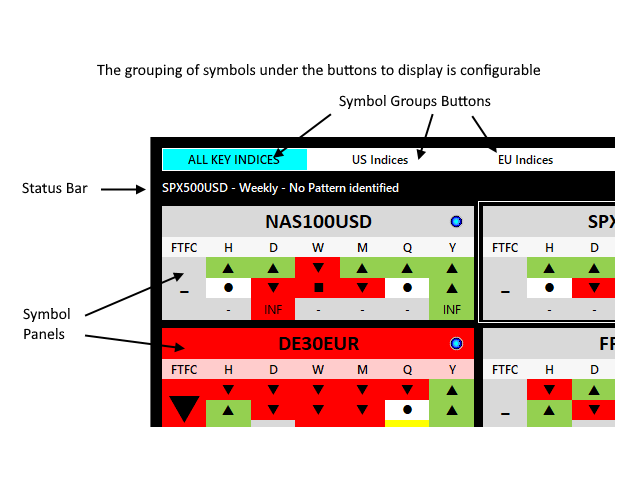
  • Permite que você clique no painel para abrir um gráfico no símbolo e período de tempo selecionados
  • Você pode escolher qual modelo de gráfico será usado para abrir gráficos
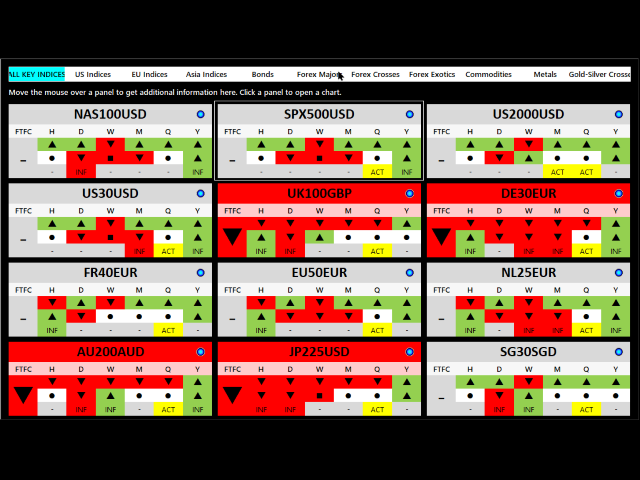
  • Você escolhe quais grupos e símbolos desses grupos serão exibidos

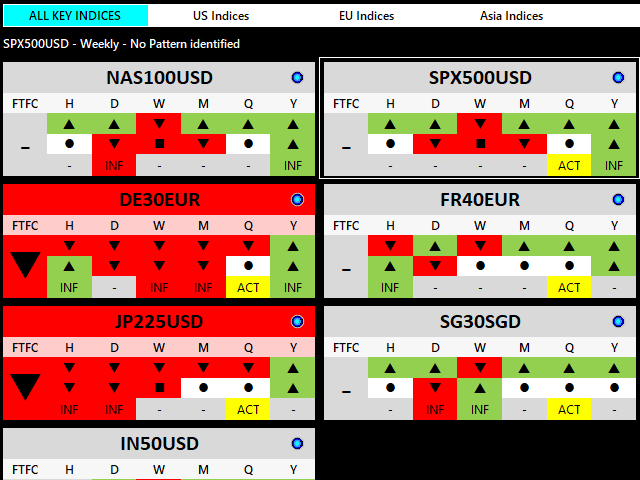
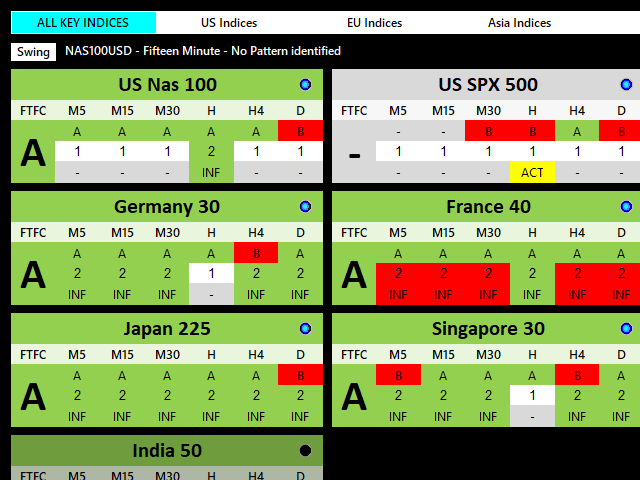
O indicador exibe uma visão geral instantânea de todos os principais elementos Strat, continuidade do período de tempo, padrões atuais e estados de velas atuais de qualquer símbolo suportado por seu corretor. Ele faz isso para todos os prazos suportados para que você possa ver exatamente o que está acontecendo agora no mercado.

Você pode agrupar os símbolos como desejar e escolher o título dos botões relativos a cada grupo. Ter todos os símbolos de um determinado tipo na tela ao mesmo tempo permite identificar semelhanças no grupo, auxiliando sua análise.

Mais informações sobre o arquivo de configuração podem ser encontradas aqui: https://www.mql5.com/en/blogs/post/746142

Se um símbolo estiver atualmente não negociável, mercado fechado, corretor desativado, etc., o painel de símbolos mostrará os últimos dados disponíveis, mas a tela ficará esmaecida. Um pequeno ícone de luz LED também mostra isso.
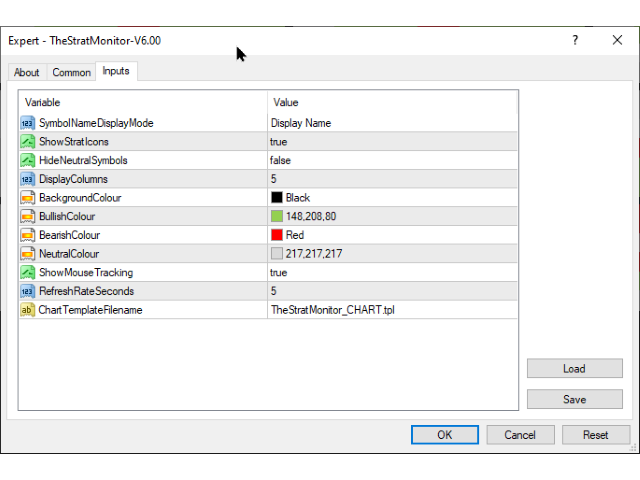
CONFIGURAÇÕES

SymbolNameDisplayMode

Escolha entre Nome, Descrição ou Ambos para a legenda de cada painel de símbolo.

Horário definido

Define a visualização do conjunto de tempo padrão para o indicador. Escolha entre Day Trader ou Swing Trader. Você pode alterar essa configuração a qualquer momento clicando no botão na tela.

A visualização Day Trader mostra os prazos M5, M15, M30, H1, H4 e D1 em cada painel, enquanto a visualização Swing Trader mostra H1, D1, W1, MN1, Q e Y.
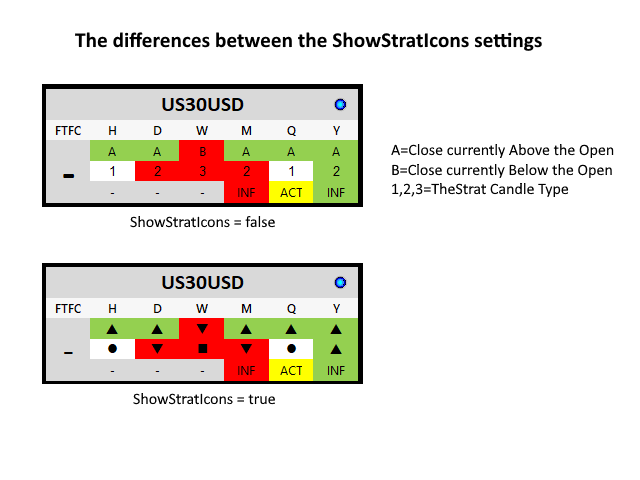
ShowStratIcons

Quando verdadeiro, os painéis exibem ícones para a direção de continuidade, estados de velas atuais, padrões e FTFC geral.

OcultarSímbolosNeutros

Quando verdadeiro, quaisquer símbolos que não tenham uma direção FTFC são ocultados.

Colunas de Exibição

Quantas colunas do painel você deseja exibir no gráfico.

ShowMouseTracking

Quando true, um contorno é desenhado ao redor do painel de símbolos sobre o qual o mouse está atualmente.

RefreshRateSeconds

O padrão é 5, o que significa simplesmente que os dados de cada painel são atualizados a cada 5 segundos. O valor deve ser um número inteiro positivo, então algo maior que 0

ChartTemplateFilename

O nome do arquivo do modelo a ser usado ao abrir um gráfico. Se o modelo fornecido não puder ser encontrado, o modelo padrão será usado.


Cor de fundo

BullishColor

Bearish Color

Cor Neutra

Escolha a cor que deseja usar na seleção padrão do MetaTrader.


Comentários 1
renetrader07
135
renetrader07 2023.11.23 18:19 
 

Great help for filtering markets to improve probability

Produtos recomendados
Owl Smart Levels MT5
Sergey Ermolov
4.03 (32)
Versão MT4  |  FAQ O Indicador Owl Smart Levels é um sistema de negociação completo dentro de um indicador que inclui ferramentas populares de análise de mercado, como fractais avançados de Bill Williams , Valable ZigZag que constrói a estrutura de onda correta do mercado e níveis de Fibonacci que marcam os níveis exatos de entrada no mercado e lugares para obter lucros. Descrição detalhada da estratégia Instruções para trabalhar com o indicador Consultor de negociação Owl Helper Chat privado d
STRICTLY FOR BOOM INDEX ONLY!!!!! Here I bring the Maximum Trend Arrows OT1.0 MT5 indicator. This indicator is made up of a combination of different trend indicators for entries and exits, for entries an orange arrow will paint on the chart below the current market and a red flag for closing of trades and it produces buy arrows only. When the orange arrow appears, it will appear along with it's sound to notify you. The 1H timeframe is recommended, don't use it anywhere else than on the 1H timefr
All about time and price by ICT. This indicator provides a comprehensive view of ICT killzones, Silver Bullet times, and ICT Macros, enhancing your trading experience.  In those time windows price either seeks liquidity or imbalances and you often find the most energetic price moves and turning points. Features: Automatic Adaptation: The ICT killzones intelligently adapt to the specific chart you are using. For Forex charts, it follows the ICT Forex times: In EST timezone: Session: Asia: 20h00-0
Renko System
Marco Montemari
This indicator can be considered as a trading system. It offers a different view to see the currency pair: full timeless indicator, can be used for manual trading or for automatized trading with some expert advisor. When the price reaches a threshold a new block is created according to the set mode. The indicator beside the Renko bars, shows also 3 moving averages. Features renko mode median renko custom median renko 3 moving averages wicks datetime indicator for each block custom notification
Order Book, known also as Market Book, market depth, Level 2, - is a dynamically updated table with current volumes of orders to buy and to sell specific financial instument at price levels near Bid and Ask. MetaTrader 5 provides the means for receiving market book from your broker, but in real time only, without access to its history. The indicator OrderBook Cumulative Indicator accumulates market book data online and visualizes them on the chart. In addition, the indicator can show the market
Donchian Channel DC is the indicator of Donchian Channels, that plots maximum and minimum values of a specific period, besides mean value line. It´s possible to configure simple period for analysis and the indicator will plot all three values. You can trade with this indicator as trend or reversal, according to each strategy. Do not let to test others indicators as soon as others expert advisors.
The  SuperTrend Advance Trading  is a widely-used technical indicator based on  SuperTrend Strategy + Price Action + EMA . How it works: -  Buy/Sell Signals  can be generated when the trend reverses, the conditions of Price action, TrendLine and EMA are met. - After the  Signal  appears, be patient and wait until the candle closes, at that time place the order as soon as possible. You may have time to review your entry, consider whether it is a good entry or not. - Carefully review the entry, up
SMMA Bands Indicator
Elie Baptiste Granger
The SMMA Bands indicator is an advanced volatility-based trading tool that creates 6 dynamic support and resistance levels around an envelope formed by two Smoothed Moving Averages (SMMA).  This indicator combines the reliability of SMMA trend identification with the precision of standard deviation-based volatility bands, making it suitable for both trend-following and mean-reversion strategies. Every band has its own buffer for use in EA. feel free to make suggestions and add reviews , i will
The   Trendlines Oscillator   helps traders identify trends and momentum based on the normalized distances between the current price and the most recently detected bullish and bearish trend lines. The indicator features bullish and bearish momentum, a signal line with crossings, and multiple smoothing options. USAGE The   Trendlines Oscillator   works by systematically: Identifying pivot highs and lows. Connecting pivots to form bullish (support) and bearish (resistance) trendlines. Measuring
# DRAWDOWN INDICATOR V4.0 - The Essential Tool to Master Your Trading ## Transform Your Trading with a Complete Real-Time Performance Overview In the demanding world of Forex and CFD trading, **knowing your real-time performance** isn't a luxury—it's an **absolute necessity**. The **Drawdown Indicator V4.0** is much more than a simple indicator: it's your **professional dashboard** that gives you a clear, precise, and instant view of your trading account status. --- ## Why This Indicator
Weis Wave Scouter
Jean Carlos Martins Roso
Descubra o poder da análise avançada de volume com o Weis Wave Scouter, um indicador revolucionário para MetaTrader 5 que combina os princípios consagrados do método Wyckoff e da análise VSA (Volume Spread Analysis). Desenvolvido para traders que buscam precisão e profundidade em suas operações, este indicador oferece uma leitura tática do mercado por meio da análise de ondas de volume cumulativo, ajudando a identificar pontos-chave de reversão e continuação de tendência. O Weis Wave Scouter a
##   ONLY GOLD ##   Тiльки Золото ## **Mercaria Professional Trading Zones - Complete Guide** ## **Mercaria Professional Trading Zones - Повний посібник** ### **How Mercaria Zones Work / Як працюють зони Mercaria** **English:** Mercaria Zones is an advanced trading indicator that identifies high-probability support and resistance areas using ZigZag extremes combined with mathematical zone calculations. The indicator works on multiple timeframes simultaneously, providing a comprehensive view
Terra Infinity is a flat indicator. This improved version of the CalcFlat indicator has three additional lines that significantly increase its effectiveness. Unlike its predecessor with two static levels, Terra Infinity adds three dynamic lines above the main histogram, which are interpreted as follows: base signal line, minimum signal line, maximum signal line. These lines are formed using the additional parameter Avg, which is the average value of the histogram. Averaging produces a line cl
Follow The Line MT5
Oliver Gideon Amofa Appiah
4.6 (35)
This indicator obeys the popular maxim that: "THE TREND IS YOUR FRIEND" It paints a GREEN line for BUY and also paints a RED line for SELL. (you can change the colors). It gives alarms and alerts of all kinds. IT DOES NOT REPAINT and can be used for all currency pairs and timeframes. Yes, as easy and simple as that. Even a newbie can use it to make great and reliable trades. NB: For best results, get my other premium indicators for more powerful and reliable signals. Get them here: https://www.m
FREE
Half ma
Artem Svistunov
The Half ma arrow indicator for the MetaTrader 5 trading terminal is a simple but effective tool that gives a signal about a change in the current trend. The Half ma indicator looks like a solid dynamic line that changes color at the points where the trend changes. At these points, the indicator draws arrows of the corresponding color and direction.The Half ma arrow indicator for the MT5 terminal is not an independent source of input signals. It will be most effective to use it as a trend filte
Universal Soul Reaper
Pieter Gerhardus Van Zyl
Universal Soul Reaper is an atmospheric market-flow oscillator designed to interpret price behavior as a cycle of spiritual energy. Instead of reacting to raw price alone, it visualizes the state of the market’s soul —revealing when momentum is awakening, stabilizing, or fading. The indicator operates in a separate window and presents three interwoven entities: the Ectoplasmic Veil , the Spirit Boundary , and the Soul Core . Together, they form a living framework that helps traders sense pressu
Mario Order Blocks
Sandeep Kumar Tiwary
Mario Order Block Indicator Overview The Professional Order Block Indicator is an advanced technical analysis tool that automatically identifies and displays institutional order blocks on your chart. Based on smart money concepts, this indicator helps traders identify high-probability support and resistance zones where institutional traders have placed significant orders. Key FeaturesAutomatic Order Block Detection Identifies bullish and bearish order blocks based on pivot point analysis Uses so
Candle Fusion Pro
Martin Alejandro Bamonte
Candle Fusion Pro — Reconhecimento de Padrões + Filtro de Tendência + Filtro de Momentum (Sem Repaint) Detecte formações de velas poderosas e confirme sua força com análise de tendência e momentum em tempo real. Candle Fusion Pro é a ferramenta visual definitiva para traders que confiam na precisão da ação do preço , estrutura de tendência e confirmações múltiplas . Principais Recursos Entradas Baseadas em Padrões : Detecta mais de 10 padrões japoneses avançados , incluindo: Estrelas cadentes
Renko Plus
Eadvisors Software Inc.
Com o Renko Plus você consegue utilizar os recursos na funcionalidade Indicador, basta adicioná-lo ao gráfico do Metatrader5.             O gráfico Renko é um tipo de gráfico, desenvolvido pelos japoneses, que é construído usando o movimento de preços em vez de preços e intervalos de tempo padronizados, como a maioria dos gráficos. Acredita-se que tenha o nome da palavra japonesa para tijolos, "renga", já que o gráfico se parece com uma série de tijolos.             Um novo tijolo
Trend Lines Scalper
Magdalena Estefania Colonna
TREND LINES Scalper Professional Indicator OVERVIEW Trend Lines Scalper is a highly accurate, advanced indicator designed specifically for professional traders looking to maximize their scalping opportunities by automatically detecting trend lines and high-probability signals. This powerful algorithm combines classic technical analysis with modern technology, automatically identifying price patterns and generating accurate, real-time signals for successful scalping trades. MAIN FEATURES
Statistical Arbitrage Spread Generator for Cointegration [MT5] What is Pair Trading? Pair trading is a market-neutral strategy that looks to exploit the relative price movement between two correlated assets — instead of betting on the direction of the market. The idea? When two assets that usually move together diverge beyond a statistically significant threshold, one is likely mispriced. You sell the expensive one, buy the cheap one , and profit when they converge again. It’s a statistica
FREE
Trend Monitor MT5
Pavel Zamoshnikov
4.5 (2)
The indicator generates early signals basing on ADX reading data combined with elements of price patterns. Works on all symbols and timeframes. The indicator does not redraw its signals. You see the same things on history and in real time. For better visual perception signals are displayed as arrows (in order not to overload the chart). Features The best results are obtained when the indicator works on two timeframes. For example: M30 – the indicator shows the main trend; M5 – the indicator gen
Noize Absorption Index - is the manual trading system that measures the difference of pressure between bears forces and bulls forces. Green line - is a noize free index that showing curent situation. Zero value of index shows totally choppy/flat market.Values above zero level shows how powerfull bullish wave is and values below zero measures bearish forces.Up arrow appears on bearish market when it's ready to reverse, dn arrow appears on weak bullish market, as a result of reverse expectation.
TrendDetect
Pavel Gotkevitch
The Trend Detect indicator combines the features of both trend indicators and oscillators. This indicator is a convenient tool for detecting short-term market cycles and identifying overbought and oversold levels. A long position can be opened when the indicator starts leaving the oversold area and breaks the zero level from below. A short position can be opened when the indicator starts leaving the overbought area and breaks the zero level from above. An opposite signal of the indicator can b
Price manipulation risk
Vincent Albert Feugier
Price Manipulation Risk Indicator Advanced Tool for Market Risk Evaluation & Manipulation Detection Price Manipulation Risk Indicator is a professional tool designed to measure the current risk level in the market. It evaluates price behavior, market activity, and candle dynamics to detect unstable or potentially manipulated environments. This indicator helps traders avoid traps , filter false signals , and improve timing in both entries and exits. Product Purpose Provide an immediate a
The RSI Divergence + FVG Signal indicator combines Relative Strength Index (RSI) Divergence with Fair Value Gap (FVG) detection to generate high-probability buy and sell signals based on both momentum shifts and institutional imbalance zones. Core Features: RSI Divergence Detection : Identifies both regular and hidden bullish/bearish divergences between price and RSI. Divergences indicate potential trend reversals or continuation. FVG Zone Recognition : Detects Fair Value Gaps (imbalances caused
HMA Trend Professional MT5
Pavel Zamoshnikov
4.25 (4)
Improved version of the free HMA Trend indicator (for MetaTrader 4) with statistical analysis. HMA Trend is a trend indicator based on the Hull Moving Average (HMA) with two periods. HMA with a slow period identifies the trend, while HMA with a fast period determines the short-term movements and signals in the trend direction. The main differences from the free version: Ability to predict the probability of a trend reversal using analysis of history data. Plotting statistical charts for analyzi
O nível Premium é um indicador único com mais de 80% de precisão nas previsões corretas! Este indicador foi testado pelos melhores Especialistas em Negociação por mais de dois meses! O indicador do autor você não encontrará em nenhum outro lugar! A partir das imagens você pode ver por si mesmo a precisão desta ferramenta! 1 é ótimo para negociar opções binárias com um tempo de expiração de 1 vela. 2 funciona em todos os pares de moedas, ações, commodities, criptomoedas Instruções: Assim
Ichimoku Aiko MTF
Michael Jonah Randriamampionontsoa
Ichimoku Aiko MTF is a collection of technical indicators that show support and resistance levels, as well as momentum and trend direction. It is a multi-timeframe indicator so you don't need to change the chart timeframe when you want to see the ichimoku clouds on a higher timeframe.  eg. The chart timeframe is M15 and you want to see on the M15 timeframe chart the H1 ichimoku indicators (the ichimoku in Metatrader can't do that) that's why you need to use Ichimoku Aiko MTF.
SimSim Arrow KijunSen Plus MA é um indicador de seta proprietário. Versão do indicador original com linhas KijuSen e MA. Versão para MetaTrader 4 O indicador gera um sinal quando a linha Kijun-sen cruza a linha MA. Active o "CONTROL DEAL" para operação e as negociações baseadas no sinal do indicador serão abertas automaticamente.. Pode utilizar o indicador para a finalidade pretendida, como um dispositivo de sinalização fiável. No entanto, o seu propósito secundário é servir como fornecedor de
Os compradores deste produto também adquirem
ARICoins
Temirlan Kdyrkhan
ARICoin is a powerful trading companion designed to generate high-probability entry signals with dynamic TP/SL/DP levels based on volatility. Built-in performance tracking shows win/loss stats, PP1/PP2 hits, and success rates all updated live. Key Features: Buy/Sell signals with adaptive volatility bands Real-time TP/SL/DP levels based on ATR Built-in MA Filter with optional ATR/StdDev volatility Performance stats panel (Success, Profit/Loss, PP1/PP2) Alerts via popup, sound, push, or email Cust
AriX
Temirlan Kdyrkhan
1 (4)
AriX Indicator for MT5 A powerful trend-following and signal-evaluation tool AriX is a custom MT5 indicator that combines Moving Averages and ATR-based risk/reward logic to generate clear buy/sell signals. It visualizes dynamic SL/TP levels, evaluates past trade outcomes, and displays win/loss statistics in a clean on-chart panel. Key features include: Buy/Sell signals based on MA crossovers ATR-based SL/TP1/TP2/TP3 levels with visual lines and labels Signal outcome tracking with real-time stat
ARIScalping
Temirlan Kdyrkhan
ARIScalp is a powerful trading companion designed to generate high-probability entry signals with dynamic TP/SL/DP levels based on volatility. Built-in performance tracking shows win/loss stats, PP1/PP2 hits, and success rates all updated live. Key Features: Buy/Sell signals with adaptive volatility bands Real-time TP/SL/DP levels based on ATR Built-in MA Filter with optional ATR/StdDev volatility Performance stats panel (Success, Profit/Loss, PP1/PP2) Alerts via popup, sound, push, or email Cus
Azimuth Pro
Ottaviano De Cicco
5 (1)
PROMOÇÃO DE LANÇAMENTO O preço do Azimuth Pro está inicialmente definido em 299$ para os primeiros 100compradores. O preço final será de 499$ . A DIFERENÇA ENTRE ENTRADAS RETAIL E INSTITUCIONAIS NÃO É O INDICADOR — É A LOCALIZAÇÃO. A maioria dos traders entra em níveis de preço arbitrários, perseguindo momentum ou reagindo a sinais atrasados. As instituições esperam o preço atingir níveis estruturados onde oferta e demanda realmente mudam. Azimuth Pro mapeia esses níveis automaticamente: VWA
Weis Wave with Alert MT5
Trade The Volume Waves Single Member P.C.
4.94 (17)
Rental/Lifetime Package Options and Privileges  Rent Monthly Six Months   Yearly/Lifetime Weis Wave with Speed with Alert+Speed Index x x x Manual  x x x Quick Set up Video x x x Blog x x x Lifetime Updates x x x Setup and Training Material x x Discord Access Channel "The SI traders"          x Rectangle Break Alert Tool      x How to trade with it:    http://www.tradethevolumewaves.com   ** If you purchase please contact me to setup your  : Training Room and  complete manual access.  Wei
Antes de tudo, vale ressaltar que esta Ferramenta de Negociação é um Indicador Não Repintante, Não Redesenhante e Não Atrasado, o que a torna ideal para negociação profissional. Curso online, manual do utilizador e demonstração. O Indicador de Conceitos de Ação de Preço Inteligente é uma ferramenta muito poderosa tanto para traders novos quanto experientes. Ele combina mais de 20 indicadores úteis em um único, combinando ideias avançadas de negociação como Análise do Trader do Círculo Interno
MetaForecast M5
Vahidreza Heidar Gholami
5 (3)
MetaForecast prevê e visualiza o futuro de qualquer mercado com base nas harmonias nos dados de preços. Embora o mercado nem sempre seja previsível, se houver um padrão nos preços, o MetaForecast pode prever o futuro com a maior precisão possível. Em comparação com outros produtos similares, o MetaForecast pode gerar resultados mais precisos ao analisar as tendências do mercado. Parâmetros de entrada Past size (Tamanho do passado) Especifica o número de barras que o MetaForecast usa para criar
ARIPoint
Temirlan Kdyrkhan
1 (1)
ARIPoint is a powerful trading companion designed to generate high-probability entry signals with dynamic TP/SL/DP levels based on volatility. Built-in performance tracking shows win/loss stats, PP1/PP2 hits, and success rates all updated live. Key Features: Buy/Sell signals with adaptive volatility bands Real-time TP/SL/DP levels based on ATR Built-in MA Filter with optional ATR/StdDev volatility Performance stats panel (Success, Profit/Loss, PP1/PP2) Alerts via popup, sound, push, or email Cu
Quantas vezes você comprou um indicador de negociação com ótimos backtests, prova de desempenho em conta real com números fantásticos e estatísticas por toda parte, mas depois de usá-lo, você acaba perdendo sua conta? Você não deve confiar em um sinal por si só, você precisa saber por que ele apareceu em primeiro lugar, e é isso que o RelicusRoad Pro faz de melhor! Manual do Usuário + Estratégias + Vídeos de Treinamento + Grupo Privado com Acesso VIP + Versão Móvel Disponível Uma Nova Maneira d
Max Ribbon Mt5
Stefano Frisetti
WARNING: This indicator is distributed EXCLUSIVELY on MQL5.com MT4 version:   https://www.mql5.com/it/market/product/160363 MT5 version:   https://www.mql5.com/it/market/product/160410 ============================================================================================= MAX RIBBON ver 1.00 The indicator that shows you the TREND clearly and unambiguously! ============================================================================================= DESCRIPTION MAX RIBBON is an advanced tre
SynaptixQuant Dominance Matrix
Devie Arevalo Montemayor
5 (1)
SynaptixQuant Dominance Matrix: Institutional-Grade Market State Extraction Engineered for traders who require a data-driven view of market behaviour beyond surface-level indicators. The Synaptix Quant (SQ) Dominance Matrix is not a conventional currency strength display. Behind its intentionally streamlined interface runs a sophisticated analytical architecture designed to quantify market conditions with precision. Every output is generated through layered signal processing built to identify d
FOOTPRINTORDERFLOW: The Authoritative Guide ( This indicator is also compatible with economic providers that do not offer DOM data and BID/ASK data, It also supports various foreign exchange transactions ) 1. Overview FOOTPRINTORDERFLOW  is an advanced Order Flow analysis tool designed for MetaTrader 5 (MT5). Unlike traditional candlestick charts that only show OHLC (Open, High, Low, Close), this indicator parses real-time Tick data to visualize the microstructure inside every candle. It helps y
+++++++++++++++++++++++++++++++++++++++++++++++++++++++++++++++++++++++++++++++++++++++++++++++++ +++ Link to EURUSD Only Free Version -->  https://www.mql5.com/en/market/product/156904?source=Unknown +++++++++++++++++++++++++++++++++++++++++++++++++++++++++++++++++++++++++++++++++++++++++++++++++ Hallo Trader, This is a traditional GANN & FIBONACCI strategy based on detection of an impulsive move in the opposite direction. This is called a Breakout. At the moment of Breakout, the indicator draw
Hyperbolic
Konstantin Gruzdev
The indicator is stable on noise fluctuations in price and quickly reacts to the trend. It is based on an algorithm from a system of hyperbolic functions that allows you to aggressively smooth the flat with minimal lag on the trend. It can be applied directly to the price chart, to itself, or to other indicators in order to eliminate false signals. The main purpose of the indicator is to smooth out small sawtooth price movements as much as possible. The higher the Hyperbolic parameter, the stron
Prices move for many reasons and these can vary from one operator to another: software, private and institutional traders simultaneously contribute to the formation of the price, making predictive art very difficult. However, there are measurable factors that bind the price to an underlying trend in line with the physical reality that the financial asset represents: these are the macroeconomic indicators. Large investors use this information wisely to set their strategies. Understanding these m
Matreshka
Dimitr Trifonov
5 (2)
Matreshka self-testing and self-optimizing indicator: 1. Is an interpretation of the Elliott Wave Analysis Theory. 2. Based on the principle of the indicator type ZigZag, and the waves are based on the principle of interpretation of the theory of DeMark. 3. Filters waves in length and height. 4. Draws up to six levels of ZigZag at the same time, tracking waves of different orders. 5. Marks Pulsed and Recoil Waves. 6. Draws arrows to open positions 7. Draws three channels. 8. Notes support and re
Elliott Wave Trend was designed for the scientific wave counting. This tool focuses to get rid of the vagueness of the classic Elliott Wave Counting using the guideline from the template and pattern approach. In doing so, firstly Elliott Wave Trend offers the template for your wave counting. Secondly, it offers Wave Structural Score to assist to identify accurate wave formation. It offers both impulse wave Structural Score and corrective wave Structure Score. Structural Score is the rating to sh
Stop calculating lot sizes manually. Stop guessing your Risk/Reward ratio. The Risk Reward Tool brings the intuitive, visual trading style of TradingView directly to your MetaTrader 5 charts. It is designed for traders who value speed, precision, and visual clarity. Whether you trade Forex, Indices (DAX, US30), or Commodities (Gold, Oil), this tool handles the math for you. Simply click "Long" or "Short," drag the lines to your levels, and the tool instantly tells you exactly how many lots to t
TrendMaestro5
Stefano Frisetti
note: this indicator is for METATRADER4, if you want the version for METATRADER5 this is the link:  https://www.mql5.com/it/market/product/108106 TRENDMAESTRO ver 2.5 TRENDMAESTRO recognizes a new TREND from the start, he never makes mistakes. The certainty of identifying a new TREND is priceless. DESCRIPTION TRENDMAESTRO identifies a new TREND in the bud, this indicator examines the volatility, volumes and momentum to identify the moment in which there is an explosion of one or more of these da
Step into the world of Forex trading with confidence, clarity, and precision using Gold Indicator a next-generation tool engineered to take your trading performance to the next level. Whether you’re a seasoned professional or just beginning your journey in the currency markets, Gold Indicator equips you with powerful insights and help you trade smarter, not harder. Built on the proven synergy of three advanced indicators, Gold Indicator focuses exclusively on medium and long-term trends elimina
Obtenha o AUX GRATUITO e suporte EA  Download direto — Clique aqui [ D.I.C.E ] O DICE Indicator Divergence in Chaos Environment é uma ferramenta MT5 especializada criada para traders que aplicam a Teoria das Ondas de Elliott dentro das técnicas de Trading Chaos. Identifica divergências ocultas e regulares na ação do preço, sincronizadas com o ambiente de mercado caótico descrito por Bill Williams. Principais recursos Divergência alinhada com Ondas de Elliott: detecta divergências altistas e bai
Orderflow Scalp Pro v2.4   delivers institutional-grade trading intelligence through advanced volume analysis, dynamic VWAP calculations, real-time aggressive score monitoring, and precision arrow signals. This complete trading system transforms complex market data into clear, actionable signals for consistent profitability on 3-4 minute timeframes. Full Documentation: [Download PDF] Four Powerful Components in One System Volume Profile HeatMap with POC/VAH/VAL Transform your charts into inst
MonsterDash Harmonics Indicator is a harmonic pattern dashboard. It recognizes all major patterns. MonsterDash is a dashboard that displays all detected patterns for all symbols and (almost) all timeframes in sortable and scrollable format. Users can add their own user defined patterns . MonsterDash can open and update charts with the pattern found. Settings MonsterDash's default settings are good enough most of the time. Feel free to fine tune them to your needs. The color settings are for tho
The Volume Spread Analysis indicator is based on the original Volume Spread Analysis method. It was designed for quick and easy recognition of VSA patterns. Even though this indicator looks very simple, it is the most sophisticated tool we've ever made. It is a really powerful analytical tool that generates very reliable trading signals. Because it is very user-friendly and understandable, it is suitable for every type of trader, regardless of his experience. What is VSA? VSA - Volume Spread A
This indicator belongs to the family of channel indicators. These channel indicator was created based on the principle that the market will always trade in a swinging like pattern. The swinging like pattern is caused by the existence of both the bulls and bears in a market. This causes a market to trade in a dynamic channel. it is designed to help the buyer to identify the levels at which the bulls are buying and the bear are selling. The bulls are buying when the Market is cheap and the bears a
Obtenha o indicador AUX GRÁTIS, suporte para EA e o guia completo, por favor visite – https://www.mql5.com/en/blogs/post/763955 Detecte a Tendência. Leia o Padrão. Acerte a Entrada. 3 passos em menos de 30 segundos! Negocie sem esforço — sem necessidade de análise. Seu assistente inteligente está pronto para simplificar seu fluxo de trabalho Chega de sobrecarga de gráficos. Negocie com confiança usando detecção inteligente de viés. Compatível com todas as moedas, criptos, ações, metais, índice
First time on MetaTrader, introducing IQ Star Lines - an original Vedic Astrology based indicator. "Millionaires don't use astrology, billionaires do" . - J.P. Morgan, Legendary American financier and banker. IQ Star Lines, an unique astrological indicator purely based on   Vedic astrology   calculations, published for the   first time on Metatrader.  This unique tool plots dynamic planetary grid lines based on real-time stars, constellations, and celestial movements, which allows you to plot t
Presenting one-of-a-kind Gann Indicator for XAUUSD IQ Gold Gann Levels is a non-repainting, precision tool designed exclusively for XAUUSD/Gold intraday trading. It uses W.D. Gann’s square root method to plot real-time support and resistance levels, helping traders spot high-probability entries with confidence and clarity. William Delbert Gann (W.D. Gann) was an exceptional market analyst whose trading technique was based on a complex blend of mathematics, geometry, astrology, and ancient calcul
Elliot Waves Analyzer Pro
Viktor Weidenthal
2.67 (3)
Elliot Waves Analyzer Pro calculates Elliot Waves to Help Identify Trend direction and Entry Levels. Mainly for Swing Trading Strategies. Usually one would open a Position in trend direction for Wave 3 or a Correction for Wave C . This Indicator draws Target Levels for the current and next wave. Most important Rules for Elliot Wave Analysis are verified by the Indicator.  The Pro version analyzes Multiple Timeframes and shows the Subwaves and Target-Levels.   For an Overview  " Elliot Waves Anal
This indicator uses support and resistance, volume and some special formula to calculate the volume to filter the candles. If the volume reaches a specific value, And at the same time, Candle breaks the support/resistance line, There would be a signal and we can enter the market. Signals appear when the current candle closes. then you can enter the trade when a new candle appears. Please don't forget to follow your money management plan. MT4 Version Support/Resistance Breakout MT4 :   https:/
Mais do autor
Multi Chart Crosshairs MT5
Robert Gerald Wood
5 (4)
Este indicador foi projetado para tornar as revisões de muitos gráficos em diferentes escalas de tempo mais rápidas e fáceis de fazer. Acompanhe o tempo e o preço em vários gráficos Alterar símbolo em um gráfico e todos os outros gráficos do mesmo símbolo também serão alterados. Fácil de usar, rápido para dominar O indicador permite identificar o preço e a hora em que o ponteiro do mouse está no gráfico atual, em todos os outros gráficos abertos no mesmo Símbolo. Isso permite que você veja rapid
Multi Chart Crosshairs
Robert Gerald Wood
5 (1)
This indicator is designed to make reviews of many charts on different timescales quicker, and easier to do. Track Time and Price across multiple charts Change Symbol on one chart and all other charts of the same symbol will be changed too. Easy to use, quick to master The indicator allows you to identify the price and time where the mouse pointer is on the current chart, across all other charts open on the same Symbol. This allows you to quickly see information on multiple charts whereas normal
Chart Drawing Cloner
Robert Gerald Wood
5 (2)
Este script permite que você copie objetos de desenho de qualquer tipo, como linhas de tendência, Fibonachi Retracements etc, para um ou mais outros gráficos. Por padrão, o script copiará todos os objetos do gráfico atual, ou seja, o gráfico ao qual o script foi aplicado, para qualquer outro gráfico do mesmo símbolo atualmente carregado. Configurações Período de destino Quando definido como algo diferente de PERIOD_CURRENT, ele copiará os objetos para qualquer gráfico aberto do mesmo símbolo
FREE
This script allows you to toggle the "Show Trade Levels" option, but for the current chart only. Normally, you can only change the setting using the Options -> Chart menu for ALL charts, but this script allows you to do it for a SINGLE chart. I'm using it when I take screenshots, because most of the time I'm not trying to show the trades, just some functionality of one of my other tools. Iif you need that functionality, then this script is very helpful! If the script helps you, please let me k
FREE
A simple script that can delete all the drawing objects on a chart, or just the objects of a specific type. Settings: DeleteObjectsOfType By default the value will be blank which means ALL drawing objects on the chart will be deleted. If you only wish to delete specific types of drawing object, change this setting to the type of object to delete. For example, Fibonacci Retracement, Text, Label or Trend Line. Please see the demonstration video for more information.
FREE
Eu criei este indicador simples enquanto estava aprendendo sobre o TheStrat de Rob Smith e o achei tão útil que pensei em compartilhá-lo com você. Se você achar útil, veja os outros indicadores que publiquei no MQL5. O indicador simplesmente desenha uma única linha no gráfico mostrando o nível de preço que você seleciona em um período de tempo mais alto. Usando as configurações, você tem controle total sobre o período de tempo exibido, mas, por   padrão, ele calcula o período de tempo mais alto,
FREE
TheStrat Patterns
Robert Gerald Wood
This indicator will draw patterns based on Rob Smith's The Strat as they emerge in real time on your chart. As price evolves, TheStrat offers 18 distinct price action patterns that can help you get good entries in the market. Each pattern involves two or three candles, and this indicator will draw a bounding box around the candles and name the pattern. The indicator also shows when a potential setup is forming, known by stratters as an Actionable signal. Candles Each candle is defined by its
TheStrat Levels
Robert Gerald Wood
This indicator draws the prior Highs and Lows for multiple timeframes, and can display potential Take Profit and Stop Loss levels. In Rob Smith's # The Strat   terms,   these are potential entry points, or alternatively potential targets for open positions. I like to use them in both ways. On a lower timeframe, say 5 minutes to get a good entry on a daily or weekly level, and then as a potential target. Very small stops required giving an excellent risk/reward ratio. Please watch the DEMO video
TheStrat Candles
Robert Gerald Wood
5 (1)
Este indicador desenhará um rótulo acima ou abaixo de cada vela com base em       de Rob Smith       A Strat       à medida que se desenvolvem ao longo do tempo em seu gráfico. À medida que o preço evolui, uma vela pode alternar entre três estados. Quando a vela se abrir pela primeira vez, se ela ficar completamente dentro das velas anteriores altas e baixas, ela começará como um tipo 1. Com o passar do tempo, se quebrar a máxima ou a mínima da vela anterior, será um tipo 2, e se a ação do pre
TheStrat FTFC
Robert Gerald Wood
FTFC refere-se a Full Timeframe Continuity, conforme definido por Rob Smith's   The Strat   . Este indicador desenha duas linhas no gráfico, uma das mais altas dos níveis de abertura Trimestral, Mensal, Semanal, Diário ou Horário, e a segunda do mais baixo desses valores. Isso fornece um canal acima ou abaixo do qual é mais provável que a negociação seja muito forte em uma direção. Entre as linhas, a ação do preço será mais instável e você poderá usar paradas mais amplas. Uma terceira linha trac
Os mercados realmente adoram números redondos e geralmente atuam como suporte em um mercado em queda ou resistência quando os preços sobem. Este indicador é projetado para desenhar níveis de preços em valores redondos. Ele faz isso automaticamente, mas você também tem a opção de substituir isso e determinar os níveis que deseja ver. Um nível redondo pode ser tão simples quanto passos de 10, então 10, 20, 30 etc. ou se você estiver trabalhando com Forex, talvez queira ver mudanças em 0,1 ou 0,01.
TheStrat Monitor
Robert Gerald Wood
3.67 (3)
If you've not already learnt about The Strat trading strategy , go google it now. I promise it won't be a waste of your time, and you will likely learn some new tricks whether you use it or not. OK, so now you know what TheStrat is, you will be able to understand what this indicator can do for you. Key Features In short, the Indicator will: Show Timeframe Continuity for all supported timeframes Supports two timeset views, Day trader and Swing trader Show when Full Timeframe Continuity is in pla
Ao negociar usando   o The Strat   , é importante ficar de olho em vários prazos. Este indicador mostrará o estado Diário, Semanal, Mensal e Trimestral da vela atual para cada período de tempo. Um ícone de Círculo mostra que a vela nesse período de tempo é atualmente um Inside ou Type 1 na terminologia TheStrat. Uma vela Inside Day está consolidando a ação do preço e estamos procurando uma quebra do intervalo. Um ícone Triângulo, apontando para cima ou para baixo, é uma vela de tendência ou Tipo
Active Pivot Levels
Robert Gerald Wood
5 (1)
Os níveis de pivô são um nível técnico bem estabelecido e reconhecido em todos os mercados. Este indicador desenhará os atuais pivôs trimestrais, mensais, semanais, diários e de quatro horas no gráfico, para qualquer símbolo. Você também pode mostrar os níveis de Suporte e Resistência para cada período e escolher qual exibir dos níveis 1 a 4.     Escolha o tipo de pivô entre: Padrão Camarilha Dinamarca Woodie Fibonacci Observe que os pivôs DeMark têm um único nível de suporte e resistência de ac
ATR Extremes
Robert Gerald Wood
Average True Range (ATR) é um indicador comumente usado que mede a quantidade de movimento no preço ao longo de um período definido. No entanto, o valor que ele dá não é definido dentro de qualquer tipo de limite, o que torna quase impossível usá-lo para qualquer coisa que não seja o cálculo de stop loss ou take profit. Este indicador é o seu indicador ATR padrão, mas introduzimos demarcações de percentis para que você possa ver os extremos. Você pode escolher entre percentis e algo que chama
Range Exhaustion
Robert Gerald Wood
O esgotamento do intervalo ocorre quando o preço atinge ou excede o intervalo esperado para o período atual. Nesses níveis, o preço começa a perder seu ímpeto em relação ao início do período, portanto, é bom garantir que você não esteja assumindo novas posições. Este indicador mostrará onde é provável que isso aconteça em seu gráfico, mostrando os níveis para os períodos Diário, Semanal e Mensal. Quando você vê o preço excedendo esses níveis de exaustão, está dizendo que o momento por trás do mo
This indicator will draw a label above or below each candle based on   Rob Smith's   The Strat   as they develop over time on your chart. As price evolves, a candle can switch between three states. When the candle first opens, if it sits completely within the previous candles high and low, then it will start as a Type 1. As time moves on, if it breaks either the high or low of the previous candle, it will be come a type 2, and should the price action be volatile and directionless, it may then
TheStrat Levels MT5
Robert Gerald Wood
5 (1)
This indicator draws the prior Highs and Lows for multiple timeframes, and can display potential Take Profit and Stop Loss levels. In Rob Smith's # The Strat  terms, these are potential entry points, or alternatively potential targets for open positions. I like to use them in both ways. On a lower timeframe, say 5 minutes to get a good entry on a daily or weekly level, and then as a potential target. Very small stops required giving an excellent risk/reward ratio. Key Features  - Levels from Hou
TheStrat FTFC MT5
Robert Gerald Wood
FTFC refere-se a Full Timeframe Continuity, conforme definido por Rob Smith's   The Strat   . Este indicador desenha duas linhas no gráfico, uma das mais altas dos níveis de abertura Trimestral, Mensal, Semanal, Diário ou Horário, e a segunda do mais baixo desses valores. Isso fornece um canal acima ou abaixo do qual é mais provável que a negociação seja muito forte em uma direção. Entre as linhas, a ação do preço será mais instável e você poderá usar paradas mais amplas. Uma terceira linha trac
This indicator will draw patterns based on   Rob Smith's   The Strat   as they emerge in real time on your chart. As price evolves,   TheStrat   offers 18 distinct price action patterns that can help you get good entries in the market. Each pattern involves two or three candles, and this indicator will draw a bounding box around the candles and name the pattern. The indicator also shows when a potential setup is forming, known by stratters as an Actionable signal. Candles Each candle is defin
TheStrat TFC Monitor MT5
Robert Gerald Wood
5 (1)
Ao negociar usando   o The Strat   , é importante ficar de olho em vários prazos. Este indicador mostrará o estado Diário, Semanal, Mensal e Trimestral da vela atual para cada período de tempo. Um ícone de Círculo mostra que a vela nesse período de tempo é atualmente um Inside ou Type 1 na terminologia TheStrat. Uma vela Inside Day está consolidando a ação do preço e estamos procurando uma quebra do intervalo. Um ícone Triângulo, apontando para cima ou para baixo, é uma vela de tendência ou Tipo
Os níveis de pivô são um nível técnico bem estabelecido e reconhecido em todos os mercados. Este indicador desenhará os atuais pivôs trimestrais, mensais, semanais, diários e de quatro horas no gráfico, para qualquer símbolo. Você também pode mostrar os níveis de Suporte e Resistência para cada período e escolher qual exibir dos níveis 1 a 4.     Escolha o tipo de pivô entre: Padrão Camarilha Dinamarca Woodie Fibonacci Observe que os pivôs DeMark têm um único nível de suporte e resistência de ac
Os mercados realmente adoram números redondos e geralmente atuam como suporte em um mercado em queda ou resistência quando os preços sobem. Este indicador é projetado para desenhar níveis de preços em valores redondos. Ele faz isso automaticamente, mas você também tem a opção de substituir isso e determinar os níveis que deseja ver. Um nível redondo pode ser tão simples quanto passos de 10, então 10, 20, 30 etc. ou se você estiver trabalhando com Forex, talvez queira ver mudanças em 0,1 ou 0,01.
ATR Extremes MT5
Robert Gerald Wood
Average True Range (ATR) é um indicador comumente usado que mede a quantidade de movimento no preço ao longo de uma duração definida. No entanto, o valor que ele fornece não é definido dentro de nenhum tipo de limite, o que torna quase impossível usá-lo para qualquer outra coisa que não seja stop loss ou cálculos de lucro. Este indicador é o seu indicador ATR padrão, mas introduzimos demarcações de percentil para que você possa ver os extremos. Você pode escolher entre Percentis e algo que chama
O esgotamento do intervalo ocorre quando o preço atinge ou excede o intervalo esperado para o período atual. Nesses níveis, o preço começa a perder seu ímpeto em relação ao início do período, portanto, é bom garantir que você não esteja assumindo novas posições. Este indicador mostrará onde é provável que isso aconteça em seu gráfico, mostrando os níveis para os períodos Diário, Semanal e Mensal. Quando você vê o preço excedendo esses níveis de exaustão, está dizendo que o momento por trás do mo
Filtro:
renetrader07
135
renetrader07 2023.11.23 18:19 
 

Great help for filtering markets to improve probability

Robert Gerald Wood
4920
Resposta do desenvolvedor Robert Gerald Wood 2023.11.23 18:20
Thanks for the review, and very happy you like the indicator.
Responder ao comentário