TheStrat Monitor MT5

5

Henüz Strat ticaret stratejisini öğrenmediyseniz, şimdi google'a gidin. Vaktini boşa harcamayacağına söz veriyorum ve kullansan da kullanmasan da muhtemelen bazı yeni numaralar öğreneceksin.

Tamam, artık TheStrat'ın ne olduğunu biliyorsunuz, bu göstergenin sizin için neler yapabileceğini anlayabileceksiniz.

Ana Özellikler

Kısacası, Gösterge şunları yapacaktır:

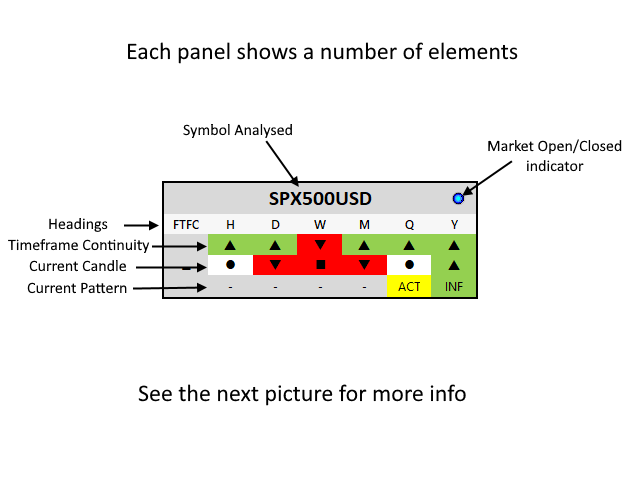
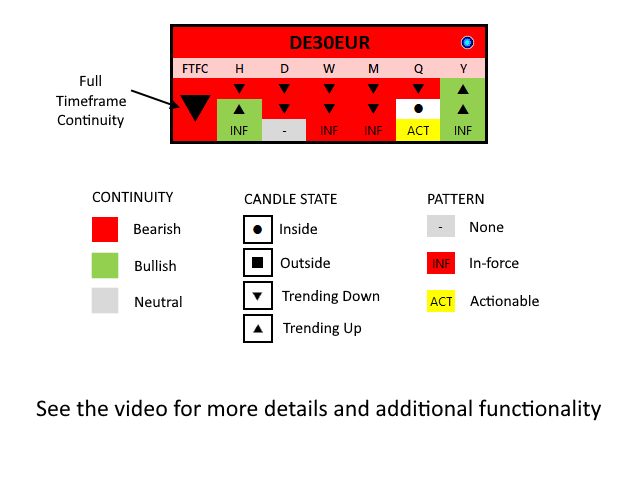
  • Desteklenen tüm zaman dilimleri için Zaman Çerçevesi Sürekliliğini Göster
  • İki zaman seti görünümünü destekler, Günlük tüccar ve Swing tüccar
  • Ardışık 4 zaman dilimi için Tam Zaman Çerçevesi Sürekliliğinin ne zaman geçerli olduğunu gösterin
  • Her zaman dilimi için mevcut mum durumunu göster
  • Varsa, mevcut modeli tüm zaman dilimlerinde göster
  • Hem Yürürlükte hem de İşlem Yapılabilir kalıpları gösterir
  • Her 5 saniyede bir güncelleme (1 saniyeden itibaren yapılandırılabilir)
  • Seçili sembol ve zaman diliminde bir grafik açmak için panele tıklamanıza izin verir
  • Grafikleri açmak için hangi grafik şablonunun kullanılacağını seçebilirsiniz.
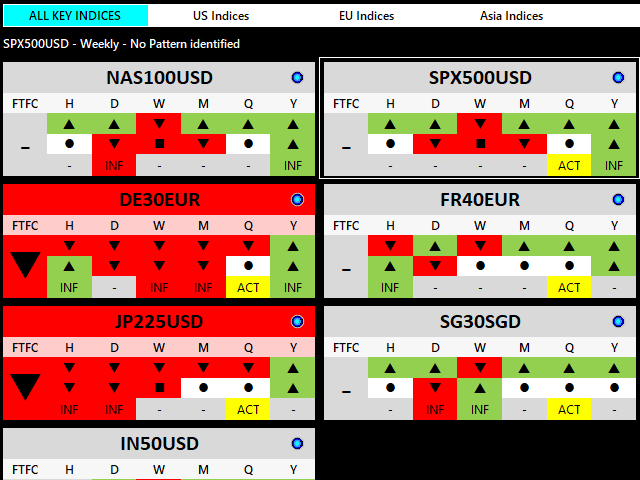
  • Hangi grupların ve bu gruplardaki sembollerin görüntüleneceğini siz seçersiniz

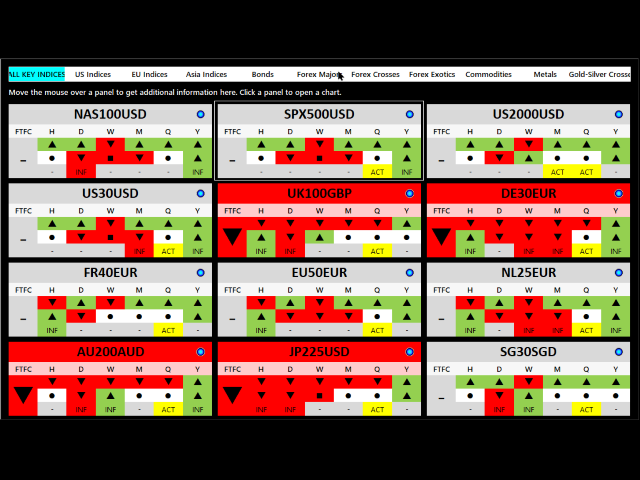
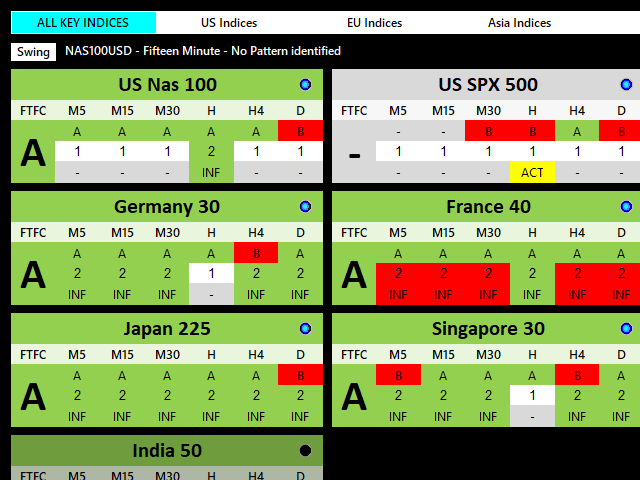
Gösterge, komisyoncunuz tarafından desteklenen herhangi bir sembolün tüm önemli Strat öğelerinin, Zaman Çerçevesi sürekliliğinin, mevcut kalıpların ve mevcut mum durumlarının anlık bir genel görünümünü görüntüler. Bunu desteklenen tüm zaman çerçeveleri için yapar, böylece şu anda piyasada tam olarak neler olduğunu görebilirsiniz.

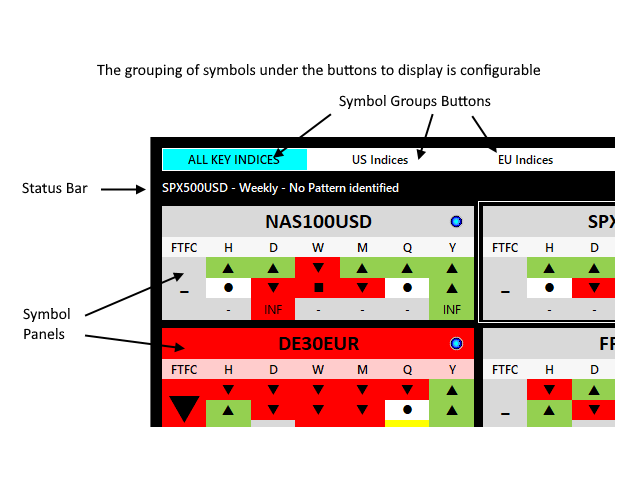
Sembolleri istediğiniz gibi gruplayabilir ve her grupla ilgili düğmelerin başlığını seçebilirsiniz. Belirli bir türdeki tüm sembollerin aynı anda ekranda olması, grup genelinde benzerlikleri görmenizi sağlayarak analizinize yardımcı olur.

Yapılandırma Dosyası hakkında daha fazla bilgiyi burada bulabilirsiniz: https://www.mql5.com/en/blogs/post/746142

Bir sembol şu anda takas edilemez durumdaysa, piyasa kapalıysa, komisyoncu devre dışı bırakılmışsa vb. sembol paneli mevcut en son verileri gösterecek ancak ekranı grileştirecektir. Küçük bir LED ışık simgesi de bunu gösterir.
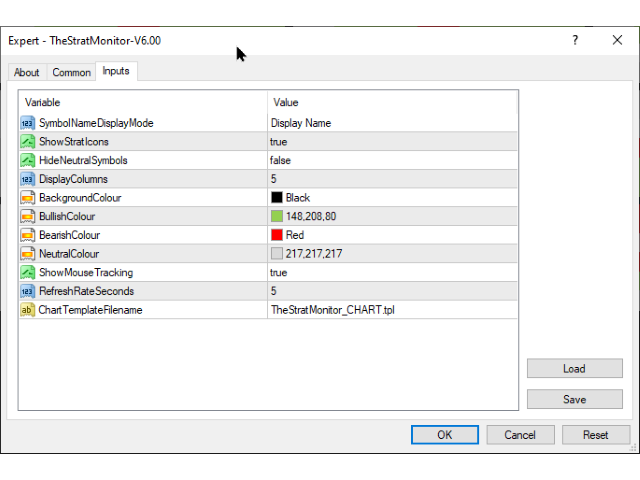
AYARLAR

SymbolNameDisplayMode

Her sembol panelinin başlığı için Ad, Açıklama veya Her İkisi arasından seçim yapın.

Saat ayarı

Gösterge için varsayılan zaman seti görünümünü ayarlar. Day Trader veya Swing Trader arasından seçim yapın. Ekrandaki düğmeyi tıklayarak bu ayarı istediğiniz zaman değiştirebilirsiniz.

Day Trader görünümü her panelde M5, M15, M30, H1, H4 ve D1 zaman çerçevelerini gösterirken Swing Trader görünümü H1, D1, W1, MN1, Q ve Y'yi gösterir.

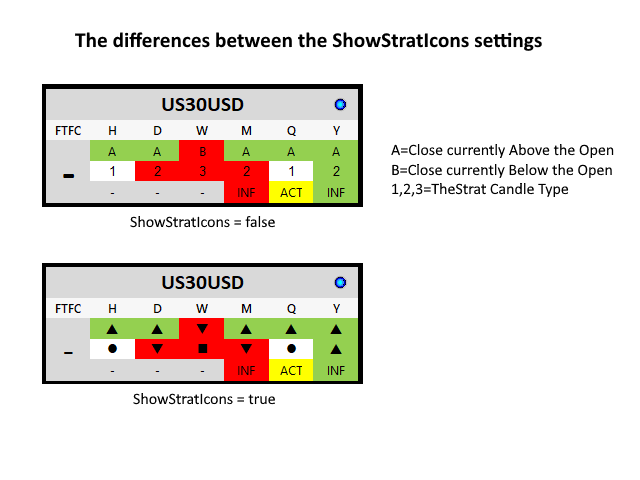
Strat Simgelerini Göster

Doğru olduğunda, paneller süreklilik yönü, mevcut mum durumları, kalıplar ve genel FTFC için Simgeler görüntüler.

NötrSembolleri Gizle

Doğru olduğunda, FTFC yönü olmayan tüm semboller gizlenir.

Görüntü Sütunları

Grafikte kaç panel sütunu görüntülemek istiyorsunuz?

Fare Takibini Göster

True olduğunda, farenin o anda üzerinde bulunduğu sembol panelinin çevresine bir ana hat çizilir.

RefreshRateSaniye

Varsayılan değer 5'tir, yani her panel için veri her 5 saniyede bir güncellenir. Değer pozitif bir tamsayı olmalıdır, yani 0'dan büyük bir değer

GrafikŞablonDosyaadı

Bir grafiği açarken kullanılacak şablonun dosya adı. Verilen şablon bulunamazsa, varsayılan şablon kullanılacaktır.


Arka plan rengi

Boğa Rengi

Ayı Rengi

NötrRenk

Standart MetaTrader seçiminden kullanmak istediğiniz rengi seçin.


İncelemeler 1
renetrader07
135
renetrader07 2023.11.23 18:19 
 

Great help for filtering markets to improve probability

Önerilen ürünler
Owl Smart Levels MT5
Sergey Ermolov
4.03 (32)
MT4 versiyonu  |  FAQ Owl Smart Levels Indicator , Bill Williams'ın gelişmiş fraktalları , piyasanın doğru dalga yapısını oluşturan Valable ZigZag ve kesin giriş seviyelerini gösteren Fibonacci seviyeleri gibi popüler piyasa analiz araçlarını içeren tek gösterge içinde eksiksiz bir ticaret sistemidir. pazara ve kar elde edilecek yerlere. Stratejinin ayrıntılı açıklaması Gösterge ile çalışma talimatı Baykuş Yardımcısı ticaretinde Danışman Yardımcısı Kullanıcıların özel sohbeti -> Satın aldıktan
STRICTLY FOR BOOM INDEX ONLY!!!!! Here I bring the Maximum Trend Arrows OT1.0 MT5 indicator. This indicator is made up of a combination of different trend indicators for entries and exits, for entries an orange arrow will paint on the chart below the current market and a red flag for closing of trades and it produces buy arrows only. When the orange arrow appears, it will appear along with it's sound to notify you. The 1H timeframe is recommended, don't use it anywhere else than on the 1H timefr
All about time and price by ICT. This indicator provides a comprehensive view of ICT killzones, Silver Bullet times, and ICT Macros, enhancing your trading experience.  In those time windows price either seeks liquidity or imbalances and you often find the most energetic price moves and turning points. Features: Automatic Adaptation: The ICT killzones intelligently adapt to the specific chart you are using. For Forex charts, it follows the ICT Forex times: In EST timezone: Session: Asia: 20h00-0
This indicator can be considered as a trading system. It offers a different view to see the currency pair: full timeless indicator, can be used for manual trading or for automatized trading with some expert advisor. When the price reaches a threshold a new block is created according to the set mode. The indicator beside the Renko bars, shows also 3 moving averages. Features renko mode median renko custom median renko 3 moving averages wicks datetime indicator for each block custom notification
Order Book, known also as Market Book, market depth, Level 2, - is a dynamically updated table with current volumes of orders to buy and to sell specific financial instument at price levels near Bid and Ask. MetaTrader 5 provides the means for receiving market book from your broker, but in real time only, without access to its history. The indicator OrderBook Cumulative Indicator accumulates market book data online and visualizes them on the chart. In addition, the indicator can show the market
Donchian Channel DC is the indicator of Donchian Channels, that plots maximum and minimum values of a specific period, besides mean value line. It´s possible to configure simple period for analysis and the indicator will plot all three values. You can trade with this indicator as trend or reversal, according to each strategy. Do not let to test others indicators as soon as others expert advisors.
The  SuperTrend Advance Trading  is a widely-used technical indicator based on  SuperTrend Strategy + Price Action + EMA . How it works: -  Buy/Sell Signals  can be generated when the trend reverses, the conditions of Price action, TrendLine and EMA are met. - After the  Signal  appears, be patient and wait until the candle closes, at that time place the order as soon as possible. You may have time to review your entry, consider whether it is a good entry or not. - Carefully review the entry, up
SMMA Bands Indicator
Elie Baptiste Granger
The SMMA Bands indicator is an advanced volatility-based trading tool that creates 6 dynamic support and resistance levels around an envelope formed by two Smoothed Moving Averages (SMMA).  This indicator combines the reliability of SMMA trend identification with the precision of standard deviation-based volatility bands, making it suitable for both trend-following and mean-reversion strategies. Every band has its own buffer for use in EA. feel free to make suggestions and add reviews , i will
The   Trendlines Oscillator   helps traders identify trends and momentum based on the normalized distances between the current price and the most recently detected bullish and bearish trend lines. The indicator features bullish and bearish momentum, a signal line with crossings, and multiple smoothing options. USAGE The   Trendlines Oscillator   works by systematically: Identifying pivot highs and lows. Connecting pivots to form bullish (support) and bearish (resistance) trendlines. Measuring
# DRAWDOWN INDICATOR V4.0 - The Essential Tool to Master Your Trading ## Transform Your Trading with a Complete Real-Time Performance Overview In the demanding world of Forex and CFD trading, **knowing your real-time performance** isn't a luxury—it's an **absolute necessity**. The **Drawdown Indicator V4.0** is much more than a simple indicator: it's your **professional dashboard** that gives you a clear, precise, and instant view of your trading account status. --- ## Why This Indicator
Weis Wave Scouter
Jean Carlos Martins Roso
MetaTrader 5 için geliştirilen Weis Wave Scouter ile gelişmiş hacim analizinin gücünü keşfedin! Bu devrim niteliğindeki gösterge, Wyckoff yönteminin ve Hacim Yayılımı Analizinin (VSA) kanıtlanmış ilkelerini birleştiriyor. Operasyonlarında doğruluk ve derinlik arayan yatırımcılar için tasarlanmıştır ve kümülatif hacim dalgası analizi yoluyla piyasanın taktiksel bir okumasını sunar. Weis Wave Scouter, Classic, NightVision ve OceanBreeze gibi özelleştirilebilir renk temaları ile renkli histogramlar
##   ONLY GOLD ##   Тiльки Золото ## **Mercaria Professional Trading Zones - Complete Guide** ## **Mercaria Professional Trading Zones - Повний посібник** ### **How Mercaria Zones Work / Як працюють зони Mercaria** **English:** Mercaria Zones is an advanced trading indicator that identifies high-probability support and resistance areas using ZigZag extremes combined with mathematical zone calculations. The indicator works on multiple timeframes simultaneously, providing a comprehensive view
Terra Infinity is a flat indicator. This improved version of the CalcFlat indicator has three additional lines that significantly increase its effectiveness. Unlike its predecessor with two static levels, Terra Infinity adds three dynamic lines above the main histogram, which are interpreted as follows: base signal line, minimum signal line, maximum signal line. These lines are formed using the additional parameter Avg, which is the average value of the histogram. Averaging produces a line cl
Follow The Line MT5
Oliver Gideon Amofa Appiah
4.6 (35)
This indicator obeys the popular maxim that: "THE TREND IS YOUR FRIEND" It paints a GREEN line for BUY and also paints a RED line for SELL. (you can change the colors). It gives alarms and alerts of all kinds. IT DOES NOT REPAINT and can be used for all currency pairs and timeframes. Yes, as easy and simple as that. Even a newbie can use it to make great and reliable trades. NB: For best results, get my other premium indicators for more powerful and reliable signals. Get them here: https://www.m
FREE
Half ma
Artem Svistunov
The Half ma arrow indicator for the MetaTrader 5 trading terminal is a simple but effective tool that gives a signal about a change in the current trend. The Half ma indicator looks like a solid dynamic line that changes color at the points where the trend changes. At these points, the indicator draws arrows of the corresponding color and direction.The Half ma arrow indicator for the MT5 terminal is not an independent source of input signals. It will be most effective to use it as a trend filte
Universal Soul Reaper
Pieter Gerhardus Van Zyl
Universal Soul Reaper is an atmospheric market-flow oscillator designed to interpret price behavior as a cycle of spiritual energy. Instead of reacting to raw price alone, it visualizes the state of the market’s soul —revealing when momentum is awakening, stabilizing, or fading. The indicator operates in a separate window and presents three interwoven entities: the Ectoplasmic Veil , the Spirit Boundary , and the Soul Core . Together, they form a living framework that helps traders sense pressu
Mario Order Blocks
Sandeep Kumar Tiwary
Mario Order Block Indicator Overview The Professional Order Block Indicator is an advanced technical analysis tool that automatically identifies and displays institutional order blocks on your chart. Based on smart money concepts, this indicator helps traders identify high-probability support and resistance zones where institutional traders have placed significant orders. Key FeaturesAutomatic Order Block Detection Identifies bullish and bearish order blocks based on pivot point analysis Uses so
Candle Fusion Pro
Martin Alejandro Bamonte
Candle Fusion Pro — Formasyon Tanıma + Trend Filtresi + Momentum Filtresi (Repaint Yok) Güçlü mum formasyonlarını tespit edin ve trend ile momentum analizini canlı olarak yaparak güvenilirliğini doğrulayın. Candle Fusion Pro , fiyat hareketi hassasiyetine , trend yapısına ve çok katmanlı onaylara güvenen traderlar için nihai görsel araçtır. Temel Özellikler Formasyona Dayalı Giriş : 10'dan fazla gelişmiş Japon mum formasyonu algılar: Yıldız kayması (seviye 2, 3, 4) Boğa / Ayı Yutan Mumlar Saba
Renko Plus
Eadvisors Software Inc.
With Renko Plus you can use the features in the Indicator functionality, just add it to the Metatrader5 chart.             The Renko chart is a type of chart, developed by the Japanese, that is constructed using price movement rather than standardized prices and time intervals like most charts. It is believed to be named after the Japanese word for bricks, "renga", as the graphic looks like a series of bricks.             A new brick is created when the price moves a specified pri
Trend Lines Scalper
Magdalena Estefania Colonna
TREND LINES Scalper Professional Indicator OVERVIEW Trend Lines Scalper is a highly accurate, advanced indicator designed specifically for professional traders looking to maximize their scalping opportunities by automatically detecting trend lines and high-probability signals. This powerful algorithm combines classic technical analysis with modern technology, automatically identifying price patterns and generating accurate, real-time signals for successful scalping trades. MAIN FEATURES
Statistical Arbitrage Spread Generator for Cointegration [MT5] What is Pair Trading? Pair trading is a market-neutral strategy that looks to exploit the relative price movement between two correlated assets — instead of betting on the direction of the market. The idea? When two assets that usually move together diverge beyond a statistically significant threshold, one is likely mispriced. You sell the expensive one, buy the cheap one , and profit when they converge again. It’s a statistica
FREE
Trend Monitor MT5
Pavel Zamoshnikov
4.5 (2)
The indicator generates early signals basing on ADX reading data combined with elements of price patterns. Works on all symbols and timeframes. The indicator does not redraw its signals. You see the same things on history and in real time. For better visual perception signals are displayed as arrows (in order not to overload the chart). Features The best results are obtained when the indicator works on two timeframes. For example: M30 – the indicator shows the main trend; M5 – the indicator gen
Noize Absorption Index - is the manual trading system that measures the difference of pressure between bears forces and bulls forces. Green line - is a noize free index that showing curent situation. Zero value of index shows totally choppy/flat market.Values above zero level shows how powerfull bullish wave is and values below zero measures bearish forces.Up arrow appears on bearish market when it's ready to reverse, dn arrow appears on weak bullish market, as a result of reverse expectation.
TrendDetect
Pavel Gotkevitch
The Trend Detect indicator combines the features of both trend indicators and oscillators. This indicator is a convenient tool for detecting short-term market cycles and identifying overbought and oversold levels. A long position can be opened when the indicator starts leaving the oversold area and breaks the zero level from below. A short position can be opened when the indicator starts leaving the overbought area and breaks the zero level from above. An opposite signal of the indicator can b
Price Manipulation Risk Indicator Advanced Tool for Market Risk Evaluation & Manipulation Detection Price Manipulation Risk Indicator is a professional tool designed to measure the current risk level in the market. It evaluates price behavior, market activity, and candle dynamics to detect unstable or potentially manipulated environments. This indicator helps traders avoid traps , filter false signals , and improve timing in both entries and exits. Product Purpose Provide an immediate a
The RSI Divergence + FVG Signal indicator combines Relative Strength Index (RSI) Divergence with Fair Value Gap (FVG) detection to generate high-probability buy and sell signals based on both momentum shifts and institutional imbalance zones. Core Features: RSI Divergence Detection : Identifies both regular and hidden bullish/bearish divergences between price and RSI. Divergences indicate potential trend reversals or continuation. FVG Zone Recognition : Detects Fair Value Gaps (imbalances caused
HMA Trend Professional MT5
Pavel Zamoshnikov
4.25 (4)
Improved version of the free HMA Trend indicator (for MetaTrader 4) with statistical analysis. HMA Trend is a trend indicator based on the Hull Moving Average (HMA) with two periods. HMA with a slow period identifies the trend, while HMA with a fast period determines the short-term movements and signals in the trend direction. The main differences from the free version: Ability to predict the probability of a trend reversal using analysis of history data. Plotting statistical charts for analyzi
Premium seviye, %80'den fazla doğru tahmin doğruluğuna sahip benzersiz bir göstergedir! Bu gösterge en iyi Ticaret Uzmanları tarafından iki aydan uzun süredir test edilmiştir! Yazarın göstergesini başka hiçbir yerde bulamazsınız! Ekran görüntülerinden bu aracın doğruluğunu kendiniz görebilirsiniz! 1, sona erme süresi 1 mum olan ikili opsiyon ticareti için harikadır. 2 tüm döviz çiftleri, hisse senetleri, emtialar, kripto para birimleri üzerinde çalışır Talimatlar: Kırmızı ok göründüğü an
Ichimoku Aiko MTF
Michael Jonah Randriamampionontsoa
Ichimoku Aiko MTF is a collection of technical indicators that show support and resistance levels, as well as momentum and trend direction. It is a multi-timeframe indicator so you don't need to change the chart timeframe when you want to see the ichimoku clouds on a higher timeframe.  eg. The chart timeframe is M15 and you want to see on the M15 timeframe chart the H1 ichimoku indicators (the ichimoku in Metatrader can't do that) that's why you need to use Ichimoku Aiko MTF.
SimSim Arrow KijunSen Plus MA tescilli bir ok göstergesidir. Orijinal indikatörün KijuSen ve MA çizgileri içeren versiyonu. MetaTrader 4 için sürüm Kijun-sen çizgisi MA çizgisini geçtiğinde gösterge sinyal üretir. İşlem için "KONTROL İŞLEMİ" aktif edildiğinde, indikatör sinyaline dayalı işlemler otomatik olarak açılacaktır.. Göstergeyi güvenilir bir sinyal cihazı olarak amacına uygun olarak kullanabilirsiniz. Ancak ikincil amacı " CONTROL DEAL " yardımcı programına sinyal sağlayıcı olarak hizm
Bu ürünün alıcıları ayrıca şunları da satın alıyor
ARICoins
Temirlan Kdyrkhan
ARICoin is a powerful trading companion designed to generate high-probability entry signals with dynamic TP/SL/DP levels based on volatility. Built-in performance tracking shows win/loss stats, PP1/PP2 hits, and success rates all updated live. Key Features: Buy/Sell signals with adaptive volatility bands Real-time TP/SL/DP levels based on ATR Built-in MA Filter with optional ATR/StdDev volatility Performance stats panel (Success, Profit/Loss, PP1/PP2) Alerts via popup, sound, push, or email Cust
AriX
Temirlan Kdyrkhan
1 (4)
AriX Indicator for MT5 A powerful trend-following and signal-evaluation tool AriX is a custom MT5 indicator that combines Moving Averages and ATR-based risk/reward logic to generate clear buy/sell signals. It visualizes dynamic SL/TP levels, evaluates past trade outcomes, and displays win/loss statistics in a clean on-chart panel. Key features include: Buy/Sell signals based on MA crossovers ATR-based SL/TP1/TP2/TP3 levels with visual lines and labels Signal outcome tracking with real-time stat
Azimuth Pro
Ottaviano De Cicco
5 (1)
LAUNCH PROMO Azimuth Pro price is initially set at 299$ for the first 100 buyers. Final price will be 499$ . THE DIFFERENCE BETWEEN RETAIL AND INSTITUTIONAL ENTRIES ISN'T THE INDICATOR — IT'S THE LOCATION. Most traders enter at arbitrary price levels, chasing momentum or reacting to lagging signals. Institutions wait for price to reach structured levels where supply and demand actually shift. Azimuth Pro maps these levels automatically: swing-anchored VWAP, multi-timeframe structure lines, an
ARIScalping
Temirlan Kdyrkhan
ARIScalp is a powerful trading companion designed to generate high-probability entry signals with dynamic TP/SL/DP levels based on volatility. Built-in performance tracking shows win/loss stats, PP1/PP2 hits, and success rates all updated live. Key Features: Buy/Sell signals with adaptive volatility bands Real-time TP/SL/DP levels based on ATR Built-in MA Filter with optional ATR/StdDev volatility Performance stats panel (Success, Profit/Loss, PP1/PP2) Alerts via popup, sound, push, or email Cus
Weis Wave with Alert MT5
Trade The Volume Waves Single Member P.C.
4.94 (17)
Rental/Lifetime Package Options and Privileges  Rent Monthly Six Months   Yearly/Lifetime Weis Wave with Speed with Alert+Speed Index x x x Manual  x x x Quick Set up Video x x x Blog x x x Lifetime Updates x x x Setup and Training Material x x Discord Access Channel "The SI traders"          x Rectangle Break Alert Tool      x How to trade with it:    http://www.tradethevolumewaves.com   ** If you purchase please contact me to setup your  : Training Room and  complete manual access.  Wei
Öncelikle, bu Ticaret Aracının Non-Repainting, Non-Redrawing ve Non-Lagging Gösterge olduğunu vurgulamakta fayda var, bu da onu profesyonel ticaret için ideal hale getiriyor. Çevrimiçi kurs, kullanıcı kılavuzu ve demo. Akıllı Fiyat Hareketi Kavramları Göstergesi, hem yeni hem de deneyimli tüccarlar için çok güçlü bir araçtır. İleri ticaret fikirlerini, Inner Circle Trader Analizi ve Smart Money Concepts Ticaret Stratejileri gibi 20'den fazla kullanışlı göstergeyi bir araya getirerek bir araya
MetaForecast M5
Vahidreza Heidar Gholami
5 (3)
MetaForecast, fiyat verilerindeki harmonileri kullanarak herhangi bir piyasanın geleceğini tahmin eder ve görselleştirir. Piyasa her zaman tahmin edilemezken, fiyatlarda bir desen varsa, MetaForecast geleceği mümkün olduğunca doğru bir şekilde tahmin edebilir. Benzer ürünlere göre, MetaForecast piyasa eğilimlerini analiz ederek daha kesin sonuçlar üretebilir. Giriş Parametreleri Past size (Geçmiş boyut) MetaForecast'ın gelecekteki tahminler oluşturmak için kullandığı çubuk sayısını belirtir. Mo
ARIPoint
Temirlan Kdyrkhan
1 (1)
ARIPoint is a powerful trading companion designed to generate high-probability entry signals with dynamic TP/SL/DP levels based on volatility. Built-in performance tracking shows win/loss stats, PP1/PP2 hits, and success rates all updated live. Key Features: Buy/Sell signals with adaptive volatility bands Real-time TP/SL/DP levels based on ATR Built-in MA Filter with optional ATR/StdDev volatility Performance stats panel (Success, Profit/Loss, PP1/PP2) Alerts via popup, sound, push, or email Cu
Ne kadar harika geriye dönük testler, canlı hesap performans kanıtları ve her yerde fantastik istatistikler sunan bir alım satım göstergesi aldınız, ancak onu kullandıktan sonra hesabınızı **patlatmakla mı sonuçlandınız?** Bir sinyale tek başına güvenmemelisiniz, öncelikle neden ortaya çıktığını bilmeniz gerekir ve RelicusRoad Pro bunu en iyi şekilde yapar! Kullanım Kılavuzu + Stratejiler + Eğitim Videoları + VIP Erişimli Özel Grup + Mobil Sürüm Mevcut Piyasaya Bakmanın Yeni Bir Yolu RelicusR
Elliott Wave Trend was designed for the scientific wave counting. This tool focuses to get rid of the vagueness of the classic Elliott Wave Counting using the guideline from the template and pattern approach. In doing so, firstly Elliott Wave Trend offers the template for your wave counting. Secondly, it offers Wave Structural Score to assist to identify accurate wave formation. It offers both impulse wave Structural Score and corrective wave Structure Score. Structural Score is the rating to sh
WARNING: This indicator is distributed EXCLUSIVELY on MQL5.com MT4 version:   https://www.mql5.com/it/market/product/160363 MT5 version:   https://www.mql5.com/it/market/product/160410 ============================================================================================= MAX RIBBON ver 1.00 The indicator that shows you the TREND clearly and unambiguously! ============================================================================================= DESCRIPTION MAX RIBBON is an advanced tre
FOOTPRINTORDERFLOW: The Authoritative Guide ( This indicator is also compatible with economic providers that do not offer DOM data and BID/ASK data, It also supports various foreign exchange transactions ) 1. Overview FOOTPRINTORDERFLOW  is an advanced Order Flow analysis tool designed for MetaTrader 5 (MT5). Unlike traditional candlestick charts that only show OHLC (Open, High, Low, Close), this indicator parses real-time Tick data to visualize the microstructure inside every candle. It helps y
SynaptixQuant Dominance Matrix
Devie Arevalo Montemayor
5 (1)
SynaptixQuant Dominance Matrix: Institutional-Grade Market State Extraction Engineered for traders who require a data-driven view of market behaviour beyond surface-level indicators. The Synaptix Quant (SQ) Dominance Matrix is not a conventional currency strength display. Behind its intentionally streamlined interface runs a sophisticated analytical architecture designed to quantify market conditions with precision. Every output is generated through layered signal processing built to identify d
+++++++++++++++++++++++++++++++++++++++++++++++++++++++++++++++++++++++++++++++++++++++++++++++++ +++ Link to EURUSD Only Free Version -->  https://www.mql5.com/en/market/product/156904?source=Unknown +++++++++++++++++++++++++++++++++++++++++++++++++++++++++++++++++++++++++++++++++++++++++++++++++ Hallo Trader, This is a traditional GANN & FIBONACCI strategy based on detection of an impulsive move in the opposite direction. This is called a Breakout. At the moment of Breakout, the indicator draw
Hyperbolic
Konstantin Gruzdev
The indicator is stable on noise fluctuations in price and quickly reacts to the trend. It is based on an algorithm from a system of hyperbolic functions that allows you to aggressively smooth the flat with minimal lag on the trend. It can be applied directly to the price chart, to itself, or to other indicators in order to eliminate false signals. The main purpose of the indicator is to smooth out small sawtooth price movements as much as possible. The higher the Hyperbolic parameter, the stron
Prices move for many reasons and these can vary from one operator to another: software, private and institutional traders simultaneously contribute to the formation of the price, making predictive art very difficult. However, there are measurable factors that bind the price to an underlying trend in line with the physical reality that the financial asset represents: these are the macroeconomic indicators. Large investors use this information wisely to set their strategies. Understanding these m
Matreshka
Dimitr Trifonov
5 (2)
Matreshka self-testing and self-optimizing indicator: 1. Is an interpretation of the Elliott Wave Analysis Theory. 2. Based on the principle of the indicator type ZigZag, and the waves are based on the principle of interpretation of the theory of DeMark. 3. Filters waves in length and height. 4. Draws up to six levels of ZigZag at the same time, tracking waves of different orders. 5. Marks Pulsed and Recoil Waves. 6. Draws arrows to open positions 7. Draws three channels. 8. Notes support and re
Stop calculating lot sizes manually. Stop guessing your Risk/Reward ratio. The Risk Reward Tool brings the intuitive, visual trading style of TradingView directly to your MetaTrader 5 charts. It is designed for traders who value speed, precision, and visual clarity. Whether you trade Forex, Indices (DAX, US30), or Commodities (Gold, Oil), this tool handles the math for you. Simply click "Long" or "Short," drag the lines to your levels, and the tool instantly tells you exactly how many lots to t
TrendMaestro5
Stefano Frisetti
note: this indicator is for METATRADER4, if you want the version for METATRADER5 this is the link:  https://www.mql5.com/it/market/product/108106 TRENDMAESTRO ver 2.5 TRENDMAESTRO recognizes a new TREND from the start, he never makes mistakes. The certainty of identifying a new TREND is priceless. DESCRIPTION TRENDMAESTRO identifies a new TREND in the bud, this indicator examines the volatility, volumes and momentum to identify the moment in which there is an explosion of one or more of these da
Step into the world of Forex trading with confidence, clarity, and precision using Gold Indicator a next-generation tool engineered to take your trading performance to the next level. Whether you’re a seasoned professional or just beginning your journey in the currency markets, Gold Indicator equips you with powerful insights and help you trade smarter, not harder. Built on the proven synergy of three advanced indicators, Gold Indicator focuses exclusively on medium and long-term trends elimina
ÜCRETSİZ AUX Göstergesi ve EA Desteğini Alın  Doğrudan indirme — Buraya tıklayın [ D.I.C.E ] The DICE Indicator  Divergence in Chaos Environment, Elliott Dalga Teorisi’ni Trading Chaos teknikleriyle birleştiren trader’lar için geliştirilmiş özel bir MT5 aracıdır. Bill Williams’ın tanımladığı kaotik piyasa ortamıyla senkronize olarak fiyat hareketlerindeki gizli ve normal uyumsuzlukları tespit eder. Ana Özellikler Elliott Dalgası Uyumlu Uyumsuzluk: Dalga yapılarıyla uyumlu boğa ve ayı uyumsuzluk
Orderflow Scalp Pro v2.4   delivers institutional-grade trading intelligence through advanced volume analysis, dynamic VWAP calculations, real-time aggressive score monitoring, and precision arrow signals. This complete trading system transforms complex market data into clear, actionable signals for consistent profitability on 3-4 minute timeframes. Full Documentation: [Download PDF] Four Powerful Components in One System Volume Profile HeatMap with POC/VAH/VAL Transform your charts into inst
MonsterDash Harmonics Indicator is a harmonic pattern dashboard. It recognizes all major patterns. MonsterDash is a dashboard that displays all detected patterns for all symbols and (almost) all timeframes in sortable and scrollable format. Users can add their own user defined patterns . MonsterDash can open and update charts with the pattern found. Settings MonsterDash's default settings are good enough most of the time. Feel free to fine tune them to your needs. The color settings are for tho
The Volume Spread Analysis indicator is based on the original Volume Spread Analysis method. It was designed for quick and easy recognition of VSA patterns. Even though this indicator looks very simple, it is the most sophisticated tool we've ever made. It is a really powerful analytical tool that generates very reliable trading signals. Because it is very user-friendly and understandable, it is suitable for every type of trader, regardless of his experience. What is VSA? VSA - Volume Spread A
This indicator belongs to the family of channel indicators. These channel indicator was created based on the principle that the market will always trade in a swinging like pattern. The swinging like pattern is caused by the existence of both the bulls and bears in a market. This causes a market to trade in a dynamic channel. it is designed to help the buyer to identify the levels at which the bulls are buying and the bear are selling. The bulls are buying when the Market is cheap and the bears a
ÜCRETSİZ AUX Göstergesini, EA desteğini ve tam kılavuzu alın, lütfen ziyaret edin – https://www.mql5.com/en/blogs/post/763955 Trend'i Belirle. Deseni Oku. Girişi Zamanla. 30 Saniyede 3 Adım! Kolayca işlem yapın — analiz gerektirmez, Akıllı yardımcınız iş akışınızı basitleştirmeye hazır Artık grafik yüklemesi yok. Akıllı yönelim tespiti ile güvenle işlem yapın. Tüm para birimleri, kripto, hisse senetleri, metaller, endeksler ve herhangi bir zaman dilimi ile uyumludur. Sadece tıklayın ve yürütün
First time on MetaTrader, introducing IQ Star Lines - an original Vedic Astrology based indicator. "Millionaires don't use astrology, billionaires do" . - J.P. Morgan, Legendary American financier and banker. IQ Star Lines, an unique astrological indicator purely based on   Vedic astrology   calculations, published for the   first time on Metatrader.  This unique tool plots dynamic planetary grid lines based on real-time stars, constellations, and celestial movements, which allows you to plot t
Presenting one-of-a-kind Gann Indicator for XAUUSD IQ Gold Gann Levels is a non-repainting, precision tool designed exclusively for XAUUSD/Gold intraday trading. It uses W.D. Gann’s square root method to plot real-time support and resistance levels, helping traders spot high-probability entries with confidence and clarity. William Delbert Gann (W.D. Gann) was an exceptional market analyst whose trading technique was based on a complex blend of mathematics, geometry, astrology, and ancient calcul
Elliot Waves Analyzer Pro
Viktor Weidenthal
2.67 (3)
Elliot Waves Analyzer Pro calculates Elliot Waves to Help Identify Trend direction and Entry Levels. Mainly for Swing Trading Strategies. Usually one would open a Position in trend direction for Wave 3 or a Correction for Wave C . This Indicator draws Target Levels for the current and next wave. Most important Rules for Elliot Wave Analysis are verified by the Indicator.  The Pro version analyzes Multiple Timeframes and shows the Subwaves and Target-Levels.   For an Overview  " Elliot Waves Anal
This indicator uses support and resistance, volume and some special formula to calculate the volume to filter the candles. If the volume reaches a specific value, And at the same time, Candle breaks the support/resistance line, There would be a signal and we can enter the market. Signals appear when the current candle closes. then you can enter the trade when a new candle appears. Please don't forget to follow your money management plan. MT4 Version Support/Resistance Breakout MT4 :   https:/
Yazarın diğer ürünleri
Bu gösterge, farklı zaman ölçeklerinde birçok grafiğin gözden geçirilmesini daha hızlı ve daha kolay hale getirmek için tasarlanmıştır. Birden fazla grafikte Zaman ve Fiyatı İzleyin Bir grafikteki Sembolü Değiştirin ve aynı sembolün diğer tüm çizelgeleri de değişecektir. Kullanımı kolay, ustalaşması hızlı Gösterge, aynı Sembolde açık olan diğer tüm grafiklerde fare işaretçisinin geçerli grafikte bulunduğu fiyatı ve zamanı belirlemenize olanak tanır. Bu, birden fazla grafikteki bilgileri hızlı bi
Multi Chart Crosshairs
Robert Gerald Wood
5 (1)
This indicator is designed to make reviews of many charts on different timescales quicker, and easier to do. Track Time and Price across multiple charts Change Symbol on one chart and all other charts of the same symbol will be changed too. Easy to use, quick to master The indicator allows you to identify the price and time where the mouse pointer is on the current chart, across all other charts open on the same Symbol. This allows you to quickly see information on multiple charts whereas normal
Bu Komut Dosyası, trend çizgileri, Fibonachi Düzeltmeleri vb. gibi herhangi bir türdeki çizim nesnelerini bir veya daha fazla başka grafiğe kopyalamanıza olanak tanır. Varsayılan olarak komut dosyası, geçerli grafikteki, yani komut dosyasının uygulandığı grafikteki tüm nesneleri, o anda yüklü olan aynı Symbol'ün diğer herhangi bir grafiğine kopyalar. Ayarlar HedefZaman Dilimi PERIOD_CURRENT dışında herhangi bir değere ayarlandığında, nesneleri komut dosyasının uygulandığı grafikle aynı Sembol
FREE
This script allows you to toggle the "Show Trade Levels" option, but for the current chart only. Normally, you can only change the setting using the Options -> Chart menu for ALL charts, but this script allows you to do it for a SINGLE chart. I'm using it when I take screenshots, because most of the time I'm not trying to show the trades, just some functionality of one of my other tools. Iif you need that functionality, then this script is very helpful! If the script helps you, please let me k
FREE
A simple script that can delete all the drawing objects on a chart, or just the objects of a specific type. Settings: DeleteObjectsOfType By default the value will be blank which means ALL drawing objects on the chart will be deleted. If you only wish to delete specific types of drawing object, change this setting to the type of object to delete. For example, Fibonacci Retracement, Text, Label or Trend Line. Please see the demonstration video for more information.
FREE
Rob Smith'in TheStrat'ını öğrenirken bu basit göstergeyi oluşturdum ve çok faydalı buldum, sizinle paylaşayım dedim. Yararlı bulursanız, lütfen MQL5'te yayınladığım diğer göstergelere bakın. Gösterge, grafik üzerinde daha yüksek bir zaman aralığından seçtiğiniz fiyat seviyesini gösteren tek bir çizgi çizer. Ayarları kullanarak, görüntülediği zaman çerçevesi üzerinde tam kontrole sahip olursunuz, ancak   varsayılan olarak, ölçeği bir adım yukarı taşıyarak daha yüksek zaman dilimini kendisi hesapl
FREE
This indicator will draw patterns based on Rob Smith's The Strat as they emerge in real time on your chart. As price evolves, TheStrat offers 18 distinct price action patterns that can help you get good entries in the market. Each pattern involves two or three candles, and this indicator will draw a bounding box around the candles and name the pattern. The indicator also shows when a potential setup is forming, known by stratters as an Actionable signal. Candles Each candle is defined by its
TheStrat Levels
Robert Gerald Wood
This indicator draws the prior Highs and Lows for multiple timeframes, and can display potential Take Profit and Stop Loss levels. In Rob Smith's # The Strat   terms,   these are potential entry points, or alternatively potential targets for open positions. I like to use them in both ways. On a lower timeframe, say 5 minutes to get a good entry on a daily or weekly level, and then as a potential target. Very small stops required giving an excellent risk/reward ratio. Please watch the DEMO video
TheStrat Candles
Robert Gerald Wood
5 (1)
Bu gösterge, her mumun üstüne veya altına bir etiket çizecektir.       Rob Smith'in       Strat       grafiğinizde zamanla geliştikçe. Fiyat geliştikçe, bir mum üç durum arasında geçiş yapabilir. Mum ilk açıldığında, önceki yüksek ve alçak mumların içine tamamen oturursa, o zaman Tip 1 olarak başlar. tip 2 ve fiyat hareketi değişken ve yönsüz ise, önceki mumun karşı tarafını kırabilir ve tip 3 olabilir. mumlar Her mum, önceki mumla olan ilişkisi ile tanımlanır. Tip 1 - İç mum   - Mum tamamen
TheStrat FTFC
Robert Gerald Wood
FTFC, Rob Smith'in   The Strat   tarafından tanımlandığı şekliyle Tam Zaman Çerçevesi Sürekliliği anlamına gelir. Bu gösterge grafikte iki çizgi çizer; Üç Aylık, Aylık, Haftalık, Günlük veya Saatlik açılış seviyelerinin en yükseği ve bu değerlerin en küçüğünün ikincisi. Bu size, ticaretin tek yönde çok güçlü olma olasılığının daha yüksek olduğu bir kanal verir. Satırlar arasında fiyat hareketi daha dalgalı olacak ve daha geniş stoplar kullanabilirsiniz. Yüksekler ve alçaklar arasındaki orta nokt
Piyasalar yuvarlak rakamları gerçekten sever ve genellikle düşen bir piyasada destek veya fiyat yükselirken direnç olarak hareket ederler. Bu gösterge, Yuvarlak değerlerde fiyat seviyeleri çizmek için tasarlanmıştır. Bunu otomatik olarak yapar, ancak bunu geçersiz kılma ve görmek istediğiniz seviyeleri belirleme seçeneğiniz de vardır. Yuvarlak bir seviye 10'luk adımlar kadar basit olabilir, yani 10, 20, 30 vb. Gösterge, her biri farklı formatta olan Major ve Minor olmak üzere iki sınıf çizgi çiz
TheStrat Monitor
Robert Gerald Wood
3.67 (3)
If you've not already learnt about The Strat trading strategy , go google it now. I promise it won't be a waste of your time, and you will likely learn some new tricks whether you use it or not. OK, so now you know what TheStrat is, you will be able to understand what this indicator can do for you. Key Features In short, the Indicator will: Show Timeframe Continuity for all supported timeframes Supports two timeset views, Day trader and Swing trader Show when Full Timeframe Continuity is in pla
The Strat   kullanarak işlem yaparken, birden çok zaman dilimine göz kulak olmak önemlidir. Bu gösterge, her zaman dilimi için mevcut mumun Günlük, Haftalık, Aylık ve Üç Aylık durumunu gösterecektir. Daire simgesi, o zaman dilimindeki mumun şu anda TheStrat terminolojisinde bir Inside veya Type 1 olduğunu gösterir. Bir Inside Day mumu, fiyat hareketini pekiştiriyor ve biz, aralığın kırılmasını arıyoruz. Yukarıyı veya aşağıyı gösteren bir Üçgen simgesi, trend olan bir mum veya TheStrat terminoloj
Active Pivot Levels
Robert Gerald Wood
5 (1)
Pivot seviyeleri, her pazarda tanınan, iyi kurulmuş bir teknik seviyedir. Bu gösterge, herhangi bir sembol için mevcut Üç Aylık, Aylık, Haftalık, Günlük ve dört saatlik pivotları grafik üzerinde çizecektir. Ayrıca her dönem için Destek ve Direnç seviyelerini gösterebilir ve 1 ile 4 arasındaki seviyelerden hangisinin görüntüleneceğini seçebilirsiniz.     Şunlardan Pivot türünü seçin: Standart Camarilla DeMark Ormancı Fibonacci Lütfen dikkat, DeMark pivotlarının orijinal spesifikasyona göre tek bi
ATR Extremes
Robert Gerald Wood
Ortalama Gerçek Aralık (ATR), belirli bir süre boyunca fiyattaki hareket miktarını ölçen yaygın olarak kullanılan bir göstergedir. Ancak verdiği değerin herhangi bir sınır içinde tanımlanmaması, zararı durdur veya kar al hesaplamaları dışında herhangi bir amaçla kullanılmasını neredeyse imkansız hale getirir. Bu gösterge, standart ATR göstergenizdir, ancak uç noktaları görebilmeniz için yüzdelik sınırlar ekledik. Yüzdelikler ile Bölünmüş Medyanlar dediğimiz bir şey arasında seçim yapabilirsin
Range Exhaustion
Robert Gerald Wood
Aralık Tükenmesi, fiyat cari dönem için beklenen aralığı karşıladığında veya aştığında gerçekleşir. Bu seviyelerde fiyat, dönemin başına göre momentumunu kaybetmeye başlar, bu nedenle yeni pozisyonlar almadığınızdan emin olmak için iyi bir nokta. Bu gösterge, Günlük, Haftalık ve Aylık dönemler için seviyeleri göstererek, grafiğinizde bunun olma olasılığının yüksek olduğu yerleri size gösterecektir. Fiyatların bu tükenme seviyelerini aştığını gördüğünüzde, bu size hareketin arkasındaki momentumun
This indicator will draw a label above or below each candle based on   Rob Smith's   The Strat   as they develop over time on your chart. As price evolves, a candle can switch between three states. When the candle first opens, if it sits completely within the previous candles high and low, then it will start as a Type 1. As time moves on, if it breaks either the high or low of the previous candle, it will be come a type 2, and should the price action be volatile and directionless, it may then
TheStrat Levels MT5
Robert Gerald Wood
5 (1)
This indicator draws the prior Highs and Lows for multiple timeframes, and can display potential Take Profit and Stop Loss levels. In Rob Smith's # The Strat  terms, these are potential entry points, or alternatively potential targets for open positions. I like to use them in both ways. On a lower timeframe, say 5 minutes to get a good entry on a daily or weekly level, and then as a potential target. Very small stops required giving an excellent risk/reward ratio. Key Features  - Levels from Hou
FTFC, Rob Smith'in   The Strat   tarafından tanımlandığı şekliyle Tam Zaman Çerçevesi Sürekliliği anlamına gelir. Bu gösterge grafikte iki çizgi çizer; Üç Aylık, Aylık, Haftalık, Günlük veya Saatlik açılış seviyelerinin en yükseği ve bu değerlerin en küçüğünün ikincisi. Bu size, ticaretin tek yönde çok güçlü olma olasılığının daha yüksek olduğu bir kanal verir. Satırlar arasında fiyat hareketi daha dalgalı olacak ve daha geniş stoplar kullanabilirsiniz. Yükselişler ve düşüşler arasındaki orta no
This indicator will draw patterns based on   Rob Smith's   The Strat   as they emerge in real time on your chart. As price evolves,   TheStrat   offers 18 distinct price action patterns that can help you get good entries in the market. Each pattern involves two or three candles, and this indicator will draw a bounding box around the candles and name the pattern. The indicator also shows when a potential setup is forming, known by stratters as an Actionable signal. Candles Each candle is defin
TheStrat TFC Monitor MT5
Robert Gerald Wood
5 (1)
The Strat   kullanarak işlem yaparken, birden çok zaman dilimine göz kulak olmak önemlidir. Bu gösterge, her zaman dilimi için mevcut mumun Günlük, Haftalık, Aylık ve Üç Aylık durumunu gösterecektir. Daire simgesi, o zaman dilimindeki mumun şu anda TheStrat terminolojisinde bir Inside veya Type 1 olduğunu gösterir. Bir Inside Day mumu, fiyat hareketini pekiştiriyor ve biz, aralığın kırılmasını arıyoruz. Yukarıyı veya aşağıyı gösteren bir Üçgen simgesi, trend olan bir mum veya TheStrat terminoloj
Pivot seviyeleri, her pazarda tanınan, iyi kurulmuş bir teknik seviyedir. Bu gösterge, herhangi bir sembol için mevcut Üç Aylık, Aylık, Haftalık, Günlük ve dört saatlik pivotları grafik üzerinde çizecektir. Ayrıca her dönem için Destek ve Direnç seviyelerini gösterebilir ve 1 ile 4 arasındaki seviyelerden hangisinin görüntüleneceğini seçebilirsiniz.     Şunlardan Pivot türünü seçin: Standart Camarilla DeMark Ormancı Fibonacci Lütfen dikkat, DeMark pivotlarının orijinal spesifikasyona göre tek bi
Piyasalar yuvarlak rakamları gerçekten sever ve genellikle düşen bir piyasada destek veya fiyat yükselirken direnç olarak hareket ederler. Bu gösterge, Yuvarlak değerlerde fiyat seviyeleri çizmek için tasarlanmıştır. Bunu otomatik olarak yapar, ancak bunu geçersiz kılma ve görmek istediğiniz seviyeleri belirleme seçeneğiniz de vardır. Yuvarlak bir seviye 10'luk adımlar kadar basit olabilir, yani 10, 20, 30 vb. Gösterge, her biri farklı formatta olan Major ve Minor olmak üzere iki sınıf çizgi çiz
ATR Extremes MT5
Robert Gerald Wood
Ortalama Gerçek Aralık (ATR), belirli bir süre boyunca fiyattaki hareket miktarını ölçen yaygın olarak kullanılan bir göstergedir. Ancak verdiği değerin herhangi bir sınır içinde tanımlanmaması, zararı durdur veya kârı al hesaplamaları dışında herhangi bir amaçla kullanılmasını neredeyse imkansız hale getirmektedir. Bu gösterge sizin standart ATR göstergenizdir, ancak uç noktaları görebilmeniz için yüzdelik dilimler ekledik. Yüzdelikler ile Bölünmüş Medyanlar dediğimiz bir şey arasında seçim yap
Aralık Tükenmesi, fiyat cari dönem için beklenen aralığı karşıladığında veya aştığında gerçekleşir. Bu seviyelerde fiyat, dönemin başına göre momentumunu kaybetmeye başlar, bu nedenle yeni pozisyonlar almadığınızdan emin olmak için iyi bir nokta. Bu gösterge, Günlük, Haftalık ve Aylık dönemler için seviyeleri göstererek, grafiğinizde bunun olma olasılığının yüksek olduğu yerleri size gösterecektir. Fiyatların bu tükenme seviyelerini aştığını gördüğünüzde, bu size hareketin arkasındaki momentumun
Filtrele:
renetrader07
135
renetrader07 2023.11.23 18:19 
 

Great help for filtering markets to improve probability

Robert Gerald Wood
4921
Geliştiriciden yanıt Robert Gerald Wood 2023.11.23 18:20
Thanks for the review, and very happy you like the indicator.
İncelemeye yanıt