Lisek Weis Wave
- Indicadores
-
Darius Hans Lischka
 I am a professional software developer in Germany and Switzerland with over 30 years of experience.
My focus is the hardware-related programming of embedded systems, robots and machine control.
Very good knowledge of C / C ++ / C # and .NET, Python, Java and others. - Versión: 1.3
- Actualizado: 22 julio 2021
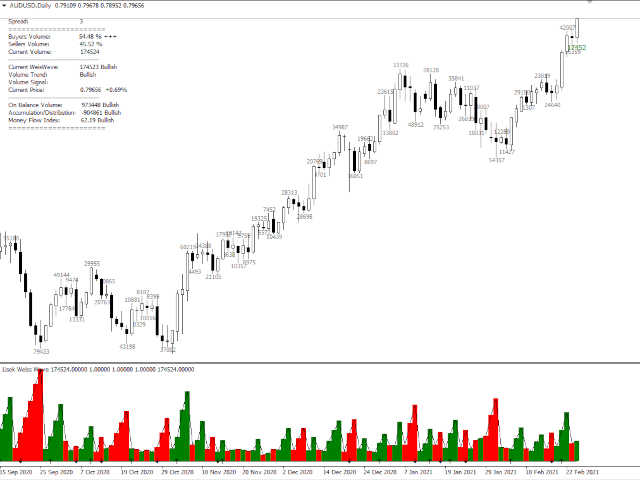
Este indicador Weis Wave Volume es una herramienta que ayuda a los operadores a identificar la tendencia actual de los precios.
Comprender el volumen puede proporcionar información sobre el comportamiento de un mercado para ayudarle a determinar su salud general. La regla más importante es la siguiente: el volumen precede al precio. Normalmente, antes de que se mueva el precio de un mercado, entra en juego el volumen.
Tiene 2 colores principales histograma que son verde y rojo.
- El verde indica una onda alcista. Cuanto más sube el precio, mayor es el volumen verde.
- El color rojo muestra una onda decreciente. Cuanto más baja el precio, mayor es el volumen rojo.
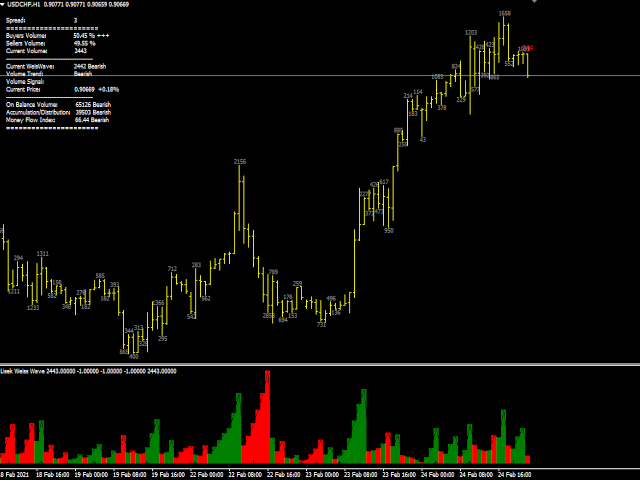
Significado del volumen de la onda de Weis
Al operar y analizar el mercado, los operadores profesionales utilizan el indicador Onda de Weis principalmente para determinar la tendencia actual del precio. Porque ésta es la señal más intuitiva que ofrece el indicador.

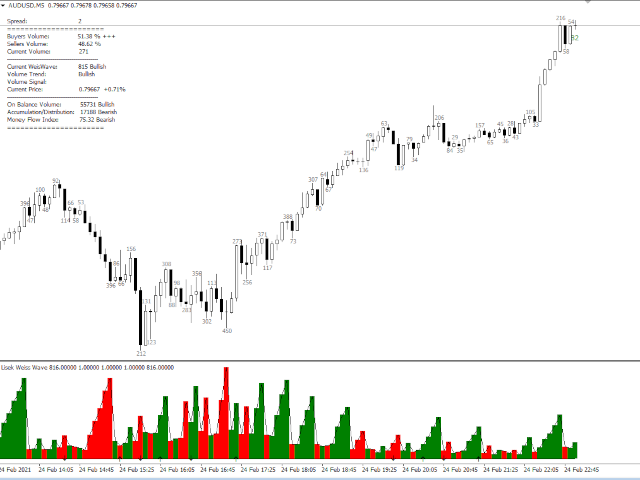


Seems reliable with candlestick activity