Deep Insight Candles

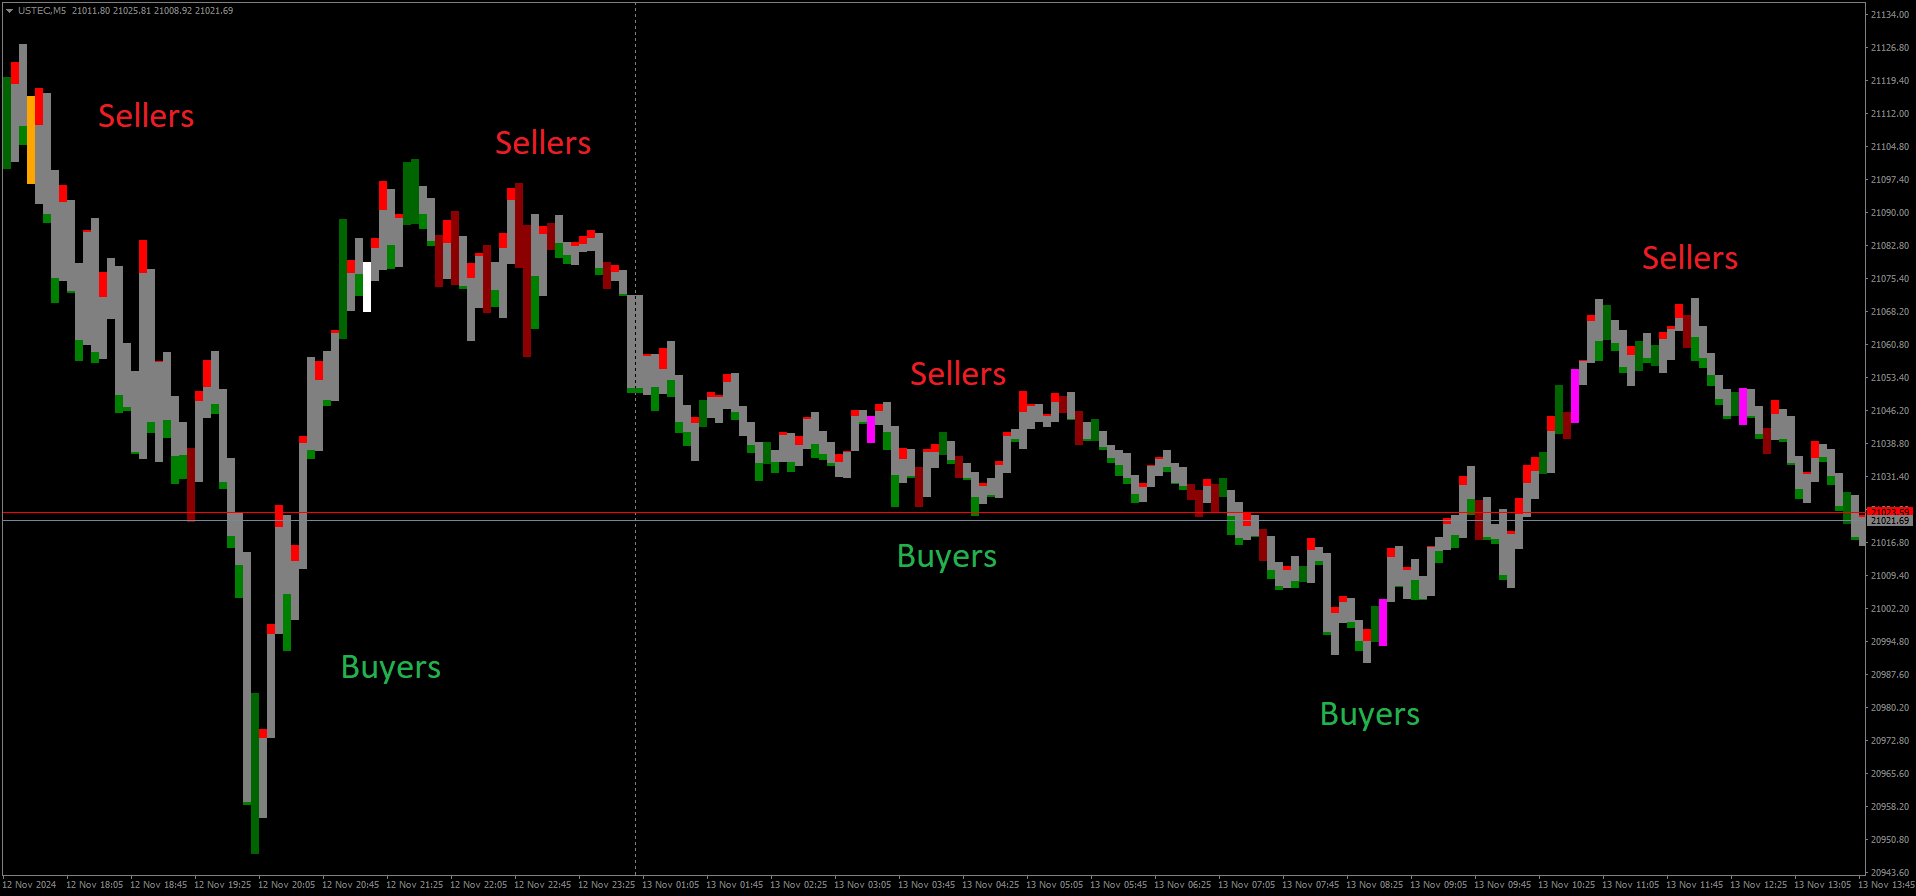
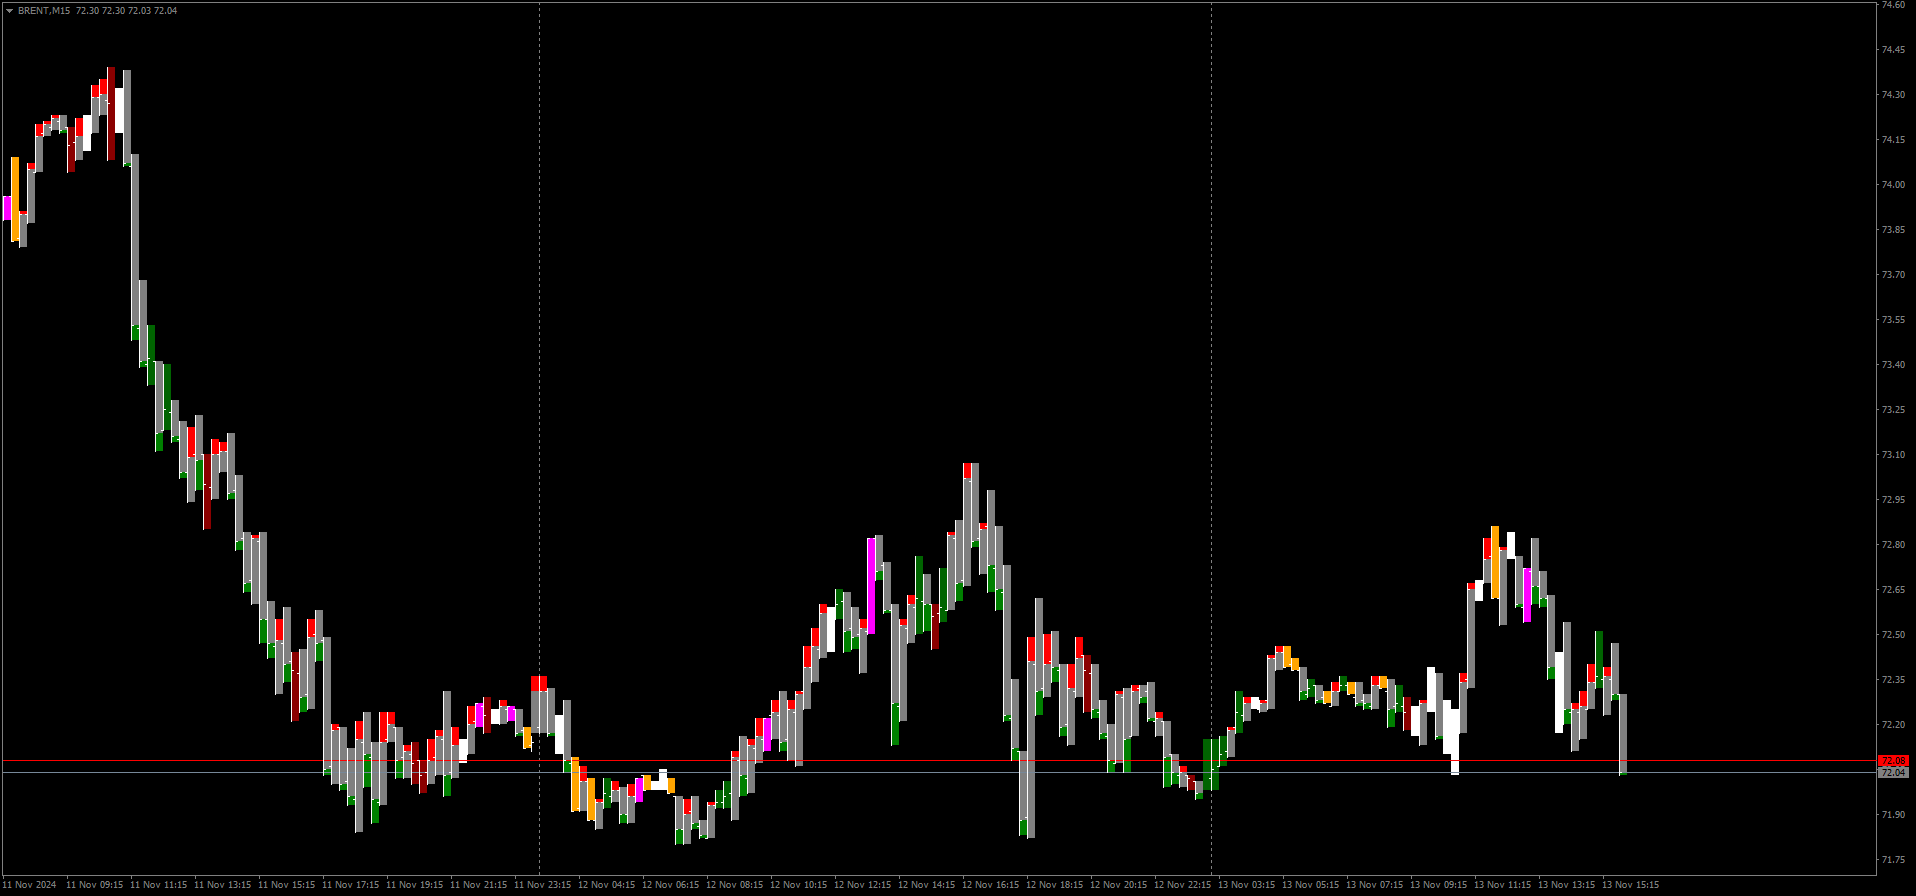
Deep Insight Candles is an indicator that brings an entirely new perspective to the price chart. It focuses on revealing hidden structures in market movements, uncovering buyer and seller pressure, thus helping traders to better identify key levels, dynamics, and potential reversals. The indicator conveys deeper market insights, allowing traders to make decisions based on a more accurate perception of market sentiment and pressure at specific price levels. This innovative approach transforms the chart into a form that provides substantial, easier-to-read signals, ideal for anyone seeking a significant trading advantage.

I recommend using the indicator on a line chart (set color to NONE).

The indicator is non-repainting and works in real-time with tick data (so the last bar is always in development according to the current price).

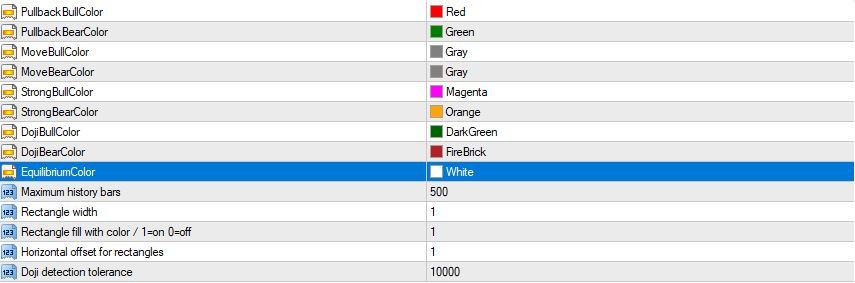
Indicator settings on attached screenshot.


Recommended products
Lisek Weis Wave
Darius Hans Lischka
5 (3)
This Weis Wave Volume indicator is a tool to help traders identify the current price trend.  Understanding volume can provide insight into a market's behavior to help you determine its overall health. The most important rule is this: volume precedes price. Typically, before a market price moves, volume comes into play. It has 2 main colors histogram which are green and red. – Green indicates an upward wave. The more the price increases, the bigger the green volume gets. – The red color shows a d
FREE
Market Profile 3
Hussien Abdeltwab Hussien Ryad
3 (2)
Market Profile 3 MetaTrader 4 indicator  — is a classic Market Profile implementation that can show the price density over time, outlining the most important price levels, value area, and control value of a given trading session. This indicator can be attached to timeframes between M1 and D1 and will show the Market Profile for daily, weekly, monthly, or even intraday sessions. Lower timeframes offer higher precision. Higher timeframes are recommended for better visibility. It is also possible t
FREE
The indicator allows you to trade binary options. The recommended time frame is М1 and the expiration time is 1,2,3 minutes. The indicator suitable for auto and manual trading. A possible signal is specified as a arrows above/under a candle. You should wait until the candle closes! Arrows are not re-painted Trade sessions: TOKYO section (Half-end) Currency pairs: USD/JPY Working time frame: M1 Expiration time: 1,2,3 minutes. The indicator also shows good results when using the martingale strateg
FREE
High Low Open Close MT4
Alexandre Borela
4.81 (21)
If you like this project, leave a 5 star review. This indicator draws the open, high, low and closing prices for the specified period and it can be adjusted for a specific timezone. These are important levels looked by many institutional and professional traders and can be useful for you to know the places where they might be more active. The available periods are: Previous Day. Previous Week. Previous Month. Previous Quarter. Previous year. Or: Current Day. Current Week. Current Month. Current
FREE
Forex Market Profile and Vwap
Lorentzos Roussos
4.86 (7)
Volume Profile Indicator / Market Profile Indicator What this is not : FMP is not the classic letter-coded TPO display , does not display the overall chart data profile calculation , and , it does not segment the chart into periods and calculate them. What it does :  Most importantly ,the FMP indicator will process data that resides between the left edge of the user defined spectrum and the right edge of the user defined spectrum. User can define the spectrum by just pulling each end of the indi
FREE
Zig Zag 123
Stephen Reynolds
Zig Zag 123 tells us when a reversal or continuation is more likely by looking at the shift in supply and demand. When this happens a signature pattern appears known as 123 (also known ABC) will often break out in direction of higher low or lower high. Stop loss and take profit levels have been added. There is a panel that shows the overall performance of your trades for if you was to use these stop loss and take profit levels.  We get alerted if a pattern 123 appears and also if the price re
FREE
Rainbow MT4
Jamal El Alama
Rainbow MT4 is a technical indicator based on Moving average with period 34 and very easy to use. When price crosses above MA and MA changes color to green, it’s a signal to buy. When price crosses below MA and MA changes color to red, it’s a signal to sell. The Expert advisor ( Rainbow EA MT4) based on Rainbow MT4 indicator, as you can see in the short video below is now available here .
FREE
PZ Penta O MT4
PZ TRADING SLU
2.33 (3)
The Penta-O is a 6-point retracement harmonacci pattern which usually precedes big market movements. Penta-O patterns can expand and repaint quite a bit. To make things easier this indicator implements a twist: it waits for a donchian breakout in the right direction before signaling the trade. The end result is an otherwise repainting indicator with a very reliable trading signal. The donchian breakout period is entered as an input. [ Installation Guide | Update Guide | Troubleshooting | FAQ | A
FREE
SMA Indicator
Nitu Brijesh Yadav
Arrow Indicator (Buy/Sell Alerts) – Simple Yet Powerful Tool!             Product Version: 1.01           Indicator Type: Trend Reversal Signals           Timeframes Supported: All (Recommended: H1, H4, D1)           Key Features: Buy Signal: Green upward arrow () appears below the candle  Sell Signal : Red downward arrow () appears above the candle Accurate Trend Reversal Detection – Based on tried and tested SMA strategy. ️ Clean Chart View – Minimalist, non-i
FREE
PipTick VSA MT4
Michal Jurnik
1 (2)
The   Volume Spread Analysis indicator   is based on the original Volume Spread Analysis method. It was designed for quick and easy recognition of VSA patterns. Even though this indicator looks very simple, it is the most sophisticated tool we've ever made. It is a really powerful analytical tool that generates very reliable trading signals. Because it is very user-friendly and understandable, it is suitable for every type of trader, regardless of his experience. What is VSA? VSA - Volume Spre
Traditional MACD MT4
Daniel Lewis
4.58 (55)
MACD indicator in MetaTrader 4/5 looks different than MACD does in most other charting software. That is because the MetaTrader 4/5 version of MACD displays the MACD line as a histogram when it is traditionally displayed as a line. Additionally, the MetaTrader 4/5 version computes the Signal line using an SMA, while according to MACD definition it is supposed to be an EMA. The MetaTrader 4/5 version also does not compute a true MACD Histogram (the difference between the MACD/Signal lines). This
FREE
Volume Compair
Thiago Pereira Pinho
Professional Cumulative Delta & Volume Median Indicator Track   real buying/selling pressure   with this powerful volume analysis tool. The   Volume Compare Indicator   combines   Cumulative Delta   and   Volume Medians   to help you identify institutional activity, imbalances, and potential reversals. Key Features:   Cumulative Delta Histogram   – Visualizes net buying vs. selling volume in real-time.   Buy/Sell Volume Medians   – Horizontal lines showing average buy & sell volume lev
RadarBoard
Vitali Platonov
We all know that if gasoline prices rise, the cost of absolutely everything increases. After all, the higher cost of freight transportation is factored into the delivery price of any product. Or take an example from everyday life—a hot year leads to a surplus of grain, and as a result, producers will lower prices to adapt to market supply. In the same way, the RadarBoard indicator helps uncover obvious correlations in the forex markets. If gold becomes more expensive, it is bought with dollars,
FREE
The   Volume Weighted ATR indicator   is a helpful tool for measuring market activity. It is based on the idea of the Volume-Weighted ATR. Combining these two elements helps identify potential turning points or breakout opportunities. The indicator for the classification of the activity of the market uses the moving average and its multiples. Accordingly, where the VWATR bar is located (relative to the moving average), it is labelled as ultra-low, low, average, high, very high or ultra high. Th
FREE
Cumulative Delta MT4
Evgeny Shevtsov
4.86 (29)
The indicator analyzes the volume scale and splits it into two components - seller volumes and buyer volumes, and also calculates the delta and cumulative delta. The indicator does not flicker or redraw, its calculation and plotting are performed fairly quickly, while using the data from the smaller (relative to the current) periods. The indicator operation modes can be switched using the Mode input variable: Buy - display only the buyer volumes. Sell - display only the seller volumes. BuySell -
FREE
The Auto Fibonacci Indicator is a professional technical analysis tool that automatically draws Fibonacci retracement levels based on the most recent closed Daily (D1) or 4-Hour (H4) candle. These levels are widely used by traders to identify key support , resistance , and trend reversal zones . This version is designed for manual trading and supports a powerful trading strategy using Fibonacci levels combined with a 50-period EMA (Exponential Moving Average) , which you can easily add from MT4
FREE
Pips forex - is a ready trading system . This indicator shows with arrows on the chart when and in what direction you need to open an order. If the arrow is green, then we open a buy deal, and if the arrow is red, then we open a sell deal. Everything is very simple and quite effective. TakeProfit set 15-25 points. StopLoss set at the level of points. When the dots move, we immediately override the StopLoss. Recommended timeframe for trading M1 and M5. This is a scalping strategy and works best
Candle Pattern Finder Candle Pattern Finder is a powerful MT4 indicator designed to help traders easily detect key candlestick patterns in real-time. Whether you're trading trends, reversals, or consolidations, this tool highlights important price action signals directly on the chart — helping you make faster and more confident trading decisions. Detects popular candlestick patterns: Bullish/Bearish Engulfing Hammer & Inverted Hammer Shooting Star & Hanging Man Three White Soldiers Three Black
FREE
Railway Tracks Pattern — Reversal Pattern Indicator Railway Tracks Pattern is an indicator that automatically detects a powerful two-candle reversal pattern on the chart. It looks for two candles with opposite directions (bullish and bearish), similar in size, and with minimal wicks — a clear sign of momentum shift. How it works: The first candle is strong and directional. The second candle moves in the opposite direction and is of similar size. Both candles have small shadows (wicks). The
FREE
This indicator help to mark the high and low of the session Asian,London,Newyork , with custom hour setting This indicator is set to count from minute candle so it will move with the current market and stop at the designated hour and create a accurate line for the day. below is the customization that you can adjust : Input Descriptions EnableAsian Enables or disables the display of Asian session high and low levels. EnableLondon Enables or disables the display of London session high and
FREE
TMA AI Bands
Monique Ellen Miranda Dos Santos
The TMA AI Bands indicator is based on the Triangular Moving Average (TMA) with dynamic upper and lower bands and clear buy/sell arrows plotted directly on the chart. It features integrated AI for adaptive optimization and guarantees no repaint, providing precise reversal signals when price touches the bands. Pairs: works with all currency pairs Recommended timeframes: D1 / W1 / MN Configurable external variables: TimeFrame – calculation period HalfLength – smoothing of the average BandsDeviatio
Features: 1- Get OB/OS Levels from Golden MA Levels 2- Wait for Buy/Sell Start Level Cross 3- Optional: Should price cross Mid Level in earlier bars 4- Optional: Crossing bar High/Medium Volume 5- Optional: MA Stacked to check up/down trend for current TF 6- Optional: NRTR higher timeframes aligned Check Detailed blog post explained: https://www.mql5.com/en/blogs/post/758457 Levels with Buffers available here: Golden MA Levels Indicator: https://www.mql5.com/en/market/product/119515 Note: Arr
FREE
AP VWAP Bands Pro (MT4) Volume-weighted average price with ±σ bands for clear intraday bias, mean-reversion zones, and dynamic support/resistance. Works on crypto (incl. BTC), FX, indices, and metals. Uses tick-volume when real volume isn’t available. What it shows VWAP line (volume-weighted mean price). Two envelopes around VWAP (default ±1σ and ±2σ) to highlight balance vs. extension. Reset modes: Day, Week, or Anchor Time (HH:MM) to start VWAP where you need it (e.g., exchange open). Why
FREE
Check my paid tools they work great and I share Ea's based on them for free please r ate The Dual Timeframe RSI (Relative Strength Index) indicator is a novel trading tool that allows traders to monitor RSI readings from two different timeframes on a single chart. This dual perspective enables traders to identify potential trend confirmations and divergences more effectively. For instance, a trader might use a 1-hour RSI alongside a daily RSI to ensure that short-term trades align with the broa
FREE
Dollar Mint Indicator
David Mwaniki Mbugua
Dollar mint indicator is a special workmanship with years of experience in forex.   Dollar mint ea is a fully non repaint indicator optimised with price action data such that once it gives you a signal t . The indicator   can be used to trade anything on the mt4 with much ease. Benefits ; Fully non repaint Use in any timeframe Use in all the available tradable assets on mt4 Best to use on h4. It generates fully analysed buy and sell signals based on trend and also filters out retracements and
Volume Bar 2 Osc
Dmitry Iglakov
4 (6)
This indicator displays each bar's volume in points as a histogram. The second version of the indicator. Now it is represented as an oscillator. It is more informative and functional. At that it does not load the main chart. GitHub It displays: bar's volume in points as a histogram (buffer 0) average value of the volume for the whole period (buffer 1) bars upper than the client average value with another color (buffer 2) average value of the amount of bars set by a user (buffer 3) Also: setting
FREE
Extremum Reverse Bar
Yurij Izyumov
2.8 (5)
This indicator has been created for finding the probable reversal points of the symbol price. A small candlestick reversal pattern is used it its operation in conjunction with a filter of extremums. The indicator is not redrawn! If the extremum filter is disabled, the indicator shows all points that have a pattern. If the extremum filter is enabled, the condition works – if the history Previous bars 1 candles back contains higher candles and they are farther than the Previous bars 2 candle, such
FREE
Smart Trend Pro - Intelligent Trend Navigation System (Buy One Get One Free Limited Offer) Ultimate Trend Solution: Get Complete Trading System for $69 Purchase Smart Trend Pro, immediately receive BreakoutIgnition Pro (value $69) for FREE! Two professional indicators originally priced at $138, now only $69! Why Choose Smart Trend Pro? Three Core Advantages Visual Trend Navigation - See market direction at a glance Intelligent Signal Filtering - Trade only high-probability opportunities All T
Trade History Drawer
David Leander Tschacher
Trade History Drawer is an indicator for MetaTrader 4. It shows trades on the chart and draws them in customized colors. Furthermore, the indicator shows a trade summary and saves a CSV history file for either one selected pair or all pairs. Inputs General Settings Number Trades : Number of trades to be drawn on the chart, if -1 then all trades Magic Number : Only trades with this magic number, if -1 then ignore Line Style : Line Style Line Thickness : Line Thickness Arrow Size : Arrow Size
Max LotSize
Luis Alberto Atuncar Sanchez
5 (2)
LotSize Indicator Discover the appropriate lot size to use in your trades based on the available margin. This indicator provides valuable information for risk management. If the indicator shows a value of 0, it means that your balance or available margin is insufficient for trading. It is important to maintain adequate margin levels for safe trading practices. This indicator is exclusively designed for the MT4 platform, a popular and reliable trading platform in the market. With the LotSize Indi
FREE
Buyers of this product also purchase
Gann Made Easy
Oleg Rodin
4.82 (147)
Gann Made Easy is a professional and easy to use Forex trading system which is based on the best principles of trading using the theory of W.D. Gann. The indicator provides accurate BUY and SELL signals including Stop Loss and Take Profit levels. You can trade even on the go using PUSH notifications. PLEASE CONTACT ME AFTER PURCHASE TO GET TRADING TIPS, BONUSES  AND GANN MADE EASY EA ASSISTANT  FOR FREE! Probably you already heard about the Gann trading methods before. Usually the Gann theory is
BLACK FRIDAY – 40% OFF NOW! Best Solution for any Newbie or Expert Trader! This dashboard software is working on 28 currency pairs plus one. It is based on 2 of our main indicators (Advanced Currency Strength 28 and Advanced Currency Impulse). It gives a great overview of the entire Forex market plus Gold or 1 indices. It shows Advanced Currency Strength values, currency speed of movement and signals for 28 Forex pairs in all (9) timeframes. Imagine how your trading will improve when you can wat
Meravith
Ivan Stefanov
5 (1)
Market makers' tool. The indicator analyzes volume from every point and calculates exhaustion market levels for that volume. ( This is a manual indicator and contains features that may not supported by the MetaTrader current testing environment ) Meravith main lines: - Bullish volume exhaustion line   - serves as a target. - Bearish volume exhaustion line   - serve as a target. -   A line indicating the market trend. It changes color depending on whether the market is bullish or bearish and s
M1 Sniper
Oleg Rodin
4.89 (18)
M1 SNIPER is an easy to use trading indicator system. It is an arrow indicator which is designed for M1 time frame. The indicator can be used as a standalone system for scalping on M1 time frame and it can be used as a part of your existing trading system. Though this trading system was designed specifically for trading on M1, it still can be used with other time frames too. Originally I designed this method for trading XAUUSD and BTCUSD. But I find this method helpful in trading other markets a
Trend indicator AI
Ramil Minniakhmetov
5 (74)
Trend Ai indicator is great tool that will enhance a trader’s market analysis by combining trend identification with actionable entry points and reversal alerts.  This indicator empowers users to navigate the complexities of the forex market with confidence and precision Beyond the primary signals, Trend Ai indicator identifies secondary entry points that arise during pullbacks or retracements, enabling traders to capitalize on price corrections within the established trend. Important Advantage
Advanced Supply Demand
Bernhard Schweigert
4.91 (296)
BLACK FRIDAY – 42% OFF NOW! Best Solution for any Newbie or Expert Trader! This indicator is a unique, high quality and affordable trading tool because we have incorporated a number of proprietary features and a new formula. With this update, you will be able to show double timeframe zones. You will not only be able to show a higher TF but to show both, the chart TF, PLUS the higher TF: SHOWING NESTED ZONES. All Supply Demand traders will love it. :) Important Information Revealed Maximize the p
Scalper Inside PRO
Alexey Minkov
4.74 (69)
An exclusive indicator that utilizes an innovative algorithm to swiftly and accurately determine the market trend. The indicator automatically calculates opening, closing, and profit levels, providing detailed trading statistics. With these features, you can choose the most appropriate trading instrument for the current market conditions. Additionally, you can easily integrate your own arrow indicators into Scalper Inside Pro to quickly evaluate their statistics and profitability. Scalper Inside
Looking for a powerful yet lightweight swing detector that accurately identifies market structure turning points? Want clear, reliable buy and sell signals that work across any timeframe and any instrument? Buy Sell Arrow MT Swing is built exactly for that — precision swing detection made simple and effective. This indicator identifies Higher Highs (HH) , Higher Lows (HL) , Lower Highs (LH) , and Lower Lows (LL) with remarkable clarity. It is designed to help traders easily visualize market str
SMC Easy Signal
Mohamed Hassan
4.69 (13)
3 copies left at $65, next price is $120 SMC Easy Signal was built to remove the confusion around the smart money concept by turning structural shifts like BOS (Break of Structure) and CHoCH (Change of Character) into simple buy and sell trading signals. It simplifies market structure trading by automatically identifying breakouts and reversals as they happen, allowing traders to focus on execution rather than analysis. Whether the market is continuing its trend or preparing to reverse, the i
Currency Strength Exotics
Bernhard Schweigert
4.88 (33)
CURRENTLY 20% OFF ! Best Solution for any Newbie or Expert Trader! This Indicator is specialized to show currency strength for any symbols like Exotic Pairs Commodities, Indexes or Futures. Is first of its kind, any symbol can be added to the 9th line to show true currency strength of Gold, Silver, Oil, DAX, US30, MXN, TRY, CNH etc. This is a unique, high quality and affordable trading tool because we have incorporated a number of proprietary features and a new formula. Imagine how your trading
M1 Arrow
Oleg Rodin
5 (19)
M1 Arrow is an indicator which is based on natural trading principles of the market which include volatility and volume analysis. The indicator can be used with any time frame and forex pair. One easy to use parameter in the indicator will allow you to adapt the signals to any forex pair and time frame you want to trade. The Arrows DO NOT REPAINT and DO NOT LAG! The algorithm is based on the analysis of volumes and price waves using additional filters. The intelligent algorithm of the indicator
FX Volume
Daniel Stein
4.62 (37)
FX Volume: Experience Genuine Market Sentiment from a Broker’s Perspective Quick Overview Looking to elevate your trading approach? FX Volume provides real-time insights into how retail traders and brokers are positioned—long before delayed reports like the COT. Whether you’re aiming for consistent gains or simply want a deeper edge in the markets, FX Volume helps you spot major imbalances, confirm breakouts, and refine your risk management. Get started now and see how genuine volume data can
Currency Strength Wizard is a very powerful indicator that provides you with all-in-one solution for successful trading. The indicator calculates the power of this or that forex pair using the data of all currencies on multiple time frames. This data is represented in a form of easy to use currency index and currency power lines which you can use to see the power of this or that currency. All you need is attach the indicator to the chart you want to trade and the indicator will show you real str
Dynamic Forex28 Navigator
Bernhard Schweigert
4.43 (7)
Specials Discount now. The Next Generation Forex Trading Tool. Dynamic Forex28 Navigator is the evolution of our long-time, popular indicators, combining the power of three into one: Advanced Currency Strength28 Indicator (695 reviews) + Advanced Currency IMPULSE with ALERT (520 reviews) + CS28 Combo Signals (recent Bonus) Details about the indicator  https://www.mql5.com/en/blogs/post/758844 What Does The Next-Generation Strength Indicator Offer? Everything you loved about the originals, now
Trend Screener
STE S.S.COMPANY
4.79 (95)
Unlock the Power of Trends Trading with the Trend Screener Indicator: Your Ultimate Trend Trading Solution powered by Fuzzy Logic and Multi-Currencies System! Elevate your trading game with the Trend Screener, the revolutionary trend indicator designed to transform your Metatrader into a powerful Trend Analyzer. This comprehensive tool leverages fuzzy logic and integrates over 13 premium features and three trading strategies, offering unmatched precision and versatility. LIMITED TIME OFFER : Tre
PZ Swing Trading
PZ TRADING SLU
5 (3)
Protect against whipsaws: revolutionize your swing trading approach Swing Trading is the first indicator designed to detect swings in the direction of the trend and possible reversal swings. It uses the baseline swing trading approach, widely described in trading literature. The indicator studies several price and time vectors to track the aggregate trend direction and detects situations in which the market is oversold or overbought and ready to correct. [ Installation Guide | Update Guide | Tro
BLACK FRIDAY – 46% OFF NOW! Best Solution for any Newbie or Expert Trader! This Indicator is a unique, high quality and affordable trading tool because we have incorporated a number of proprietary features and a new formula. With only ONE chart you can read Currency Strength for 28 Forex pairs! Imagine how your trading will improve because you are able to pinpoint the exact trigger point of a new trend or scalping opportunity? User manual: click here That's the first one, the original! Don't buy
ACB Breakout Arrows
KEENBASE SOFTWARE SOLUTIONS
4.15 (34)
The ACB Breakout Arrows indicator provides a crucial entry signal in the market by detecting a special breakout pattern. The indicator constantly scans the chart for a settling momentum in one direction and provide the accurate entry signal right before the major move.  Get multi-symbol and multi-timeframe scanner from here - Scanner for ACB Breakout Arrows MT4 Key features Stoploss and Take Profit levels are provided by the indicator. Comes with a MTF Scanner dashboard which tracks the breako
PRO Renko System
Oleg Rodin
5 (29)
PRO Renko System is a highly accurate trading system specially designed for trading RENKO charts. The ARROWS and Trend Indicators DO NOT REPAINT! The system effectively neutralizes so called market noise giving you access to accurate reversal signals. The indicator is very easy to use and has only one parameter responsible for signal generation. You can easily adapt the tool to any trading instrument of your choice and the size of the renko bar. I am always ready to provide extra support to help
FX Power MT4 NG
Daniel Stein
4.95 (20)
FX Power: Analyze Currency Strength for Smarter Trading Decisions Overview FX Power is your go-to tool for understanding the real strength of currencies and Gold in any market condition. By identifying strong currencies to buy and weak ones to sell, FX Power simplifies trading decisions and uncovers high-probability opportunities. Whether you’re looking to follow trends or anticipate reversals using extreme delta values, this tool adapts seamlessly to your trading style. Don’t just trade—trade
Day Trader Master is a complete trading system for traders who prefer intraday trading. The system consists of two indicators. The main indicator is the one which is represented by arrows of two colors for BUY and SELL signals. This is the indicator which you actually pay for. I provide the second indicator to my clients absolutely for free. This second indicator is actually a good trend filter indicator which works with any time frame. THE INDICATORS DO NOT REPAINT AND DO NOT LAG! The system is
Special offer : ALL TOOLS , just $35 each! New tools   will be   $30   for the   first week   or the   first 3 purchases !  Trading Tools Channel on MQL5 : Join my MQL5 channel to update the latest news from me Volumatic Support/Resistance Levels Scanner is a support‑and‑resistance indicator that adds volume context to price structure. By showing how trading activity clusters around recent pivots, it helps users see where buying or selling interest has been most active. See more MT5 version at:
Entry Points Pro
Yury Orlov
4.61 (171)
Top indicator for MT4 providing accurate signals to enter a trade without repainting! Watch  the video  (6:22) with an example of processing only one signal that paid off the indicator! It can be applied to any financial assets:  forex, cryptocurrencies, metals, stocks, indices.  MT5 version is here   It will provide pretty accurate trading signals and tell you when it's best to open a trade and close it. Most traders improve their trading results during the first trading week with the help of t
Hidden Cycles
Lev Vladimirovic Marushkin
5 (1)
Black Friday Sale – Limited Time! Grab Hidden Cycles for only $129 (regular price $179 ). This is your chance to boost your strategy with a powerful, easy-to-use cycle-based trading tool. Offer ends soon — don’t miss it! Based on Universal Laws — NOT Some Guy’s Algorithm: Let the market adjust to the Hidden Cycles Geometry — not the other way around. Most indicators are based on a man-made formula. They often lag, fail over time, or need constant re-optimization.  Hidden Cycles is different.
Speed Trend Matrix Ultimate (Version 5.10) Speed Trend Matrix (STM) is a comprehensive trading system wrapped into a single indicator. Unlike standard oscillators that simply show overbought or oversold conditions, the STM analyzes the "velocity" of price movement relative to market volatility (ATR). It identifies not just the trend direction, but the strength behind the move, filtering out low-momentum "flat" periods where traders often get caught in whipsaws. This tool is designed for traders
Upper and Lower Reversal - Early forecasting system for reversal points. Allows you to find price reversal points on the boundaries of the upper and lower price movement channels. The indicator will never repaint or change the position of the signal arrows. Red arrows are a buy signal, Blue arrows are a sell signal. Adapts to any time frames and trading instruments The indicator does not repaint, it works only when the candle closes. There are several types of alerts for signals The indicator i
Advanced Currency IMPULSE with ALERT
Bernhard Schweigert
4.91 (489)
BLACK FRIDAY – 50% OFF NOW! Best Solution for any Newbie or Expert Trader! This indicator is a unique, high quality and affordable trading tool because we have incorporated a number of proprietary features and a secret formula. With only ONE chart it gives Alerts for all 28 currency pairs. Imagine how your trading will improve because you are able to pinpoint the exact trigger point of a new trend or scalping opportunity! Built on new underlying algorithms it makes it even easier to identify and
Royal Wave Pro M4
Vahidreza Heidar Gholami
5 (3)
Royal Wave is a Trend-Power oscillator which has been programmed to locate and signal low-risk entry and exit zones. Its core algorithm statistically analyzes the market and generates trading signals for overbought, oversold and low volatile areas. By using a well-designed alerting system, this indicator makes it easier to make proper decisions regarding where to enter and where to exit trades. Features Trend-Power Algorithm Low risk Entry Zones and Exit Zones Predictions for Overbought and Over
Volatility Master for MetaTrader is a real-time dashboard tool that scans up to 56 symbols using up to 2 flexible dashboards on different charts to identify high-volatility, trending markets instantly. With clear bullish/bearish signals, customizable alerts, and a user-friendly interface, it helps you avoid range-bound conditions and focus on high-probability trades. Clarity leads to confidence. Trade confidently and protect your capital effectively with this powerful dashboard. Download Metatra
Special offer : ALL TOOLS , just $35 each! New tools   will be   $30   for the   first week   or the   first 3 purchases !  Trading Tools Channel on MQL5 : Join my MQL5 channel to update the latest news from me RSI Shift Zone Scanner identifies moments when market sentiment may change by linking RSI signals with price action. Whenever the RSI moves above or below preset levels (default 70 for overbought, 30 for oversold), the indicator draws a channel directly on the chart. These channels mark
More from author
VSA Histogram
Richard Bystricky
VSA - P (Volume Spread Analysis) Period-Based Histogram is a tool that visually represents market volume dynamics using Volume Spread Analysis principles, with a focus on highlighting key volume changes over specific time periods. The histogram captures changes in volume and price spread relationships in real-time, enabling traders to detect early signals of accumulation, distribution, and shifts in buying or selling pressure. Indicator is non repainting and working with real-time on tick data.
ROC Histogram
Richard Bystricky
ROC (Rate of Change) indicator tracks the price movement dynamics by measuring the percentage change between the current price and a previous value over a specified time frame (based on Demark logic). This histogram identifies the speed of trend changes, enabling early recognition of overbought or oversold conditions, reversals in the market. The ROC is a useful tool for traders focused on trend-following as well as short-term strategies. Indicator is non repainting and working with real-time o
VWAP Histogram
Richard Bystricky
The VWAP Histogram Indicator is a powerful tool for traders, designed to visualize the Volume Weighted Average Price (VWAP) as a dynamic histogram. By combining VWAP with a clear histogram representation, this indicator provides deeper insights into price action and volume dynamics, helping traders identify key market levels more effectively. Key Features: Histogram Representation: Displays VWAP as a histogram directly in the indicator window, offering an intuitive view of price deviations and v
Filter:
No reviews
Reply to review