KT Psar Arrows
- Indicatori
-
KEENBASE SOFTWARE SOLUTIONS
 Keenbase Trading sviluppa indicatori professionali ed Expert Advisor per MetaTrader 4 e MetaTrader 5, progettati per aiutare i trader a prendere decisioni di trading più consapevoli.
 - Versione: 2.1
- Aggiornato: 25 marzo 2022
- Attivazioni: 10
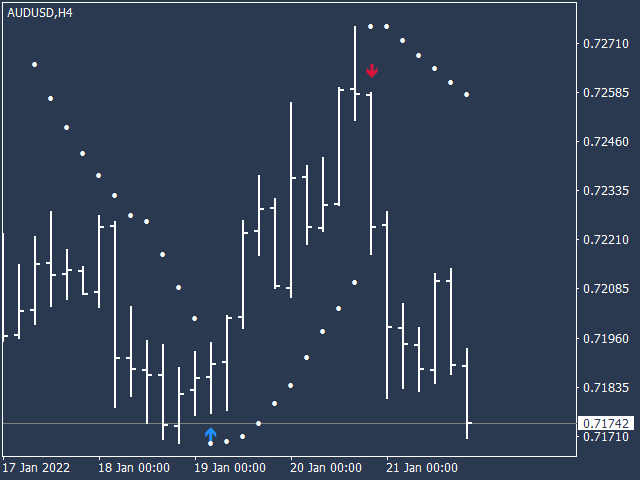
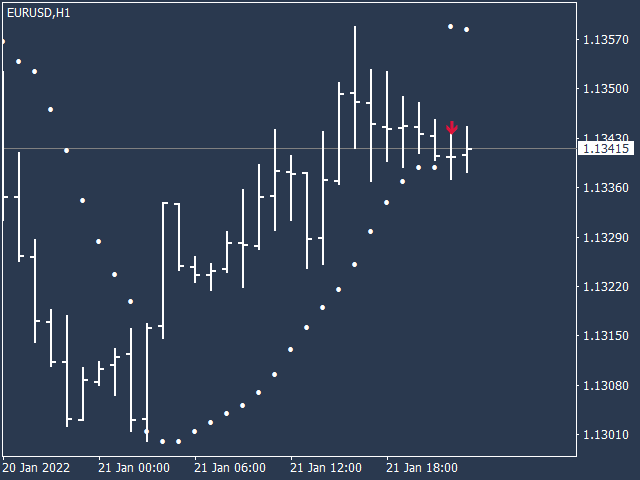
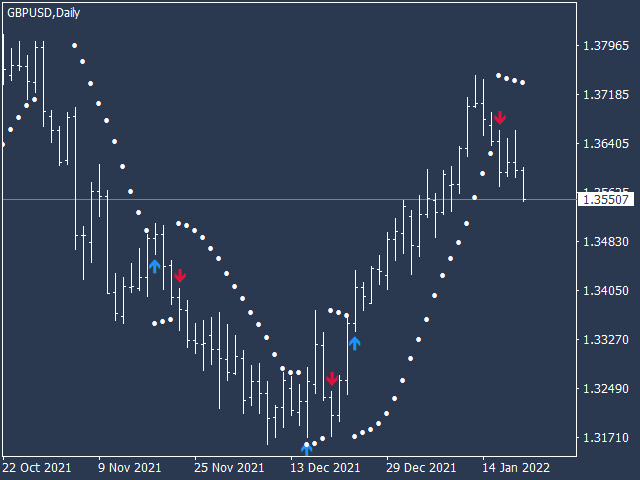
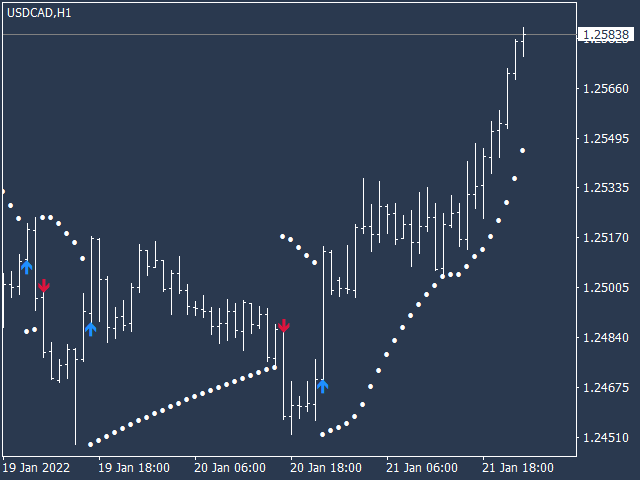
KT Psar Arrows traccia frecce sul grafico utilizzando l'indicatore standard Parabolic SAR. Una freccia rialzista viene tracciata quando il massimo della candela tocca il SAR. Una freccia ribassista viene tracciata quando il minimo della candela tocca il SAR. I segnali vengono generati in tempo reale senza attendere la chiusura della candela.
Funzionalità
- Uno strumento utile per i trader che desiderano sperimentare strategie di trading che includono l'uso dell'indicatore Parabolic SAR.
- Può essere utilizzato per individuare punti di inversione del mercato.
- Supporta l'inserimento di parametri personalizzati per il PSAR.
- Disponibili tutti gli avvisi standard di MT4.
Nota: il Parabolic SAR è un indicatore ritardato e strettamente meccanico. Ogni operazione potenziale dovrebbe essere filtrata tramite regole ben definite.
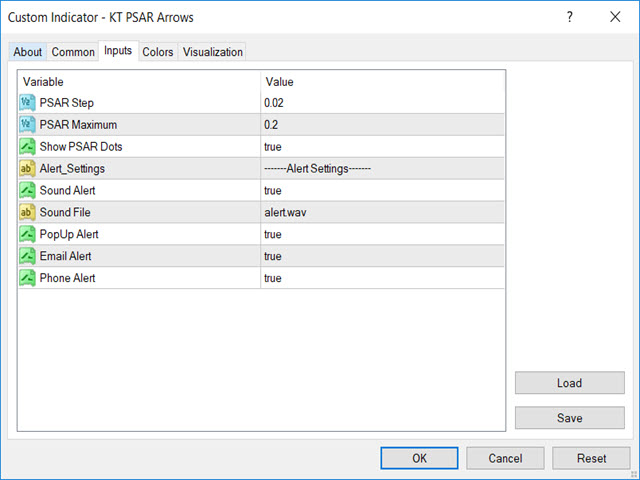
Parametri di input
- Passo PSAR: Inserire il valore del passo.
- Massimo PSAR: Inserire il valore massimo.
- Mostrare i punti PSAR: Mostrare/nascondere i punti PSAR. Le frecce funzioneranno normalmente anche senza la visualizzazione dei punti.
- Il resto dei parametri è autoesplicativo.