Visual Temporal Frame Fusion Indicator
- Indicators
- AL MOOSAWI ABDULLAH JAFFER BAQER
- Version: 1.0
- Activations: 5
Visual Temporal Frame Fusion: See the Market Through a Wider Lens
Unlock a new dimension of market clarity. Stop guessing the broader market direction and start seeing it directly on your trading chart.
The Visual Temporal Frame Fusion indicator is a powerful, professional-grade tool designed to solve one of the most common challenges traders face: multi-timeframe analysis. Instead of constantly switching between charts and losing focus, this indicator elegantly overlays the price structure of a superior timeframe onto your current chart, giving you an immediate and intuitive understanding of the market's bigger picture.
The Core Logic: Fusing Timeframes for Superior Insight
Successful trading is about context. A strong uptrend on a 5-minute chart might just be a minor pullback in a dominant daily downtrend. Without that higher timeframe context, you are trading with incomplete information.
Visual Temporal Frame Fusion provides this critical context by projecting the candles from a timeframe of your choice (e.g., Daily, H4, H1) as colored zones on your active trading chart. This allows you to instantly visualize the underlying forces driving the price action you see moment-to-moment.
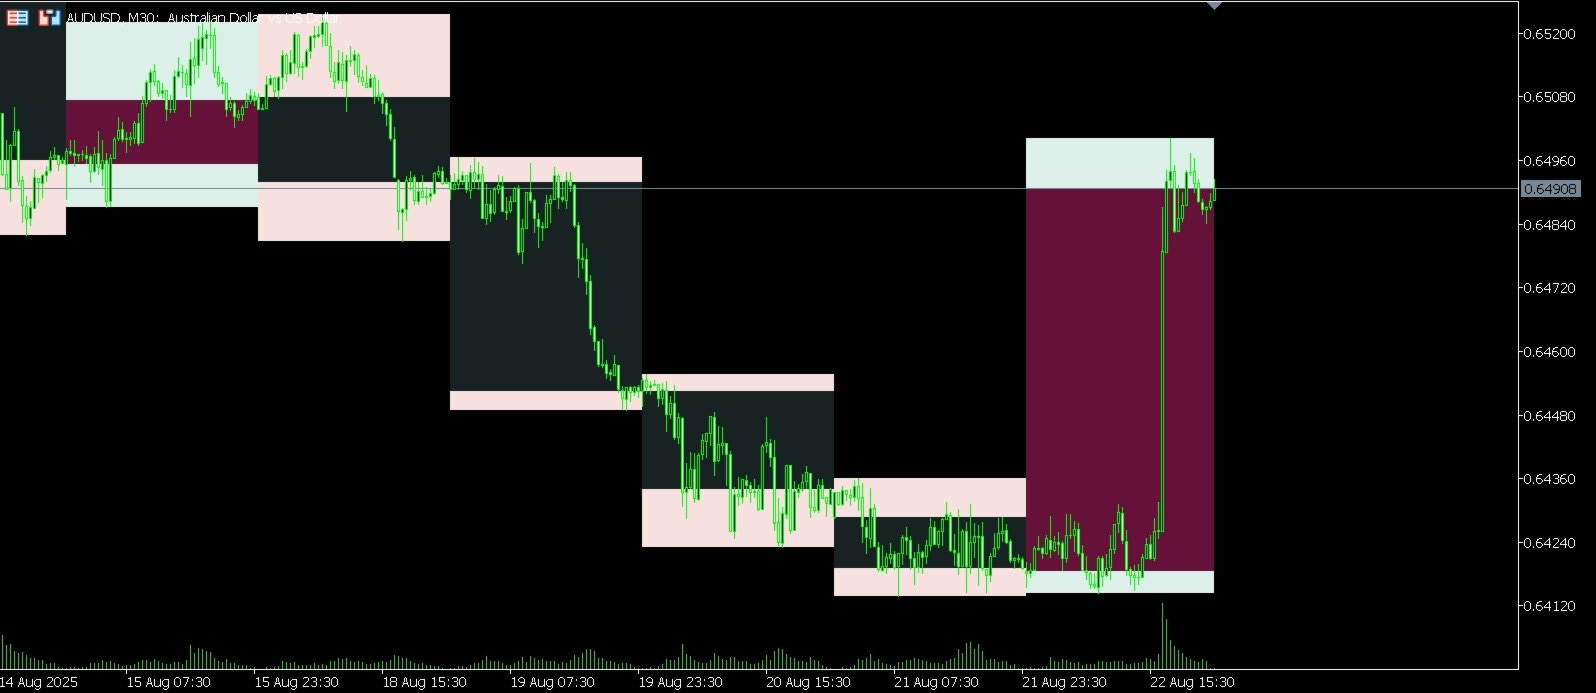
The indicator displays two distinct zones for each superior timeframe candle:
-
The Range Zone (High to Low): This lighter, semi-transparent zone represents the entire trading range of the higher timeframe candle. It acts as a dynamic map of potential support and resistance. When the price on your current chart approaches the top or bottom of this zone, you are testing a significant level from a broader perspective.
-
The Core Zone (Open to Close): This darker, more central zone represents the body of the higher timeframe candle. Its color and size provide an at-a-glance summary of market sentiment.
-
A green core zone indicates that the superior timeframe was bullish (close was higher than the open).
-
A red core zone indicates that the superior timeframe was bearish (close was lower than the open).
-
By observing these zones, you can instantly gauge whether the larger market forces are aligned with your intended trade, dramatically improving your decision-making process.
Key Features
-
Effortless Multi-Timeframe Analysis: See the Daily, H4, or any higher timeframe structure without ever leaving your M5 or M15 chart.
-
Instant Sentiment Reading: The TradingView-style green and red color scheme gives you an immediate read on the bullish or bearish pressure from the superior timeframe.
-
Automatic Support & Resistance: The high, low, open, and close of the superior candle create powerful, natural support and resistance levels, drawn automatically for you.
-
Full Visual Customization: Tailor the indicator to your personal chart aesthetic. Control the transparency of both the range and core zones, toggle borders, and adjust line thickness to create the perfect look.
-
Optimized Performance: The indicator is built for efficiency. It uses a smart timer-based update system to refresh the current, developing candle in real-time without consuming unnecessary computer resources. Historical zones are drawn once and remain static, ensuring your terminal runs smoothly.
-
Intelligent Timeframe Selection: The indicator automatically validates your timeframe choice. If you select a superior timeframe that is equal to or lower than your current chart, it will intelligently adjust to the next logical higher timeframe to ensure correct operation.
-
Clean & Professional Interface: No clutter. Just clear, actionable visual information that integrates seamlessly into your existing trading strategy.
How to Use It in Your Trading
Visual Temporal Frame Fusion is not a signal generator; it is a sophisticated context filter that enhances any existing strategy.
-
Trend Traders: Confirm that the superior timeframe's core zone color aligns with your trade direction. Go long only when the background context is bullish (green) and short only when it's bearish (red).
-
Range & Reversal Traders: Watch for price action at the boundaries of the Range Zone. These are high-probability areas for reversals or breakouts, as they represent significant highs and lows on a macro scale.
-
Scalpers & Day Traders: Use the Open and Close of the Core Zone as intraday pivot points for entries and targets.
Elevate your trading from two dimensions to three. With the Visual Temporal Frame Fusion indicator, you gain the critical third dimension of market depth, allowing you to trade with more confidence, clarity, and control.
Add it to your arsenal today for just $30 and transform the way you see the market.