Integrated Dashboard Scanner

5

Integrated Dashboard Scanner – Version 4.00

The Ultimate Market Command Center just got smarter. Now with Programmable Logic Presets.

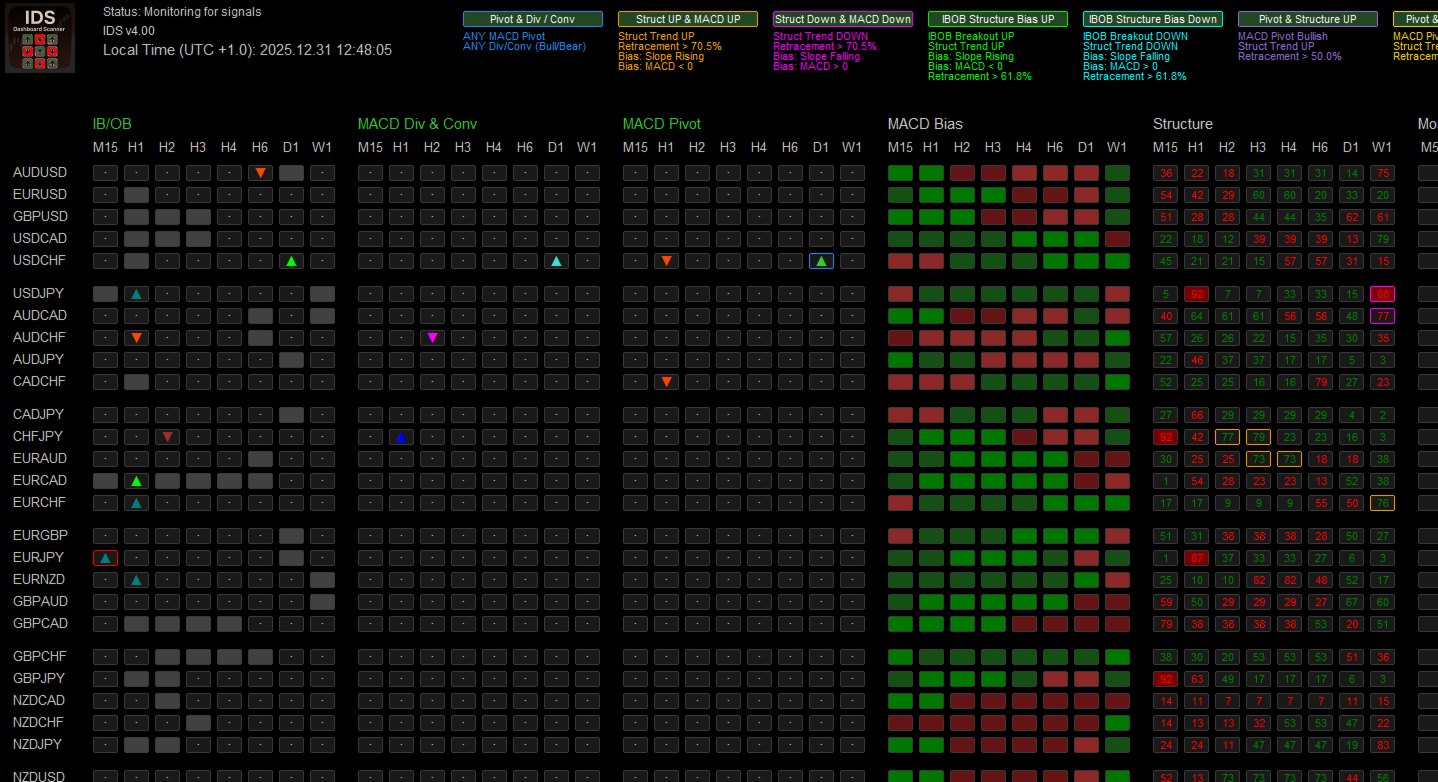
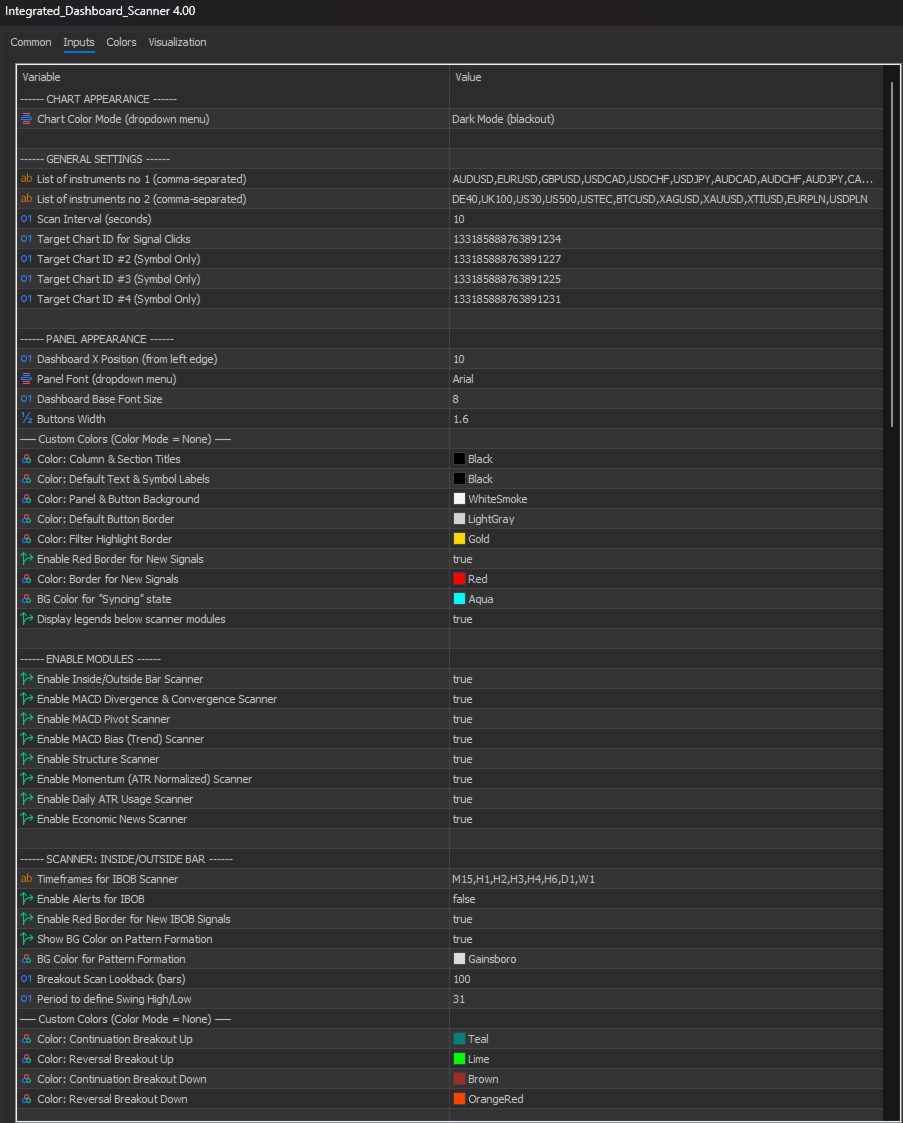
The Integrated Dashboard Scanner (IDS) monitors multiple symbols and timeframes from a single, DPI-aware panel. Version 4.00 introduces a revolutionary Preset Editor, allowing you to combine signals from different modules into complex, custom strategies without writing a single line of code.

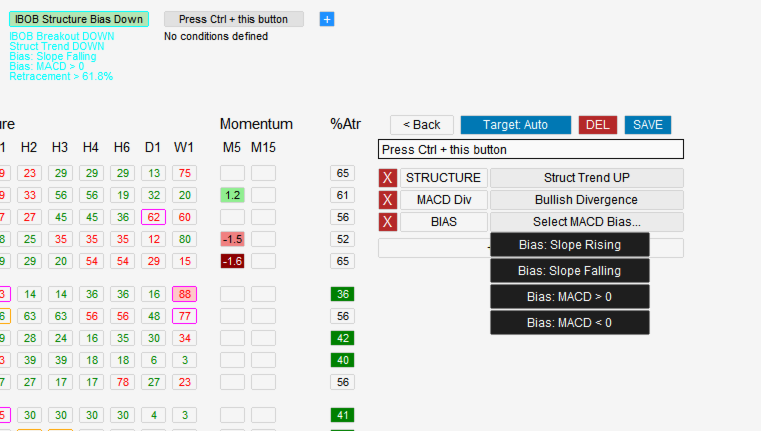
🚀 NEW IN VERSION 4.00: Filter Presets & Logic Editor

Stop scanning for single indicators. Start scanning for Strategies.
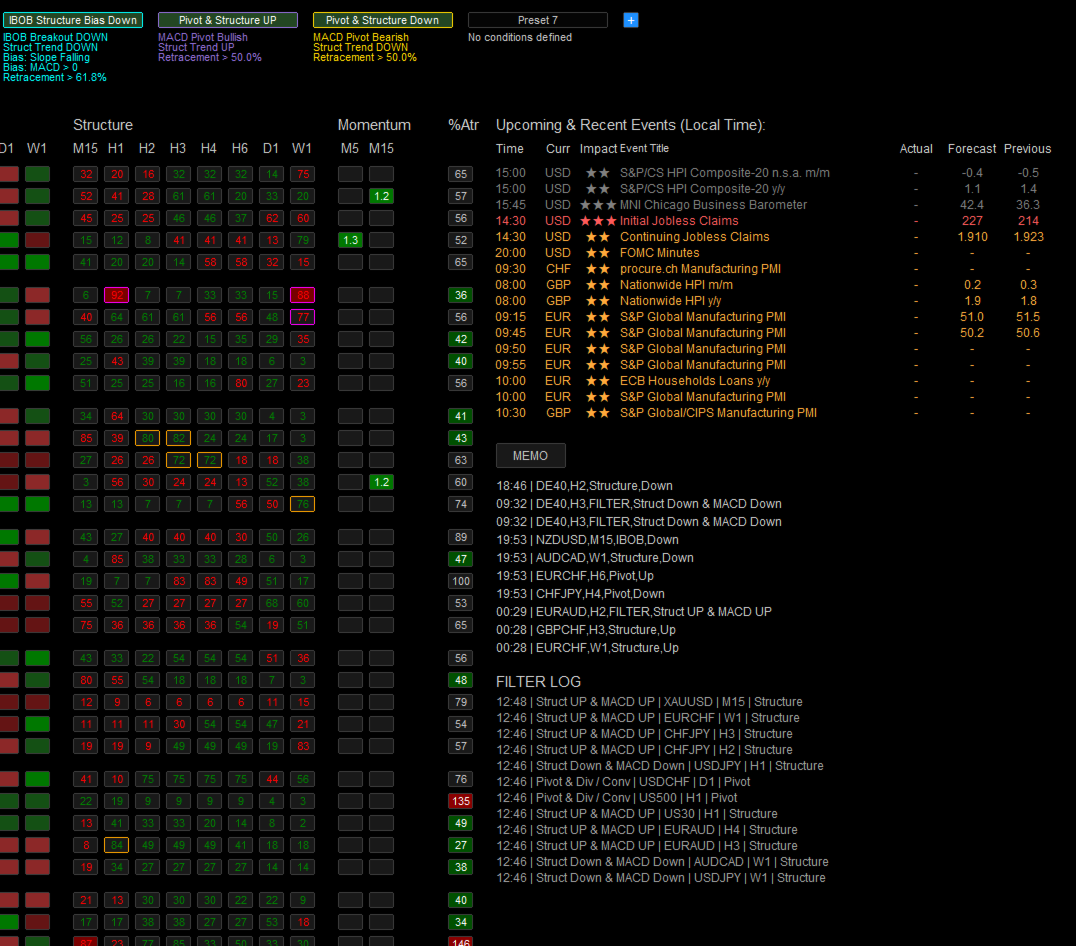
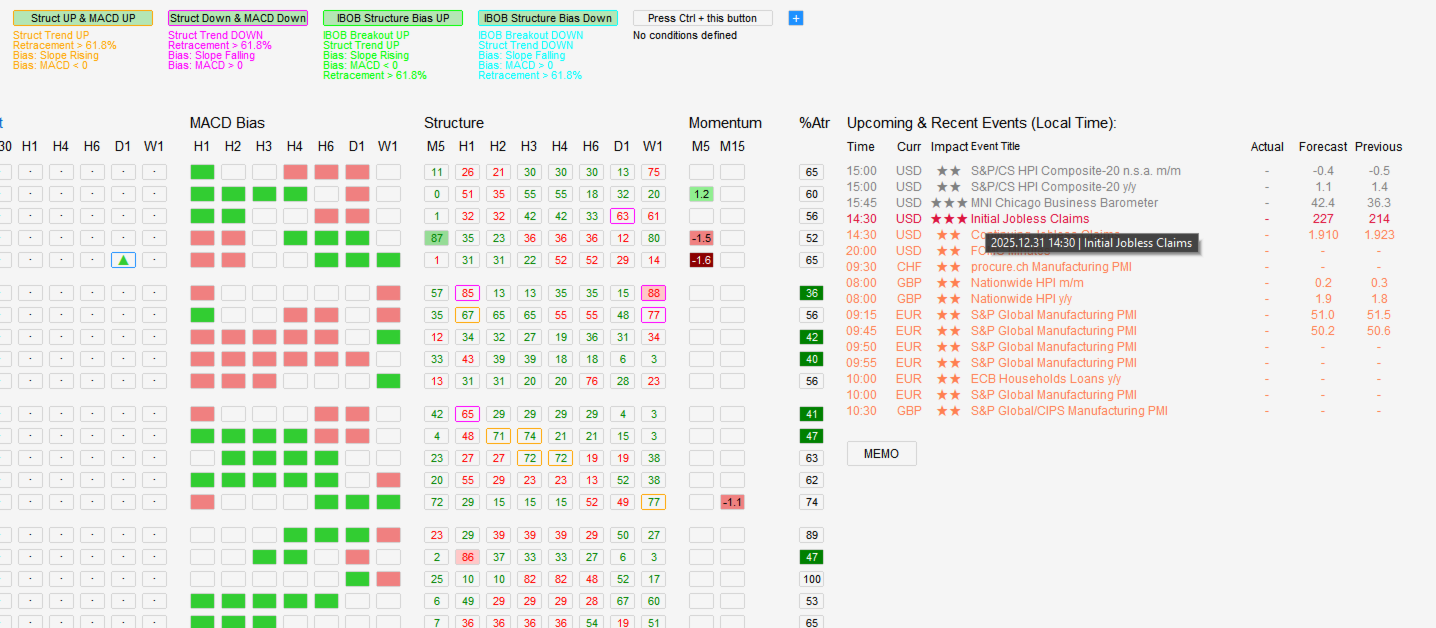
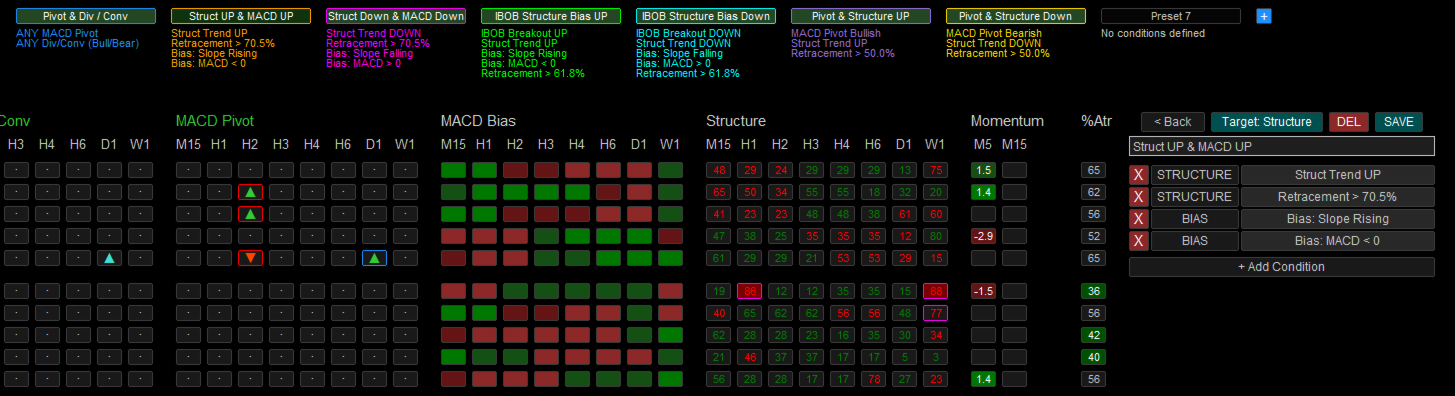
Version 4.00 allows you to define custom "Presets" that combine conditions from multiple modules using logical operators.

  • Create Your Own Logic: Want to find an Uptrend (Structure) combined with a Bullish Pivot (MACD) and Deep Retracement? You can now build this logic directly in the panel.
  • Visual Strategy Coding: Assign unique colors to each Preset. When a signal appears, the colored border tells you exactly which strategy matched (e.g., Blue for "Trend Following", Orange for "Reversal").
  • Context-Aware: Preset descriptions are displayed directly on the panel, so you always know what criteria were met.
  • Save & Load: Build your library of strategies and save them for instant access.

Key Features

  • Time-saving: Monitor all instruments from one panel—no more manual chart switching.
  • Programmable Logic (v4.00): Filter signals using AND logic across multiple modules.
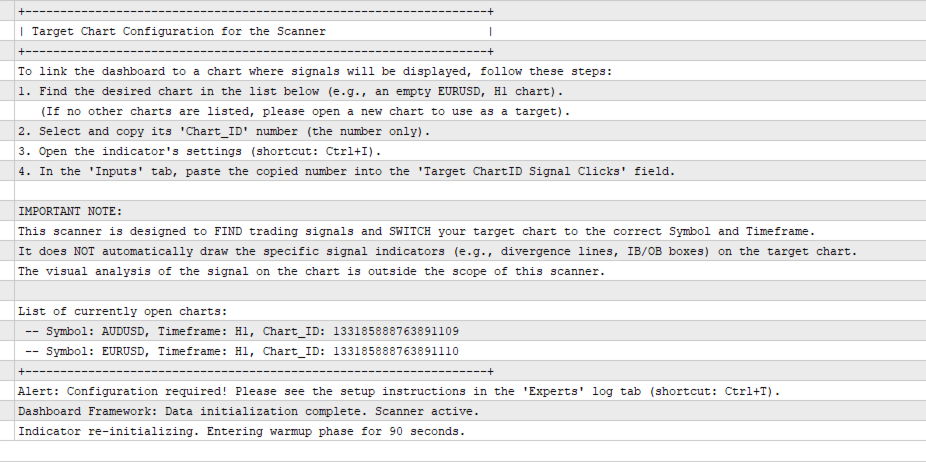
  • Multi-Chart Synchronization: Link up to 4 separate charts to the scanner. Clicking a signal updates your entire workspace instantly.
  • Memo System: Save and recall up to 10 custom setups or notes directly on the dashboard.
  • Interactive Alert Control: Toggle alerts for any module instantly by simply clicking the module's title.
  • DPI-Aware Interface: Automatically adjusts to your display scaling for crisp visuals on any monitor.

Scanning Modules Overview

Core Strategy Modules (Based on Dariusz Dargo's Methodology)

1. IB/OB Breakouts & Formations
Detects Inside Bar (consolidation) and Outside Bar (expansion) patterns at important price levels.

  • Swing Level Filter: Ensures patterns form at swing highs/lows, eliminating signals in sideways chops.
  • Breakout Classification: Visually distinguishes between continuation and reversal breakouts.
  • Formation Signals: Optionally highlights when a pattern forms before the breakout occurs.

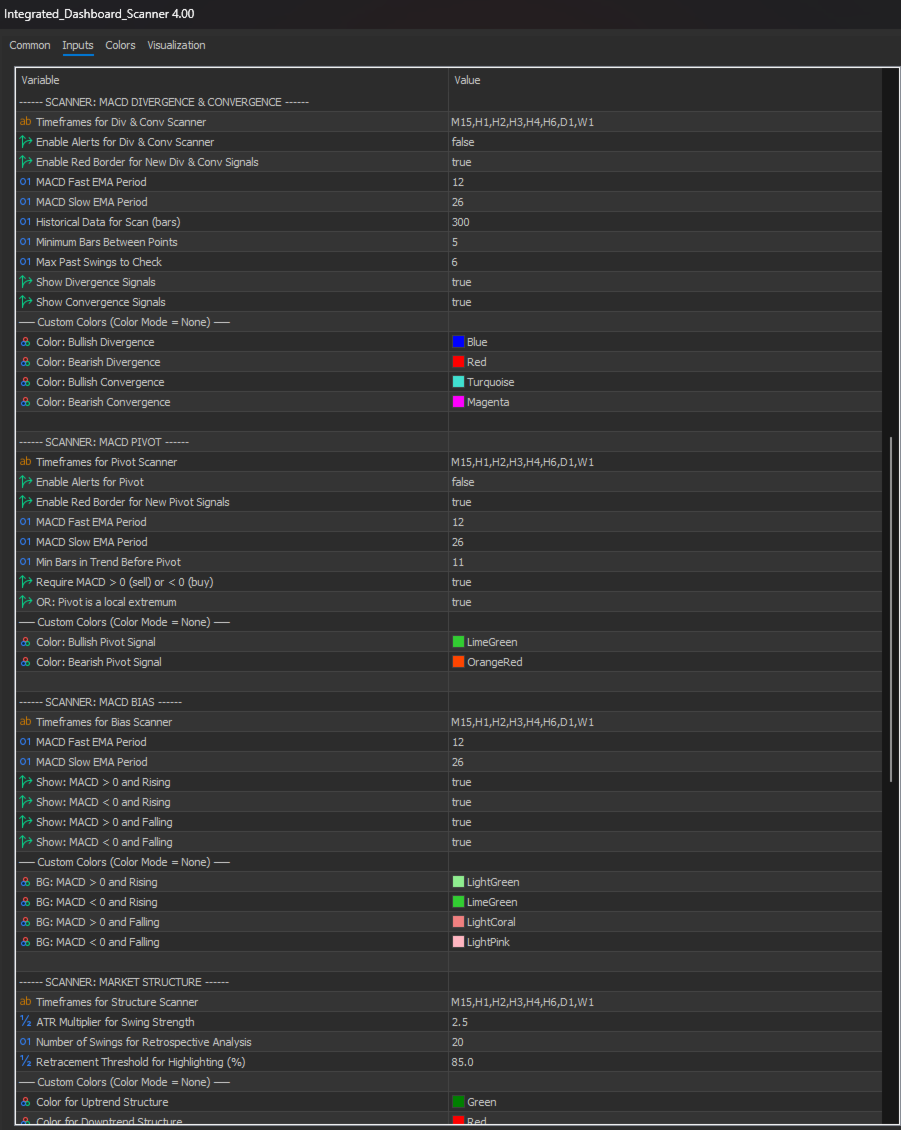
2. MACD Divergence & Convergence
Detects mismatches (divergence) or alignments (convergence) between price and MACD momentum.

  • Divergence: Price makes a new high but MACD doesn't (reversal signal).
  • Convergence: Price and MACD move in sync (trend strength confirmation).
  • Customizable: Independent control for Divergence/Convergence and lookback windows.

3. MACD Pivot
Identifies potential trend exhaustion when MACD momentum suddenly reverses.

  • Trend Requirement: Filters out minor wobbles by requiring a minimum trend duration before a pivot.
  • Strict Validation: Options to require MACD to be above/below zero or at a local extremum.
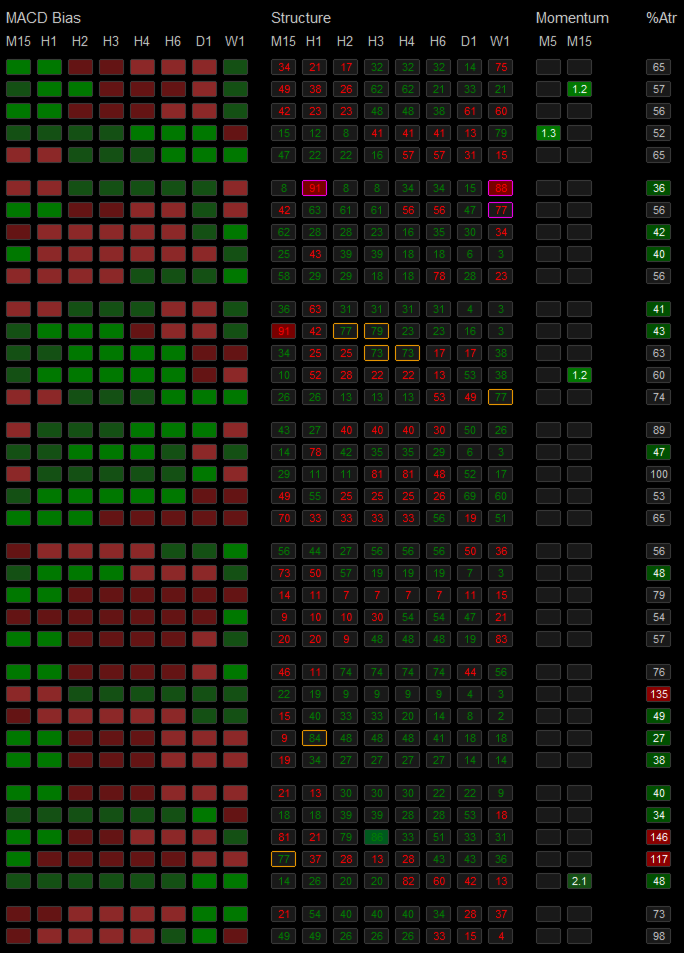
4. MACD Bias
Shows the current momentum state instantly.

  • Four States: Rising/Falling above or below Zero.
  • Color Coding: Background color instantly shows the bias state.

Supplementary Filter Modules

5. Market Structure (Enhanced in v4.00)
Advanced analytical tool tracking trend direction and retracement depth.

  • Trend Direction: Shows Uptrend/Downtrend status.
  • Retracement Depth: Highlights deep pullbacks (e.g., >50% or >75%) to identify "Discount" zones for better entries.
  • Crucial for Presets: Use this module to filter other signals (e.g., "Only show Bullish Divergence if Structure is Uptrend").
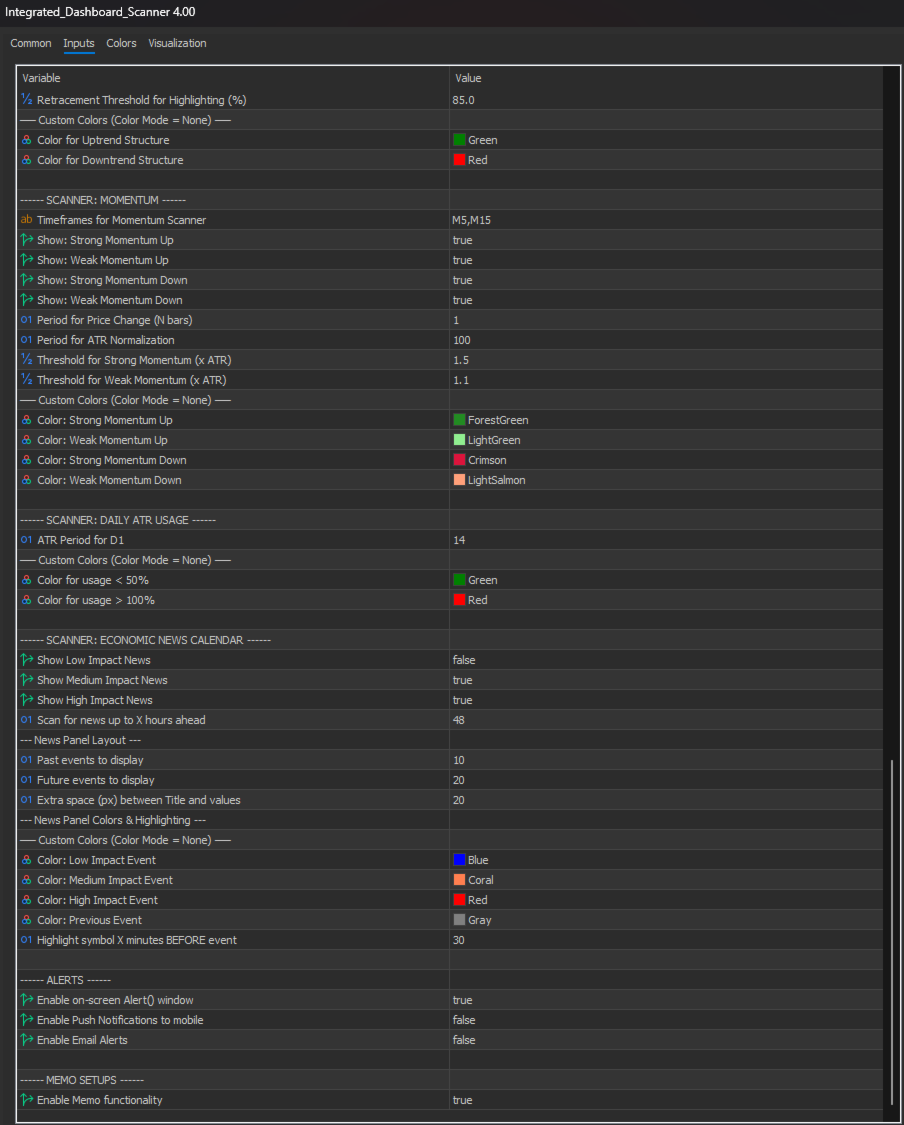
6. Momentum Scanner
Identifies instruments with unusually strong price movements relative to ATR.

7. Daily ATR Usage
Shows how much of the daily range has been consumed. Helps avoid trading exhausted pairs (>100% usage) or find expansion opportunities (<50%).

8. Economic News Calendar
Real-time event scanning. Automatically highlights symbols in the grid when they are about to be affected by high-impact news.

How to Use – Quick Setup

  1. Add Symbols: Enter symbols into the input lists.
  2. Configure Timeframes: Set independent timeframes for each module.
  3. Set Up Target Charts: Link up to 4 charts by ID for instant switching.
  4. Create Presets (v4.00): Use the editor to define your strategy logic (e.g., "Pivot + Structure").
  5. Enable Alerts: Configure visual, push, or email notifications.

Performance & Important Notes

The scanner is optimized for performance but loading history for hundreds of symbols may take time initially depending on your broker's data speed. Once synchronized, it operates in real-time.
Note: This tool provides analysis and alerts; it does not execute trades automatically. It also does not draw analytical objects on target charts (dedicated indicators available separately).

Take command of the market with the Integrated Dashboard Scanner v4.00.

Avis 1
Pawel Lukasz Czyzyk
264
Pawel Lukasz Czyzyk 2025.12.31 14:30 
 

A very good scanner with many features. An ideal tool for anyone trading the MACD price action.

Produits recommandés
Mine Farm
Maryna Kauzova
Mine Farm is one of the most classic and time-tested scalping strategies based on the breakdown of strong price levels. Mine Farm is the author's modification of the system for determining entry and exit points into the market... Mine Farm - is the combination of great potential with reliability and safety. Why Mine Farm?! - each order has a short dynamic Stop Loss - the advisor does not use any risky methods (averaging, martingale, grid, locking, etc.) - the advisor tries to get the most
L'indicateur SMC Venom Model BPR est un outil professionnel pour les traders travaillant dans le concept Smart Money (SMC). Il identifie automatiquement deux modèles clés sur le graphique des prix: FVG   (Fair Value Gap) est une combinaison de trois bougies, dans laquelle il y a un écart entre la première et la troisième bougie. Forme une zone entre les niveaux où il n'y a pas de support de volume, ce qui conduit souvent à une correction des prix. BPR   (Balanced Price Range) est une combinaiso
L'indicateur DYJ BoS identifie et marque automatiquement les éléments essentiels des changements de structure du marché, notamment : Rupture de structure (BoS) : détectée lorsque le prix effectue un mouvement significatif, franchissant un point de structure précédent. Il marque les lignes de tendance haussière et baissière possibles (UP & DN, c'est-à-dire de nouveaux sommets et de nouveaux creux continus), et une fois que le prix franchit ces lignes, il marque des flèches rouges (BEAR) et ver
Unlock key market insights with automated support and resistance lines Tired of plotting support and resistance lines? This is a multi-timeframe indicator that detects and plots supports and resistance lines in the chart with the same precision as a human eye would. As price levels are tested over time and its importance increases, the lines become thicker and darker, making price leves easy to glance and evaluate. [ Installation Guide | Update Guide | Troubleshooting | FAQ | All Products  ] Boo
Stratos Pali mt5
Michela Russo
4.5 (8)
Stratos Pali Indicator is a revolutionary tool designed to enhance your trading strategy by accurately identifying market trends. This sophisticated indicator uses a unique algorithm to generate a complete histogram, which records when the trend is Long or Short. When a trend reversal occurs, an arrow appears, indicating the new direction of the trend. Important Information Revealed Leave a review and contact me via mql5 message to receive My Top 5 set files for Stratos Pali at no cost ! Down
Cumulative Volume Delta MA-X MTF (avec Momentum de Gradient) Cet indicateur effectue une analyse multi-temporelle du Delta de Volume Cumulé (CVD) pour MetaTrader 5. Il calcule la différence nette entre la pression acheteuse et vendeuse en analysant les données de volume réel ou de ticks, offrant ainsi une représentation visuelle du sentiment du flux d'ordres. Logique et Fonctionnalités de l'Indicateur L'indicateur utilise une approche mathématique pour l'analyse du volume : Sources de Données :
Noize Absorption Index - is the manual trading system that measures the difference of pressure between bears forces and bulls forces. Green line - is a noize free index that showing curent situation. Zero value of index shows totally choppy/flat market.Values above zero level shows how powerfull bullish wave is and values below zero measures bearish forces.Up arrow appears on bearish market when it's ready to reverse, dn arrow appears on weak bullish market, as a result of reverse expectation.
MySNR - Precision Support & Resistance Line Indicator Discounted   Price   $50  !!     Secure your lifetime access   now   before it switches to   subscription-only ! Tired of drawing levels manually or guessing where the price will react inside a thick, messy zone? Now you can save time and trade with absolute confidence using the MySNR Indicator . Unlike traditional tools that plot broad and ambiguous zones, MySNR is engineered to automatically plot exact, pinpoint Support and Resistance lines
"Impulses and Corrections 5" is created to help traders navigate the market situation. The indicator shows multi-time frame upward and downward "Impulses" of price movements. These impulses are the basis for determining the "Base" , which is composed of zones of corrections of price movements, as well as "Potential" zones for possible scenarios of price movement. Up and down impulses are determined based on a modified formula of Bill Williams' "Fractals" indicator. The last impulse is always "U
Le niveau Premium est un indicateur unique avec une précision de plus de 80 % des prédictions correctes ! Cet indicateur a été testé par les meilleurs Trading Specialists depuis plus de deux mois ! L'indicateur de l'auteur que vous ne trouverez nulle part ailleurs ! À partir des captures d'écran, vous pouvez constater par vous-même la précision de cet outil ! 1 est idéal pour le trading d'options binaires avec un délai d'expiration de 1 bougie. 2 fonctionne sur toutes les paires de devises
Was: $249  Now: $99   Market Profile defines a number of day types that can help the trader to determine market behaviour. A key feature is the Value Area, representing the range of price action where 70% of trading took place. Understanding the Value Area can give traders valuable insight into market direction and establish the higher odds trade. It is an excellent addition to any system you may be using. Inspired by Jim Dalton’s book “Mind Over Markets”, this indicator is designed to suit the
SMC Smart Flow Pro
Thitipong Nookhunthod
Short Description: SMC Smart Flow Pro is an advanced Smart Money Concept indicator that automatically detects Break of Structure (BOS), Change of Character (CHoCH), and projects precise TP/SL target levels on all timeframes — built for serious traders who trade with institutional flow. Full Description: SMC Smart Flow Pro is a premium Smart Money Concept (SMC) indicator for MetaTrader 5, engineered for traders who want to trade alongside institutional order flow. By automatically mapping m
RBreaker
Zhong Long Wu
RBreaker Gold Indicators est une stratégie de trading intraday à court terme pour les contrats à terme sur l'or, qui combine deux approches : le suivi de tendance et le retournement intraday. Elle permet non seulement de capturer les profits dans les marchés en tendance, mais aussi de prendre des bénéfices en temps opportun lors des retournements de marché et d'ouvrir une position en sens inverse. Cette stratégie a été classée pendant 15 années consécutives parmi les dix stratégies de trading l
HAS RSI Signal — Indicateur de Tendance Professionnel avec Calcul SL/TP HAS RSI Signal est un outil de trading puissant combinant des classiques éprouvés et des algorithmes modernes de filtrage du bruit. L'indicateur analyse le marché à travers le prisme des bougies Heiken Ashi Smoothed (HAS) et de l'oscillateur RSI , offrant au trader des signaux d'entrée clairs lors des retournements de tendance ou des sorties de zones de surachat/survente. Principaux Avantages : Double Filtrage : L'utilisatio
# DRAWDOWN INDICATOR V4.0 - L'Outil Essentiel pour Maîtriser Votre Trading ## Transformez Votre Trading avec une Vision Complète de Vos Performances en Temps Réel Dans le monde exigeant du trading Forex et CFD, **connaître vos performances en temps réel** n'est pas un luxe, c'est une **nécessité absolue**. Le **Drawdown Indicator V4.0** est bien plus qu'un simple indicateur : c'est votre **tableau de bord professionnel** qui vous donne une vision claire, précise et instantanée de l'état de vo
Binary Rise Fall
Israr Hussain Shah
Here   our more valuable tools SMC Trend Trading   ,  Easy SMC Trading  ,  Institutional SMC Architect Volume Analysis Tools  ,  Volume flow Profile  ,  Market volume profile  , FVG with Volume  , Liquidity Heatmap Profile  ,  Volume Spread Analysis The Fractals_Price indicator is a technical analysis tool that identifies fractal patterns on price charts. Fractals are recurring patterns that signal potential trend reversals or continuation points. This indicator marks both upward and downward
Advanced Volume Profile Analysis Tool for MetaTrader 5 The Kecia Volume Profile Order Finder provides traders with volume profile analysis capabilities. This MT5 indicator combines volume profile visualization with statistical calculations to help identify potential trading opportunities and suggests entry, stop loss, and take profit levels based on market structure. Market Profile Visualization Transform your chart with customizable volume profile visualizations: Multiple visualization options
Your Trend Friend
Luigi Nunes Labigalini
5 (1)
The trend is your friend! Look at the color of the indicator and trade on that direction. It does not  repaint. After each candle is closed, that's the color of the trend. You can focus on shorter faster trends or major trends, just test what's most suitable for the symbol and timeframe you trade. Simply change the "Length" parameter and the indicator will automatically adapt. You can also change the color, thickness and style of the lines. Download and give it a try! There are big movements w
Notre indicateur   Basic Support and Resistance   est la solution dont vous avez besoin pour augmenter votre analyse technique.Cet indicateur vous permet de projeter les niveaux de support et de résistance sur le graphique /   Version MT4 Caractéristiques Intégration des niveaux de Fibonacci: avec la possibilité d'afficher les niveaux de Fibonacci aux côtés des niveaux de support et de résistance, notre indicateur vous donne un aperçu encore plus profond du comportement du marché et des zones
Rainbow EA MT5
Jamal El Alama
Description : Rainbow EA MT5 is a simple Expert advisor based on   Rainbow MT5 indicator witch is based on Moving average with period 34. The indicator is incorporated in the EA, therefore, it is not required for the EA to operate, but if you wish, you can download it from   my product page . The Expert Advisor settings are as follows : Suitable for Timeframes up to H1 The parameters below can be set according to your trading rules. StopLoss ( Stop Loss in pips) TakeProfit ( Take Profit in pips
QuickLineAlert
Aleksandr Poluchin
"QuickLineAlert" – Smart and Fast Price Level Indicator (MT5) "QuickLineAlert" is a tool designed for the MetaTrader 5 platform, created to maximize the speed and simplify the marking of price levels. It is perfectly suited for active traders (especially scalpers and day traders) who need to react instantly to market changes without long and tedious setups. You just press a button, place a line, and let the indicator do its job. Main Advantages: Fully Automated (No Need to Choose Direction) U
Max Min Delta Indicator - Market Volume Imbalance Analysis Gain Deeper Insights into Market Volume Imbalance with Delta Analysis What is the Max Min Delta Indicator? The Max Min Delta Indicator is a powerful market volume analysis tool that visually represents maximum and minimum delta values using a histogram. It helps traders identify market strength, weakness, absorption, and aggressive buying/selling activity with precision. Key Features Histogram Visualization: Displays Max Delta (Green) an
##   ONLY GOLD ##   Тiльки Золото ## **Mercaria Professional Trading Zones - Complete Guide** ## **Mercaria Professional Trading Zones - Повний посібник** ### **How Mercaria Zones Work / Як працюють зони Mercaria** **English:** Mercaria Zones is an advanced trading indicator that identifies high-probability support and resistance areas using ZigZag extremes combined with mathematical zone calculations. The indicator works on multiple timeframes simultaneously, providing a comprehensive view
Overview Harmonic Patterns MT5 is a technical analysis indicator designed for the MetaTrader 5 platform. It identifies and displays harmonic price patterns, such as Butterfly, Cypher, Crab, Bat, Shark, and Gartley, in both bullish and bearish directions. The indicator calculates key price levels, including entry, stop loss, and three take-profit levels, to assist traders in analyzing market movements. Visual elements and customizable alerts enhance usability on the chart. Features Detects six ha
Advanced Trading Chaos  The main purpose of the indicator is to help the trader detect the signals described by Bill Williams in his books to make a quick and correct trading decision. 1)Bullish/Bearish Reversal Bar(BDB) 2) Divergent Bar(DB) 3) Second Sage Signal — the third consecutive Awesome Oscillator bar  4) Working fractals (Fractals that worked above/below the red forehead  5) Three bar coloring modes 5.1) Coloring of bars according to the AO indicator (Including the squatting bar) 5.2
DAILY OH/OL SDEV QUANT MODEL - STATISTICAL TRADING WITH PRECISION RISK MANAGEMENT TRADE WITH MATHEMATICAL CERTAINTY - KNOW YOUR EXACT STOP-LOSS AND TAKE-PROFIT BEFORE YOU ENTER This indicator analyzes 5,000+ days of price history to give you: Exact entry levels (sigma bands locked at daily open) Exact stop-loss distance (from M
KT Renko Patterns MT5
KEENBASE SOFTWARE SOLUTIONS
KT Renko Patterns analyse le graphique Renko brique par brique afin de détecter des figures techniques bien connues, fréquemment utilisées par les traders sur divers marchés financiers. Par rapport aux graphiques basés sur le temps, les Renko offrent une vue épurée, rendant les figures plus faciles à reconnaître et à exploiter. KT Renko Patterns comprend plusieurs figures Renko, dont la majorité sont expliquées en détail dans le livre “Profitable Trading with Renko Charts” de Prashant Shah. Un
Cumulative delta indicator As most traders believe, the price moves under the pressure of market buying or selling. When someone redeems an offer standing in the cup, the deal is a "buy". If someone pours into the bid standing in the cup - the deal goes with the direction of "sale". The delta is the difference between purchases and sales. A cumulative delta - the difference between the cumulative sum of purchases and sales for a certain period of time. It allows you to see who is currently contr
SPECIAL LAUNCH OFFER: $30 (1-Month Rent) Limited time offer to build our community and gather feedback! AmbM GOLD Institutional Scalper A high-precision M5 algorithm for XAUUSD (Gold) , engineered to trade exclusively at Institutional Liquidity Levels ($5/$10 psychological marks). PERFORMANCE DATA (BUY ONLY) • Win Rate: 87.09%. • Safe Growth: +$4,113 profit on $10k (13.75% Max Drawdown). • Extreme Stress Test: Successfully generated +$22,997 in a 5-year stress test (2020-2026), proving
Market Shift Levels This indicator detects trend shifts and visualizes key market structure turning points using Hull Moving Average logic. It highlights potential areas of support and resistance where price is likely to react, empowering traders to spot early trend transitions. Market Shift Levels   are horizontal zones that mark the moment of a directional change in market behavior. These shifts are based on crossovers between two smoothed Hull Moving Averages (HMA), allowing the indicator
Les acheteurs de ce produit ont également acheté
Neuro Poseidon MT5
Daria Rezueva
4.98 (40)
Neuro Poseidon is a new indicator by Daria Rezueva. It combines precise trading signals with adaptive TP/SL levels - creating best possible trades as a result! Message me and get  Neuro Poseidon Assistant  as a gift to automize your trading process! What makes it stand out? 1. Proven profitability on all assets and timeframes 2. Only confirmed BUY and SELL signals present on the chart 3. Adaptive TP & SL levels generated by the software for each trade 4. Easy to understand - suitable for al
Divergence Bomber
Ihor Otkydach
4.9 (90)
Chaque acheteur de cet indicateur reçoit également gratuitement : L’outil exclusif « Bomber Utility », qui accompagne automatiquement chaque opération de trading, fixe les niveaux de Stop Loss et de Take Profit, et clôture les positions selon les règles de la stratégie Des fichiers de configuration (set files) pour adapter l’indicateur à différents actifs Des set files pour configurer le Bomber Utility selon différents modes : « Risque Minimum », « Risque Équilibré » et « Stratégie d’Attente » U
Quantum TrendPulse
Bogdan Ion Puscasu
5 (25)
Présentation de   Quantum TrendPulse   , l'outil de trading ultime qui combine la puissance de   SuperTrend   ,   RSI   et   Stochastic   dans un seul indicateur complet pour maximiser votre potentiel de trading. Conçu pour les traders qui recherchent précision et efficacité, cet indicateur vous aide à identifier les tendances du marché, les changements de dynamique et les points d'entrée et de sortie optimaux en toute confiance. Caractéristiques principales : Intégration SuperTrend :   suivez f
M1 Quantum MT5
Hamed Dehgani
5 (2)
Note du développeur : Il ne reste qu' une seule licence au prix de 129 $ . Après sa vente, le prix passera à 149 $ . M1 Quantum est un système de trading professionnel pour M1 qui fournit des signaux rapides et précis avec Stop Loss, Take Profit et une gestion intelligente du capital intégrés. M1 Quantum contient un système professionnel de gestion du capital conçu pour faire croître le compte rapidement en se concentrant sur les gains consécutifs . Fonctionnalités principales de l' indicateur
PrimeScalping
Temirlan Kdyrkhan
PrimeScalping is a powerful trading companion designed to generate high-probability entry signals with dynamic TP/SL/DP levels based on volatility. Built-in performance tracking shows win/loss stats, PP1/PP2 hits, and success rates — all updated live. Key Features: Buy/Sell signals with adaptive volatility bands Real-time TP/SL/DP levels based on ATR Built-in MA Filter with optional ATR/StdDev volatility Performance stats panel (Success, Profit/Loss, PP1/PP2) Alerts via popup, sound, push, or e
SignalTech is an unique fully rule based trading system delivers an Institutional approach for both Independent Traders and Prop Firm Challengers. Never Repaint. Push Notification available. No over-optimization. All the winning trades with chart setups are published on the comments page. 2026-05 4107 Pips (Until 05-29 NY Closed) 2026-04 2243 Pips 2026-03 2165 Pips 2026-02 2937 Pips 2026-01 2624 Pips 2025-12 1174 Pips It can generate signals with Buy/Sell Arrows, Push Notification (To Mobile) an
Ce produit a été mis à jour pour le marché 2026 et optimisé pour les dernières versions de MT5. AVIS DE MISE À JOUR DU PRIX : Smart Price Action Concepts est actuellement disponible à $200 . Le prix passera à $299 après les 30 prochains achats . OFFRE SPÉCIALE : Après l’achat, envoyez-moi un message privé pour recevoir un bonus gratuit + un cadeau . Tout d’abord, il est important de souligner que cet outil de trading est un indicateur sans repaint, sans redrawing et sans retard, ce qui le rend
Gem SIGNAL
Shengzu Zhong
5 (1)
GEM Signal Pro GEM Signal Pro est un indicateur de suivi de tendance pour MetaTrader 5, conçu pour les traders qui souhaitent des signaux plus clairs, des configurations de trade plus structurées et une gestion du risque plus pratique directement sur le graphique. Au lieu d’afficher simplement une flèche, GEM Signal Pro aide à présenter l’idée complète du trade de manière plus claire et plus lisible. Lorsque les conditions sont confirmées, l’indicateur peut afficher le prix d’entrée, le stop los
L'indicateur UZFX {SSS} Scalping Smart Signals MT5 est un indicateur de trading haute performance sans redessin, conçu pour les scalpers, les day traders et les swing traders qui recherchent des signaux précis et en temps réel sur des marchés très volatils. Développé par (UZFX-LABS), cet indicateur combine l'analyse de l'action des prix, la confirmation de tendance et un filtrage intelligent pour générer des signaux d'achat et de vente à forte probabilité sur toutes les paires de devises et tous
ARIPoint
Temirlan Kdyrkhan
1 (1)
ARIPoint is a powerful trading companion designed to generate high-probability entry signals with dynamic TP/SL/DP levels based on volatility. Built-in performance tracking shows win/loss stats, PP1/PP2 hits, and success rates all updated live. Key Features: Buy/Sell signals with adaptive volatility bands Real-time TP/SL/DP levels based on ATR Built-in MA Filter with optional ATR/StdDev volatility Performance stats panel (Success, Profit/Loss, PP1/PP2) Alerts via popup, sound, push, or email Cu
Azimuth Pro
Ottaviano De Cicco
5 (7)
Azimuth Pro V2: Synthetic Fractal Structure and Confirmed Entries for MT5 Overview Azimuth Pro is a multi-level swing structure indicator by Merkava Labs . Four nested swing layers, swing-anchored VWAP, ABC pattern detection, three-timeframe structural filtering, and closed-bar confirmed entries — one chart, one workflow from micro-swings to macro-cycles. This is not a blind signal product. It is a structure-first workflow for traders who care about location, context, and timing. V2 Launch Offe
KURAMA GOLD SIGNAL PRO (MT5) — Filtre à 7 couches · TP/SL automatique · Score de qualité · Sauvegarde de l'historique des signaux | Système de trading complet pour le XAUUSD Pas de repeint en temps réel. À l'instant où un signal apparaît, la flèche, l'entrée, le TP et le SL sont verrouillés sur place et ne bougent plus jamais ensuite. Ce que vous tradez, c'est ce signal en temps réel. Et dans la v7.20, chaque signal réellement envoyé est sauvegardé automatiquement et restauré à l'identique aprè
Quant Direction MT5
Georgios Kalomoiropoulos
Quant Direction est un outil d'analyse de marché 3D. Il fournit une analyse de marché parfaitement objective, basée sur un algorithme, en calculant des écarts précis en pourcentage sur différents paramètres. Développé à l'aide d'outils de modélisation avancés basés sur l'IA et soumis à des tests rigoureux, cet algorithme analyse le marché avec une précision inégalée. Vous pouvez analyser n'importe quelle paire de devises ou instrument financier sur la plateforme. Que vous pratiquiez le trading à
Meridian Pro
Ottaviano De Cicco
5 (2)
Meridian Pro 2.00: Professional Multi-Timeframe Trend Matrix for MT5 Meridian Pro 2.00 is a professional adaptive trend matrix for MetaTrader 5. It combines the original Meridian trend engine, a clean chart ribbon, closed-bar signal arrows, an 8-timeframe dashboard, Fuel momentum, weighted consensus, synthetic HTF processing and chart-native higher-timeframe context lines. The goal is simple: read current trend, multi-timeframe structure, strength, momentum and EA-ready state from one discipline
Grabber System MT5
Ihor Otkydach
4.83 (24)
Je vous présente un excellent indicateur technique : Grabber, qui fonctionne comme une stratégie de trading "tout-en-un", prête à l'emploi. En un seul code sont intégrés des outils puissants d'analyse technique du marché, des signaux de trading (flèches), des fonctions d'alerte et des notifications push. Chaque acheteur de cet indicateur reçoit également gratuitement : L'utilitaire Grabber : pour la gestion automatique des ordres ouverts Un guide vidéo étape par étape : pour apprendre à installe
Présentation       Quantum Breakout PRO   , l'indicateur révolutionnaire MQL5 qui transforme la façon dont vous négociez les zones d'évasion ! Développé par une équipe de traders expérimentés avec une expérience commerciale de plus de 13 ans,       Évasion quantique PRO       est conçu pour propulser votre parcours commercial vers de nouveaux sommets grâce à sa stratégie de zone de discussion innovante et dynamique. Quantum Breakout Indicator vous donnera des flèches de signalisation sur les z
SmartScalping
Temirlan Kdyrkhan
SmartScalping is a powerful trading companion designed to generate high-probability entry signals with dynamic TP/SL/DP levels based on volatility. Built-in performance tracking shows win/loss stats, PP1/PP2 hits, and success rates — all updated live. Key Features: Buy/Sell signals with adaptive volatility bands Real-time TP/SL/DP levels based on ATR Built-in MA Filter with optional ATR/StdDev volatility Performance stats panel (Success, Profit/Loss, PP1/PP2) Alerts via popup, sound, push, or e
ScalpPoint
Temirlan Kdyrkhan
ScalpPoint is a powerful trading companion designed to generate high-probability entry signals with dynamic TP/SL/DP levels based on volatility. Built-in performance tracking shows win/loss stats, PP1/PP2 hits, and success rates — all updated live. Key Features: Buy/Sell signals with adaptive volatility bands Real-time TP/SL/DP levels based on ATR Built-in MA Filter with optional ATR/StdDev volatility Performance stats panel (Success, Profit/Loss, PP1/PP2) Alerts via popup, sound, push, or emai
Gladiator Indicator: Conquer the Markets Step into the trading arena with the Gladiator Indicator, a robust and highly effective trading tool designed exclusively for MQL5. Built for traders who want clear, actionable insights, Gladiator cuts through market noise to deliver precise Buy and Sell signals right on your charts. Whether you are a beginner looking for guidance or an experienced trader seeking a reliable confirmation tool, Gladiator provides the edge you need to battle the markets wi
TrendProMaster
Temirlan Kdyrkhan
MasterTrend Indicator for MT5 A powerful trend-following and signal-evaluation tool MasterTrend   is a custom MT5 indicator that combines Moving Averages and ATR-based risk/reward logic to generate clear buy/sell signals. It visualizes dynamic SL/TP levels, evaluates past trade outcomes, and displays win/loss statistics in a clean on-chart panel. Key features include: Buy/Sell signals based on MA crossovers ATR-based SL/TP1/TP2/TP3 levels with visual lines and labels Signal outcome tracking wit
LTL Long Trend Locator
Muhammad Usman Siddique
LTL Long Trend Locator v2.0 - Indicateur professionnel de trading de tendance Le LTL Long Trend Locator aide les traders à trouver les meilleurs moments pour entrer et sortir du marché en identifiant les tendances fortes et durables. Il donne des signaux clairs lorsque les tendances commencent et se terminent, vous aidant ainsi à trader dans la bonne direction au bon moment. Il aide les traders à trouver les tendances fortes du marché et indique exactement où placer les trades avec des niveaux
Gartley Hunter Multi
Siarhei Vashchylka
5 (12)
Gartley Hunter Multi - An indicator for searching for harmonic patterns simultaneously on dozens of trading instruments and on all possible timeframes. Manual (Be sure to read before purchasing) | Version for MT4 Advantages 1. Patterns: Gartley, Butterfly, Shark, Crab. Bat, Alternate Bat, Deep Crab, Cypher 2. Simultaneous search for patterns on dozens of trading instruments and on all possible timeframes 3. Search for patterns of all possible sizes. From the smallest to the largest 4. All fou
MasterTrend
Temirlan Kdyrkhan
MasterTrend Indicator for MT5 A powerful trend-following and signal-evaluation tool MasterTrend   is a custom MT5 indicator that combines Moving Averages and ATR-based risk/reward logic to generate clear buy/sell signals. It visualizes dynamic SL/TP levels, evaluates past trade outcomes, and displays win/loss statistics in a clean on-chart panel. Key features include: Buy/Sell signals based on MA crossovers ATR-based SL/TP1/TP2/TP3 levels with visual lines and labels Signal outcome tracking wit
RelicusRoad Pro MT5
Relicus LLC
4.96 (24)
RelicusRoad Pro : Système d'Exploitation Quantitatif du Marché 70% DE RÉDUCTION ACCÈS À VIE (DURÉE LIMITÉE) - REJOIGNEZ 2 000+ TRADERS Pourquoi la plupart des traders échouent-ils même avec des indicateurs "parfaits" ? Parce qu'ils tradent des concepts isolés dans le vide. Un signal sans contexte est un pari. Pour gagner, il faut de la CONFLUENCE . RelicusRoad Pro est un Écosystème Quantitatif complet . Il cartographie la "Fair Value Road", distinguant le bruit des cassures structurelles. Arrête
Btmm state engine pro
Garry James Goodchild
5 (5)
BTMM State Engine Pro is a MetaTrader 5 indicator for traders who use the Beat The Market Maker approach: Asian session context, kill zone timing, level progression, peak formation detection, and a multi-pair scanner from a single chart. It combines cycle state logic with a built-in scanner dashboard so you do not need the same tool on many charts at once. What it does Draws the Asian session range; session times can follow broker server offset or be set in inputs. Tracks level progression (L
Presenting one-of-a-kind Gann Indicator for XAUUSD IQ Gold Gann Levels is a non-repainting, precision tool designed exclusively for XAUUSD intraday trading. It uses W.D. Gann’s square root method to plot real-time support and resistance levels, helping traders spot high-probability entries with confidence and clarity. William Delbert Gann (W.D. Gann) was an exceptional market analyst whose trading technique was based on a complex blend of mathematics, geometry, astrology, and ancient calculation
La meilleure solution pour tout débutant ou trader expert ! Cet indicateur est un outil de trading unique, de haute qualité et abordable car nous avons incorporé un certain nombre de caractéristiques exclusives et une nouvelle formule. Avec seulement UN graphique, vous pouvez lire la force de la devise pour 28 paires Forex ! Imaginez comment votre trading va s'améliorer parce que vous êtes capable de repérer le point de déclenchement exact d'une nouvelle tendance ou d'une opportunité de scalpi
La meilleure solution pour tout débutant ou Expert Trader ! Cet indicateur est un outil de trading unique, de haute qualité et abordable car nous avons incorporé un certain nombre de caractéristiques exclusives et une formule secrète. Avec seulement UN graphique, il donne des alertes pour les 28 paires de devises. Imaginez comment votre trading s'améliorera parce que vous serez capable de repérer le point de déclenchement exact d'une nouvelle tendance ou d'une opportunité de scalping ! Constr
Advanced Supply Demand MT5
Bernhard Schweigert
4.53 (15)
La meilleure solution pour tout commerçant débutant ou expert ! Cet indicateur est un outil de trading unique, de haute qualité et abordable car nous avons intégré un certain nombre de fonctionnalités propriétaires et une nouvelle formule. Avec cette mise à jour, vous pourrez afficher des zones à double horaire. Vous pourrez non seulement afficher un TF plus élevé, mais afficher les deux, le graphique TF, PLUS le TF supérieur : AFFICHAGE DES ZONES NICHÉES. Tous les traders Supply Demand vont ado
Meravith MT5
Ivan Stefanov
5 (1)
Outil des market makers. Meravith va : Analyser toutes les unités de temps et afficher la tendance actuellement en vigueur. Mettre en évidence les zones de liquidité (équilibre des volumes) où le volume haussier et baissier est égal. Afficher tous les niveaux de liquidité provenant de différentes unités de temps directement sur votre graphique. Générer et présenter une analyse de marché sous forme de texte pour votre référence. Calculer les objectifs, les niveaux de support et les points de stop
Plus de l'auteur
Supply Demand FVG Zones
Krzysztof Janusz Stankiewic
5 (1)
Supply or demand zones refer to price areas where a significant amount of supply or demand had previously entered the market, causing prices to either fall or rise. If the price returns to the demand or supply zone, it is likely to bounce off due to the large number of orders previously placed within the zone. These orders will be defended in these areas. The Fair Value Gap (FVG) is a concept used to identify imbalances in the equilibrium of buying and selling. Fair Value Gaps are formed in a t
The First Red MT5
Krzysztof Janusz Stankiewic
L'indicateur "The First Red", basé sur la stratégie créée par Dariusz Dargo, est conçu pour identifier et marquer les chandeliers sur le graphique qui répondent aux conditions de la stratégie "The First Red" et de ses extensions, telles que "Second Red", "First Green" et "Second Green". La stratégie se concentre sur l'analyse des extrêmes locaux et les signaux de l'oscillateur MACD. Premier chandelier rouge (First Red Candle):   Un chandelier est marqué comme "First Red" lorsqu'il établit un max
Supply Demand Ranger
Krzysztof Janusz Stankiewic
5 (4)
The indicator draws supply and demand zones. The zone timeframe can be set independently of the chart timeframe. For instance, it is possible to set M5 zones on an H4 chart. The importance of zones can be adjusted using the zone strength parameter. Demand zones are displayed if at least one candle in the range of the zone is entirely above the zone. Similarly, supply zones are displayed if at least one candle within the zone is entirely below the zone.
MACD Divergence and TFR for MT5
Krzysztof Janusz Stankiewic
5 (2)
L'indicateur identifie les divergences en analysant les pentes des lignes reliant les sommets ou creux du prix et de l'histogramme MACD. Divergence Haussière (Convergence) :   Elle se produit lorsque les lignes reliant les creux du MACD et les creux correspondants sur le graphique des prix ont des pentes opposées et convergent. Divergence Baissière :   Elle se produit lorsque les lignes reliant les sommets du MACD et les sommets correspondants sur le graphique des prix ont des pentes opposées et
MT5 Macd Divergence Scanner
Krzysztof Janusz Stankiewic
This indicator helps you monitor multiple currency pairs and timeframes all at once. It displays the occurrence of divergences between price and the MACD indicator in a clear and easy-to-read table. Monitoring multiple timeframes and currency pairs in one place helps traders identify a divergence without needing to switch between charts. Divergences can be bullish or bearish. For example, if the price forms a higher high while the MACD forms a lower high, this indicates bearish divergence. On th
Purpose of the Inside Bar and Outside Bar Breakout Scanner Indicator: The Inside Bar & Outside Bar Breakout Scanner  is an advanced dashboard designed to scan multiple instruments and timeframes simultaneously. Its primary function is to identify two powerful candlestick patterns—the  Inside Bar (IB)  and the  Outside Bar (OB) —and then to detect and classify breakouts from these formations. The indicator presents its findings in a clean, organized table, signaling potential trend continuation o
Symbol
Krzysztof Janusz Stankiewic
For those who monitor charts from afar, this utility is essential. It displays the chart symbol, time frame, and bid price as text. Users can adjust the text position, color, and font size. It’s also a useful tool for forex video publishers. There will be no more complaints about which symbol and time frame are displayed on the screen, even if the content is viewed on a phone. Symbol prefixes such as “_ecn” or “_stp” can be removed from the displayed symbol.
FREE
Supply Demand FVG
Krzysztof Janusz Stankiewic
3 (2)
The indicator offers a comprehensive suite of features for identifying key market areas, including: Supply Zones Demand Zones Fair Value Gaps (FVG) and provides alerts whenever price reaches a supply or demand zone. Key Features: Historical Zones: In addition to active zones, the indicator now includes historical supply, demand, and FVG zones, allowing for a deeper analysis of past price behavior. Flexible Zone Timeframes: Zones can be plotted independently of the chart's timeframe, enabling sce
MACD Divergence and TFR for MT4
Krzysztof Janusz Stankiewic
5 (1)
The indicator identifies divergence by analyzing the slopes of lines connecting price and MACD histogram peaks or troughs. Bullish Divergence (Convergence): Occurs when the lines connecting MACD troughs and corresponding price troughs have opposite slopes and are converging. Bearish Divergence: Occurs when the lines connecting MACD peaks and corresponding price peaks have opposite slopes and are diverging. When a divergence signal is detected, the indicator marks the chart with dots at the pric
MT4 Macd Divergence Scanner
Krzysztof Janusz Stankiewic
Cet indicateur offre un moyen efficace de surveiller simultanément plusieurs paires de devises et différents horizons temporels. En affichant visuellement les divergences entre le prix et le MACD dans un tableau clair et facile à lire, il permet aux traders d’identifier d’éventuels points de retournement du marché sans avoir à changer constamment de graphique. Les divergences peuvent signaler un passage d’une dynamique haussière à une dynamique baissière, ou inversement. Par exemple, une diverge
The First Red MT4
Krzysztof Janusz Stankiewic
L'indicateur "The First Red", basé sur la stratégie créée par Dariusz Dargo, est conçu pour identifier et marquer les chandeliers sur le graphique qui répondent aux conditions de la stratégie "The First Red" et de ses extensions, telles que "Second Red", "First Green" et "Second Green". La stratégie se concentre sur l'analyse des extrêmes locaux et les signaux de l'oscillateur MACD. Premier chandelier rouge (First Red Candle):   Un chandelier est marqué comme "First Red" lorsqu'il établit un max
Filtrer:
Pawel Lukasz Czyzyk
264
Pawel Lukasz Czyzyk 2025.12.31 14:30 
 

A very good scanner with many features. An ideal tool for anyone trading the MACD price action.

Répondre à l'avis