Deviation Trend Profile MT5 Scanner
- Indicators
-
Duc Hoan Nguyen
 ->| I am a dedicated developer and programmer specializing in MQL4, MQL5, and Pine Script for TradingView, with a strong track record of success in building high-performing, tailored solutions for MT4, MT5, and TradingView platforms. Over the years, I have worked extensively within the financial and
 - Version: 1.10
- Updated: 26 July 2025
- Activations: 10
New tools will be $30 for the first week or the first 3 purchases!
Trading Tools Channel on MQL5: Join my MQL5 channel to update the latest news from me
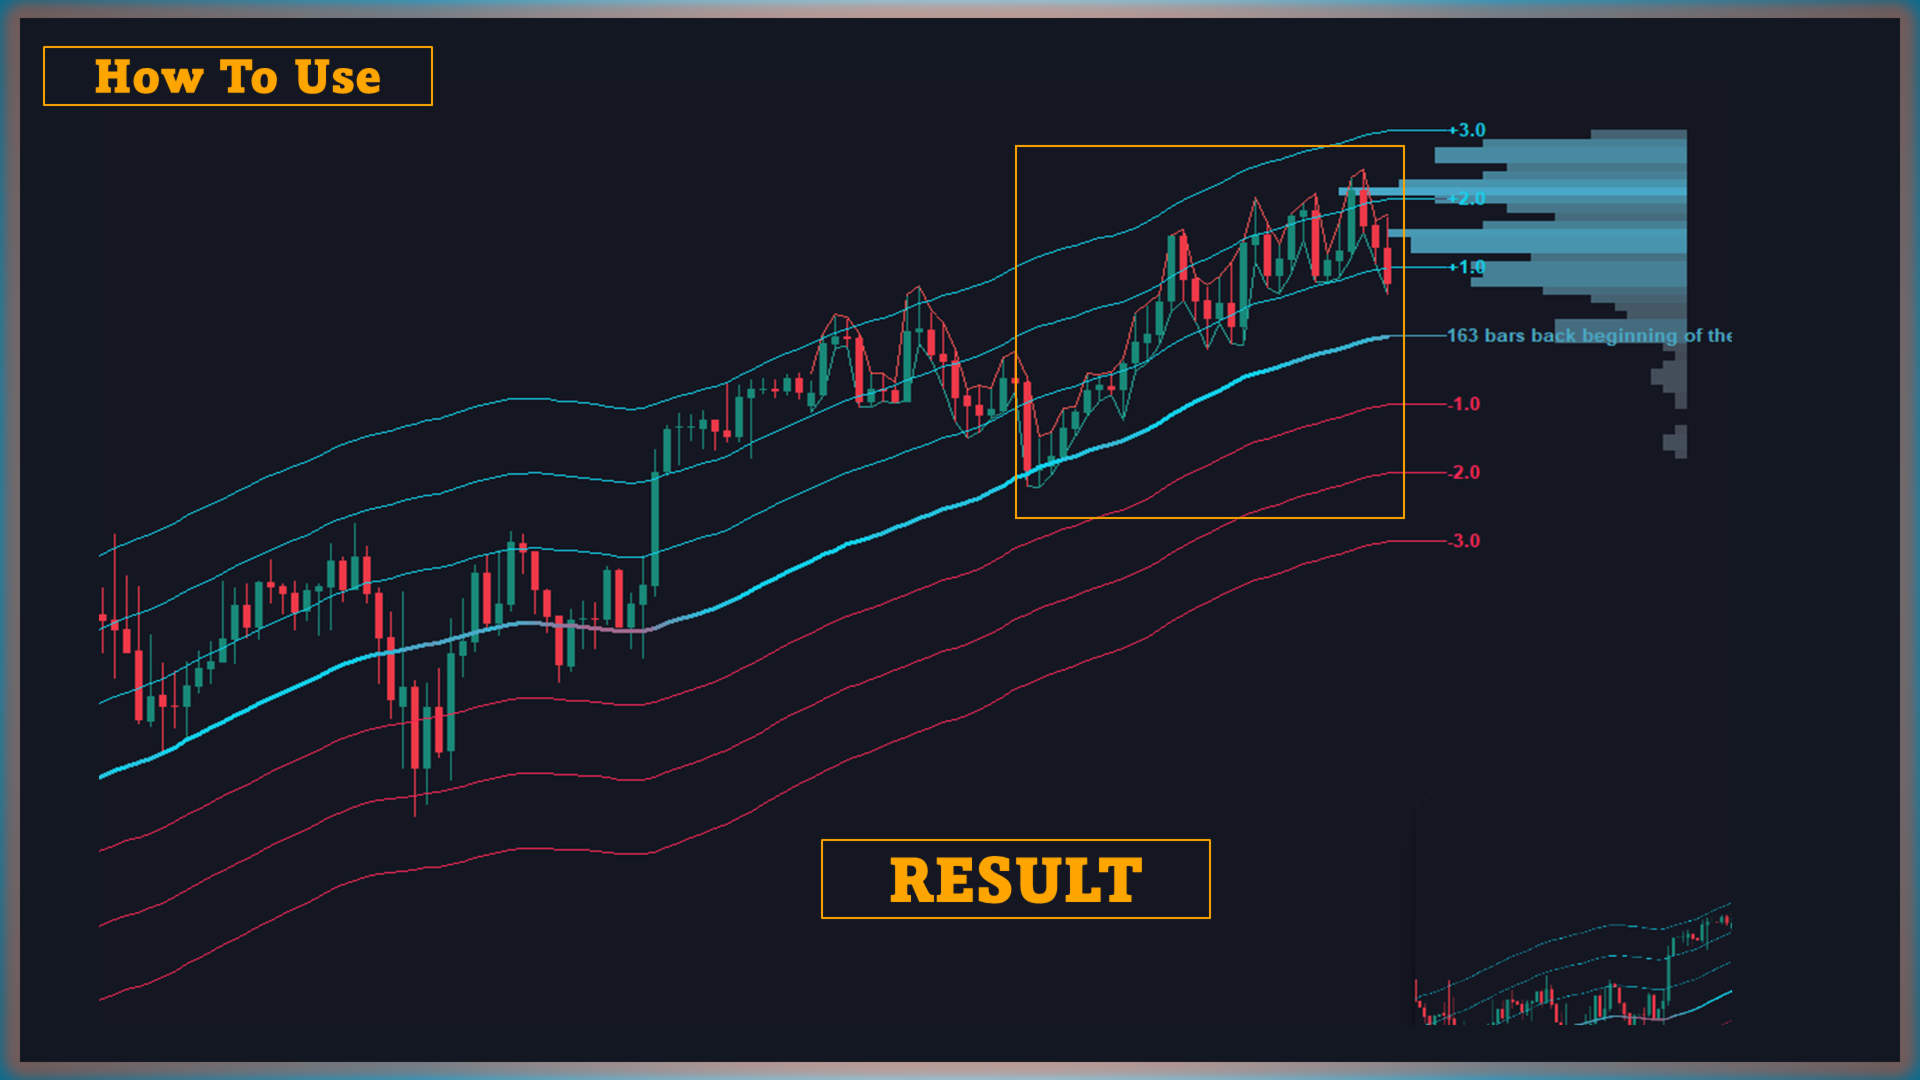
Deviation Trend Profile Scanner (DTPS) - An indicator that detects trend direction, gauges volatility, and organises information from several symbols / timeframes in one table. It applies a configurable moving average, adaptive standard‑deviation zones, and a distribution histogram to present a concise, statistics‑based view of price behaviour.
See more MT4 version at: Deviation Trend Profile MT4 Scanner
See more products at: All Products
The indicator combines three components:
-
Moving average (MA)
-
Standard‑deviation zones (±1, ±2, ±3 × ATR)
-
Trend Distribution Profile (histogram)
2. Core concepts
- MA slope (|Slope| > 0.1): Detects trend changes — positive = Bullish, negative = Bearish
- Standard‑Deviation bands (±1 / ±2 / ±3) × ATR: Measured from the MA, forming a volatility “funnel”
- MA: The trend baseline; choose from SMA, EMA, SMMA, LWMA, RMA, HMA, WMA, or VWMA. All MA parameters are user‑configurable.
- Distribution histogram: Counts how often the close falls into each deviation zone during the trend.
- Scanner: Scans trends across symbols and timeframes, displaying results in a table (enable/disable in the Input tab).
3. Key parameters
-
MA method — choose SMA, EMA, SMMA, LWMA, RMA, HMA, WMA, or VWMA.
-
Deviation multipliers — set individual values for the ±1, ±2, ±3 bands.
-
Visibility options — enable or disable lines, histograms, and scanner from the Inputs tab.
-
Trend markers — up / down dots highlight the most recent change in MA slope (confirmed on bar close).
Note: Monitoring too many symbols or timeframes at once may slow terminal start‑up.
4. Typical workflow-
Observe trend markers to see current direction or a recent reversal.
-
Cross‑check timeframes with the scanner to confirm consistency.
-
Review distribution:
-
Wider clustering in the outer bands (±2 / ±3) indicates sustained momentum.
-
Clustering near the MA suggests reduced directional strength.
-
-
Plan trade management according to personal rules and risk limits.


Perfect