Deviation Trend Profile MT5 Scanner

5
Offerta speciale: ALL TOOLS, solo $35 ciascuno!

Nuovi strumenti saranno a $30 per la prima settimana o per i primi 3 acquisti

Canale Trading Tools su MQL5: unisciti per ricevere le mie ultime novità

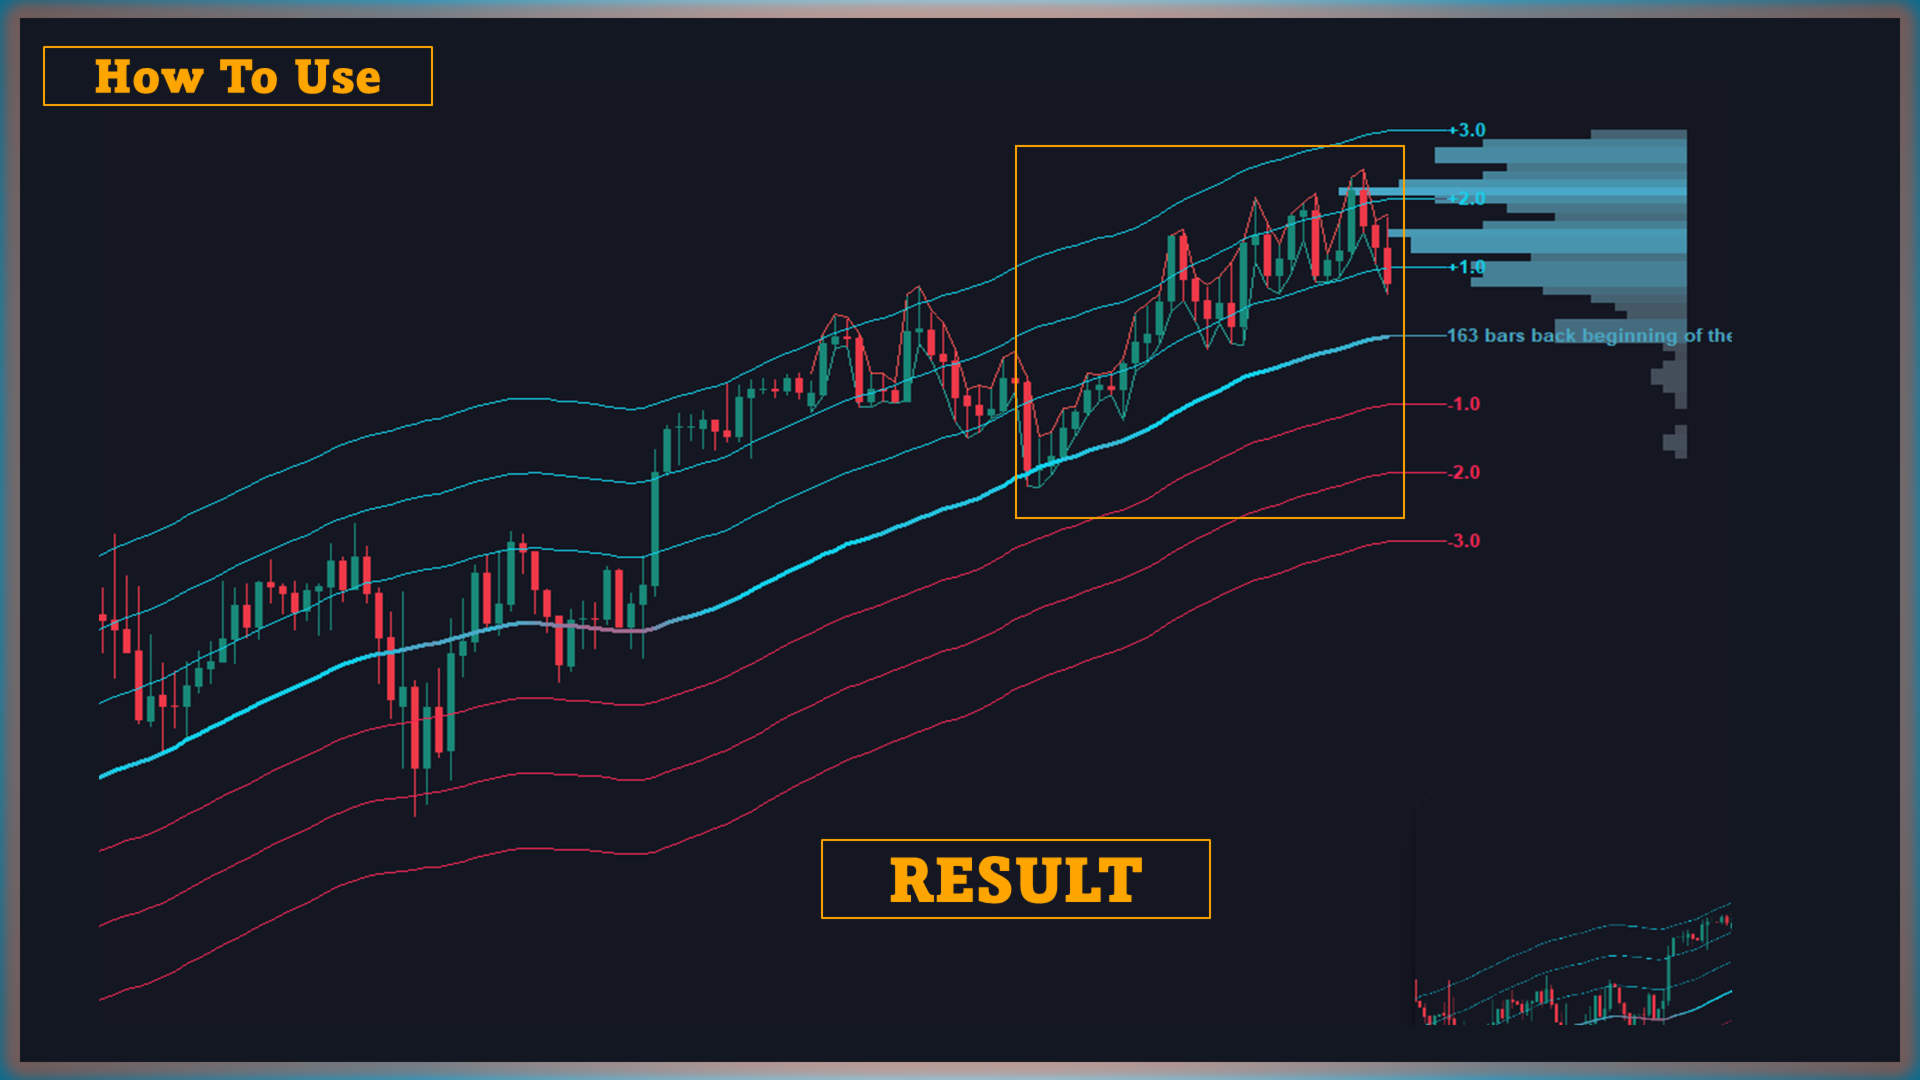
Deviation Trend Profile Scanner (DTPS) è un indicatore che individua la direzione del trend, misura la volatilità e organizza le informazioni di più simboli/timeframe in un’unica tabella. Utilizza una media mobile configurabile, zone di deviazione standard adattive e un istogramma di distribuzione per offrire una vista statistica concisa del comportamento del prezzo.

Guarda la versione MT4: Deviation Trend Profile MT4 Scanner

Altri prodotti: All Products

1. Panoramica

L’indicatore combina tre componenti:

  • Media mobile (MA)

  • Zone di deviazione standard (±1, ±2, ±3 × ATR)

  • Profilo di distribuzione del trend (istogramma)

2. Concetti fondamentali

  • Pendenza della MA (|Slope| > 0.1): individua i cambi di trend — positivo = rialzista, negativo = ribassista
  • Bande di deviazione standard (±1/±2/±3) × ATR: misurate dalla MA, formano un “imbuto” di volatilità
  • MA:linea di base del trend; scegli tra SMA, EMA, SMMA, LWMA, RMA, HMA, WMA o VWMA. Tutti i parametri sono personalizzabili.
  • Istogramma di distribuzione: conteggia quante volte la chiusura rientra in ogni zona.
  • Scanner: scansiona simboli/timeframe e mostra i risultati in tabella (attiva/disattiva in Input).

3. Parametri chiave

  • Metodo MA — SMA, EMA, SMMA, LWMA, RMA, HMA, WMA, VWMA.

  • Moltiplicatori di deviazione — valori separati per bande ±1, ±2, ±3.

  • Opzioni di visibilità — attiva/disattiva linee, istogramma, scanner da Inputs.

  • Marcatori di trend — punti su/giù indicano l’ultima variazione (confermata alla chiusura).

Nota: monitorare troppi simboli/timeframe può rallentare l’avvio del terminale.

4. Flusso di lavoro tipico
  1. Osserva i marcatori per la direzione attuale o inversione recente.

  2. Verifica coerenza tra timeframe con lo scanner.

  3. Esamina la distribuzione:

    • Maggiore concentrazione nelle bande esterne (±2/±3) indica momentum sostenuto.

    • Concentrazione vicino alla MA suggerisce minore forza direzionale.

  4. Pianifica la gestione del trade secondo le tue regole e limiti di rischio.


Recensioni 1
benny12
311
benny12 2026.01.21 15:03 
 

Perfect

Prodotti consigliati
BTFX Pivot Points
Bradley Thomas Farrington
The BTFX Pivot Points is an indicator which calculates the Support and Resistance levels for each day. By using this indicator the pivot levels point out clear targets to aim for. The resistance levels are shown in purple above the silver pivot line. The support levels are shown in Orange and can be found below the silver pivot line. This indicators works very well when used with The BTFX Daybreak Indicator. For a more in depth explanation of these indicators please watch the Youtube video attac
The indicator to trade price consolidation is designed to identify price contraction and alerts us on formation. It does this by analyzing historical price data and identifying price action patterns. The algorithm then uses this information to mark the zone , potential targets and liquidity lines, giving us valuable insights into market behavior.  Traders can adjust parameters such as colors ,alerts types and how many  previously formed zones to display on chart . Furthermore, the indicator can
Murphy Order Block is a highly optimized and visually clean indicator for identifying key institutional zones based on pure market structure logic. It is designed for traders who follow Smart Money Concepts (SMC), ICT-style OB trading, and structure-based break & retest strategies. This indicator dynamically detects and draws: - **1 valid Bullish Order Block (Buy Zone)** - **1 valid Bearish Order Block (Sell Zone)** ### Key Features: **Market Structure-Based Logic**   - Uses swing high
Smart Trendlines MT5
Suvashish Halder
5 (3)
Smart Trendlines – No.1 Trendlines Indicator Smart Trendlines is a precision tool that automatically draws trendlines based on every valid pivot point, helping traders identify key support and resistance zones. It continuously adjusts as new market pivots form, providing a live and accurate reflection of price structure. Whether you’re tracking trends, preparing for reversals, or anticipating breakouts — this indicator keeps you one step ahead. It works seamlessly across all assets including For
"Hunttern harmonic pattern finder" base on the dynamic zigzag with the notification and prediction mode This version of the indicator identifies 11 harmonic patterns and predicts them in real-time before they are completely formed. It offers the ability to calculate the error rate of Zigzag patterns depending on a risk threshold. It moreover sends out a notification once the pattern is complete. The supported patterns: ABCD BAT ALT BAT BUTTERFLY GARTLEY CRAB DEEP CRAB CYPHER SHARK THREE DRIV
Structure Levels (Highs & Lows) Indicator for MetaTrader 5 Decode Market DNA — Trade with Institutional Precision Description: The Structure Levels (Highs & Lows) Indicator is your secret weapon to map the market’s hidden roadmap. Designed for traders who think in terms of price action and market structure, this tool automatically identifies critical swing highs and swing lows, transforming chaotic charts into a clear blueprint of support/resistance zones, breakout opportunities, and trend rev
MarketMagnet
Kelly Adediran Raymond
Are you ready to take your trading journey to new heights? Look no further than MarketMagnet, this groundbreaking indicator designed to propel your trading success with excitement and accuracy. Powered by the convergence of Momentum and CCI (Commodity Channel Index), MarketMagnet equips traders with the ultimate tool to determine direction and entry prices for a wide range of recommended currency pairs and instruments. It is designed for traders seeking to scalp for a few pips on lower timeframe
Market session with fibonacci
Batsukh Sumchin Khuyagbaatar
Questo indicatore è l'indicatore più comune che utilizziamo ogni giorno, comprese le nostre strategie più utilizzate, ICT e SMC, limiti di stop loss e limiti di liquidità che si verificano negli orari di apertura e chiusura degli scambi, nonché il volume degli scambi con Fibonacci e lo zoom avanti e indietro, e le azioni più comuni che vuoi vedere, come la selezione del movimento di scambio che vuoi vedere e l'estrazione di Fibonacci, sono indicatori completamente automatici che ti consentono di
Fibonacci Auto Levels Pro MT5 – Ritracciamenti, Estensioni e Punti Pivot (Pivot Points) Fibonacci Auto Levels Pro MT5 è uno strumento avanzato di analisi tecnica che rileva automaticamente i punti di swing del mercato e disegna strutture complete di Ritracciamento (Retracement), Estensione (Extension) e Punti Pivot (Pivot Point) di Fibonacci sul grafico. Questo indicatore combina diversi sistemi indipendenti in un unico strumento analitico unificato: Punti Pivot (Modalità Fibonacci) I Punti Pivo
Heiken Ashi Supertrend Combine
Tri Yasin Satrio Adji Pranoto
Headline: Stop Guessing, Start Winning. Unleash the Power of the Heiken Ashi Supertrend Indicator. Body: Are you tired of market noise, confusing charts, and missed opportunities? The Heiken Ashi Supertrend Indicator is the ultimate tool designed to bring clarity and confidence to your trading, once and for all. We've combined two of the most powerful concepts in technical analysis into one seamless, easy-to-use indicator: Crystal-Clear Trends with Heiken Ashi: Say goodbye to choppy price action
Kst pro tools
Vincent Albert Feugier
KST Pro Tools – Smart Momentum Indicator Overview KST Pro Tools is an advanced momentum indicator based on Martin Pring’s classic Know Sure Thing (KST) . It has been redesigned to deliver a clean, instant, and unambiguous momentum reading , thanks to a smart and fully filtered histogram logic. This indicator shows only meaningful momentum , exactly when it matters. Indicator Components KST Line (blue) Measures the true strength of market momentum Built using 4 weighted and smoothed Rate
The indicator plots flexible support and resistance levels (dots). A special phase of movement is used for construction. Levels are formed dynamically, that is, each new candle can continue the level or complete it. The level can provide resistance or support to the price even where it is no longer there. Also, support and resistance levels can change roles. The importance of levels is affected by: the amount of time the level is formed and the number of touches. The significance of these lev
FibPiv Zones PRO FibPiv Zones PRO is a professional trading indicator that combines Fibonacci retracement levels with Pivot Point zones , giving traders a powerful framework for identifying support, resistance, and high-probability trading opportunities . Unlike traditional indicators, FibPiv Zones PRO dynamically adapts to market conditions and provides clear, reliable zones that help traders make better entry and exit decisions. Key Features Fibonacci + Pivot Zones Automatically plots Fibonac
High of the Day and Low of the day Time and Price Fractal Studies is an indicator that will help you identify certain patterns that tend to repeat themseleves at certail times of the day or at certain prices.  It is used to study Daily Highs ad Lows in relation to time and price.  You will get to answer certail questions like: At what time of day does this market usually turn around. At what price does the market turn. Is it at round numbers etc
FREE
Looking for a powerful yet lightweight swing detector that precisely identifies key market structure turning points? Want clear, reliable buy and sell signals that work across all timeframes and all instruments? Buy Sell Arrow Swing   MT5  is designed exactly for that—delivering accurate and efficient swing detection without complexity. This indicator clearly identifies Higher Highs (HH), Higher Lows (HL), Lower Highs (LH), and Lower Lows (LL) , allowing traders to visualize market structure, tr
Introduction to Support Resistance Indicator Support and Resistance are the important price levels to watch out during intraday market. These price levels are often tested before development of new trend or often stop the existing trend causing trend reversal at this point. Highly precise support and resistance are indispensable for experienced traders. Many typical trading strategies like breakout or trend reversal can be played well around these support and resistance levels. The Precision Sup
The new update makes this indicator a complete tool for studying, analyzing and operating probabilistic patterns. It includes: On-chart Multi-asset percentage monitor. Configurable martingales. Twenty-one pre-configured patterns, including Mhi patterns and C3. An advanced pattern editor to store up to 5 custom patterns. Backtest mode to test results with loss reports. Trend filter. Hit operational filter. Martingale Cycles option. Various types of strategies and alerts. Confluence between patter
Pivot Points Classic – L’indicatore essenziale per ogni trader tecnico Questo indicatore disegna automaticamente i livelli di Pivot Point più utilizzati dai trader professionisti, con supporto completo a 4 metodi di calcolo:   Metodi supportati : • Traditional • Fibonacci • Woodie • Camarilla   Caratteristiche principali :  Calcolo su timeframe superiore (multi-timeframe)  Visualizzazione chiara dei livelli P, R1, R2, R3, S1, S2, S3   Etichette dinamiche con nome e valore del livello  Colori per
FREE
Turn your chart into a professional trading dashboard that shows where price is flowing and when the next shock is coming —without loading a single extra window. This indicator combines a price-following MA ribbon with a live news radar directly on the chart, giving you both trend and event risk in one glance. Trend Ribbon – Read the market bias instantly A smooth, step-style moving average ribbon follows price action bar by bar. Color change shows the active trend: aqua for bullish flow , gold
This is the Full Version, to get the free version please contact me. The free version works on “GBPCHF” charts. All symbols and time frames scanner. Harmonic Pattern Harmonic patterns are used in technical analysis that traders use to find trend reversals. They are considered one of the most accurate technical analysis tools, as they allow traders to predict the future price movement direction and the potential trend targets. Also, unlike many other technical tools, the number of false signals
RSI Arrows Profesional
Magdalena Estefania Colonna
RSI Arrows Professional v1.00 Advanced Technical Indicator for MetaTrader 5 Overview RSI Arrows Professional is a sophisticated technical indicator that combines the power of the traditional RSI (Relative Strength Index) with an intelligent directional signal system. Designed specifically for traders looking to identify optimal entry and exit points in the market, this indicator implements conservative trading strategies based on momentum analysis. Key Features Conservative Signal Strategy
First time on MetaTrader, introducing IQ Star Lines - an original Vedic Astrology based indicator. "Millionaires don't use astrology, billionaires do" . - J.P. Morgan, Legendary American financier and banker. IQ Star Lines, an unique astrological indicator purely based on   Vedic astrology   calculations, published for the   first time on Metatrader.  This unique tool plots dynamic planetary grid lines based on real-time stars, constellations, and celestial movements, which allows you to plot t
No Wick Candle
Hafiz Anas Hashmi
5 (1)
No Wick Candles is a powerful price action indicator that identifies candles with no upper or lower wick (also known as Marubozu candles ) and automatically draws horizontal compensation lines from their open price with a "Compensation" label . These wickless candles represent strong momentum and are often used by professional traders as key support/resistance zones . The indicator helps you visualize potential reversal or continuation zones instantly. Key Features Detects Bullish (no lower wick
FREE
CDV Candle Engine Pro is a MetaTrader 5 indicator designed to visualize Cumulative Delta Volume (CDV) directly on the price chart. It helps traders read market pressure more clearly by showing the balance between buying and selling activity in a clean, customizable layout. If you trade on MetaTrader 4, the MT4 edition is available here:  CDV Candle Engine Pro MT4 Public channel:   CLICK HERE Main Features CDV candle visualization on the main chart for easy reading in real time. Optional subwind
L'indicateur SMC Venom Model BPR est un outil professionnel pour les traders travaillant dans le concept Smart Money (SMC). Il identifie automatiquement deux modèles clés sur le graphique des prix: FVG   (Fair Value Gap) est une combinaison de trois bougies, dans laquelle il y a un écart entre la première et la troisième bougie. Forme une zone entre les niveaux où il n'y a pas de support de volume, ce qui conduit souvent à une correction des prix. BPR   (Balanced Price Range) est une combinaiso
Introduction to EFW Analytics EFW Analytics was designed to accomplish the statement "We trade because there are regularities in the financial market". EFW Analytics is a set of tools designed to maximize your trading performance by capturing the repeating fractal geometry, known as the fifth regularity in the financial market. The functionality of EFW Analytics consists of three parts. Firstly, Equilibrium Fractal Wave Index is an exploratory tool to support your trading logic to choose which r
Rocket Trend
Andriy Sydoruk
The Rocket Trend indicator is trending. The indicator draws two-color points connected by lines along the chart. This is a trend indicator, it is an algorithmic indicator. It is easy to work and understand when a blue circle appears, you need to buy, when a red one appears, sell. The indicator is used for scalping and pipsing, and has proven itself well. Rocket Trend is available for analyzing the direction of the trend for a specific period of time. Ideal for novice traders learning the laws o
The indicator determines the state of the market: trend or flat. The state of the market is determined by taking into account volatility. The flat (trading corridor)is displayed in yellow. The green color shows the upward trend. The red color shows the downward trend. The height of the label corresponds to the volatility in the market. The indicator does not redraw . Settings History_Size   - the amount of history for calculation. Period_Candles  - the number of candles to calculate the indicat
ATrend
Zaha Feiz
4.82 (17)
"ATREND: Come funziona e come utilizzarlo" ### Come funziona L'indicatore "ATREND" per la piattaforma MT5 è progettato per fornire ai trader robusti segnali di acquisto e vendita utilizzando una combinazione di metodologie di analisi tecnica. Questo indicatore sfrutta principalmente l'Average True Range (ATR) per la misurazione della volatilità, insieme ad algoritmi di individuazione dei trend per identificare potenziali movimenti di mercato. Lascia un messaggio dopo l'acquisto e ricevi un rega
Created by imjesstwoone and mickey1984, this trade model attempts to capture the expansion from the 10:00-14:00 EST 4h candle using just 3 simple steps. All of the information presented in this description has been outlined by its creators, all I did was translate it to MQL5. All core settings of the trade model may be edited so that users can test several variations, however this description will cover its default, intended behavior using NQ 5m as an example. Step 1 is to identify our Price Ra
Gli utenti di questo prodotto hanno anche acquistato
Se acquisti questo indicatore, riceverai il mio Trade Manager Professionale + EA  GRATUITAMENTE. Innanzitutto è importante sottolineare che questo sistema di trading è un indicatore Non-Repainting, Non-Redrawing e Non-Lagging, il che lo rende ideale sia per il trading manuale che per quello automatico. Corso online, manuale e download di preset. Il "Sistema di Trading Smart Trend MT5" è una soluzione completa pensata sia per i trader principianti che per quelli esperti. Combina oltre 10 indicat
Power Candles MT5
Daniel Stein
5 (5)
Power Candles – Segnali di ingresso basati sulla forza per tutti i mercati Power Candles porta l’analisi di forza collaudata di Stein Investments direttamente sul grafico dei prezzi. Invece di reagire solo al prezzo, ogni candela viene colorata in base alla reale forza di mercato, consentendo di identificare immediatamente accumuli di momentum, accelerazioni della forza e transizioni di trend pulite. Un’unica logica per tutti i mercati Power Candles funziona automaticamente su tutti i simboli di
Divergence Bomber
Ihor Otkydach
4.9 (81)
Ogni acquirente dell’indicatore riceverà inoltre gratuitamente: L’utilità esclusiva “Bomber Utility”, che gestisce automaticamente ogni operazione, imposta i livelli di Stop Loss e Take Profit e chiude le posizioni secondo le regole della strategia I file di configurazione (set file) per adattare l’indicatore a diversi asset I set file per configurare il Bomber Utility in tre modalità: “Rischio Minimo”, “Rischio Bilanciato” e “Strategia di Attesa” Una guida video passo-passo per installare, conf
Entry In The Zone and SMC Multi Timeframe è uno strumento di analisi di mercato in tempo reale sviluppato sulla base degli Smart Money Concepts (SMC). È progettato per aiutare i trader ad analizzare la struttura del mercato in modo sistematico e ottenere una visione più chiara della direzione generale del mercato. Il sistema analizza automaticamente i Punti di Inversione, le Zone Chiave e la Market Structure su più timeframe, mostrando Point of Interest (POI), segnali No Repaint e Auto Fibonacci
SuperScalp Pro
Van Minh Nguyen
5 (1)
SuperScalp Pro – Sistema avanzato di indicatore per scalping con filtri multipli SuperScalp Pro è un sistema avanzato di indicatore per scalping che combina il classico Supertrend con molteplici filtri di conferma intelligenti. L’indicatore funziona in modo efficiente su tutti i timeframe da M1 a H4 ed è particolarmente adatto per XAUUSD, BTCUSD e le principali coppie Forex. Può essere utilizzato come sistema stand-alone o integrato in modo flessibile nelle strategie di trading esistenti. L’indi
Azimuth Pro
Ottaviano De Cicco
5 (1)
LAUNCH PROMO Azimuth Pro price is initially set at 299$ for the first 100 buyers. Final price will be 499$ . THE DIFFERENCE BETWEEN RETAIL AND INSTITUTIONAL ENTRIES ISN'T THE INDICATOR — IT'S THE LOCATION. Most traders enter at arbitrary price levels, chasing momentum or reacting to lagging signals. Institutions wait for price to reach structured levels where supply and demand actually shift. Azimuth Pro maps these levels automatically: swing-anchored VWAP, multi-timeframe structure lines, an
Ottieni l’indicatore AUX GRATUITO e il supporto EA Download diretto — Clicca qui [ D.I.C.E ] The DICE Indicator  Divergence in Chaos Environment è uno strumento MT5 specializzato per trader che applicano la Teoria delle Onde di Elliott nel contesto delle tecniche di Trading Chaos. Identifica divergenze nascoste e regolari nell’azione dei prezzi, sincronizzate con l’ambiente di mercato caotico descritto da Bill Williams. Caratteristiche principali Divergenza allineata alle Onde di Elliott: rilev
Atomic Analyst MT5
Issam Kassas
4.07 (28)
Innanzitutto, vale la pena sottolineare che questo indicatore di trading non è repaint, non è ridisegno e non presenta ritardi, il che lo rende ideale sia per il trading manuale che per quello automatico. Manuale utente: impostazioni, input e strategia. L'Analista Atomico è un indicatore di azione del prezzo PA che utilizza la forza e il momentum del prezzo per trovare un miglior vantaggio sul mercato. Dotato di filtri avanzati che aiutano a rimuovere rumori e segnali falsi, e aumentare il pote
Smart Stop Indicator – Precisione intelligente dello stop-loss direttamente sul grafico Panoramica Smart Stop Indicator è la soluzione ideale per i trader che desiderano posizionare il loro stop-loss in modo chiaro e metodico, senza dover indovinare o affidarsi all’intuizione. Questo strumento combina la logica classica del price action (massimi e minimi strutturali) con un moderno riconoscimento dei breakout per identificare il prossimo livello di stop realmente logico. In trend, in range o i
FX Power MT5 NG
Daniel Stein
5 (30)
FX Power: Analizza la Forza delle Valute per Decisioni di Trading Più Intelligenti Panoramica FX Power è lo strumento essenziale per comprendere la reale forza delle principali valute e dell'oro in qualsiasi condizione di mercato. Identificando le valute forti da comprare e quelle deboli da vendere, FX Power semplifica le decisioni di trading e rivela opportunità ad alta probabilità. Che tu segua le tendenze o anticipi inversioni utilizzando valori estremi di Delta, questo strumento si adatta
Trend Screener Pro MT5
STE S.S.COMPANY
4.84 (100)
Indicatore di tendenza, soluzione unica rivoluzionaria per il trading di tendenze e il filtraggio con tutte le importanti funzionalità di tendenza integrate in un unico strumento! È un indicatore multi-timeframe e multi-valuta al 100% non ridipingibile che può essere utilizzato su tutti i simboli/strumenti: forex, materie prime, criptovalute, indici e azioni. Trend Screener è un indicatore di tendenza che segue un indicatore efficiente che fornisce segnali di tendenza a freccia con punti nel gra
Top indicator for MT5   providing accurate signals to enter a trade without repainting! It can be applied to any financial assets:   forex, cryptocurrencies, metals, stocks, indices .  Watch  the video  (6:22) with an example of processing only one signal that paid off the indicator! MT4 version is here It will provide pretty accurate trading signals and tell you when it's best to open a trade and close it. Most traders improve their trading results during the first trading week with the help of
Super Signal – Skyblade Edition Sistema professionale di segnali di tendenza senza repaint / senza ritardo con tasso di vincita eccezionale | Per MT4 / MT5 Funziona meglio su timeframe più bassi, come 1 minuto, 5 minuti e 15 minuti. Caratteristiche principali: Super Signal – Skyblade Edition è un sistema intelligente di segnali progettato specificamente per il trading di tendenza. Utilizza una logica di filtraggio multilivello per identificare esclusivamente i movimenti direzionali forti, supp
L’indicatore evidenzia le zone in cui viene dichiarato interesse sul mercato , per poi mostrare la zona di accumulo degli ordini . Funziona come un book degli ordini su larga scala . Questo è l’indicatore per i grandi capitali . Le sue prestazioni sono eccezionali. Qualsiasi interesse ci sia nel mercato, lo vedrai chiaramente . (Questa è una versione completamente riscritta e automatizzata – non è più necessaria un’analisi manuale.) La velocità di transazione è un indicatore concettualmente nuo
FX Levels MT5
Daniel Stein
5 (12)
FX Levels: Supporti e Resistenze di Precisione Eccezionale per Tutti i Mercati Panoramica Rapida Cercate un modo affidabile per individuare livelli di supporto e resistenza in ogni mercato—coppie di valute, indici, azioni o materie prime? FX Levels fonde il metodo tradizionale “Lighthouse” con un approccio dinamico all’avanguardia, offrendo una precisione quasi universale. Basato sulla nostra esperienza reale con i broker e su aggiornamenti automatici giornalieri più quelli in tempo reale, FX
Innanzitutto, vale la pena sottolineare che questo Strumento di Trading è un Indicatore Non-Ridipingente, Non-Ridisegnante e Non-Laggante, il che lo rende ideale per il trading professionale. Corso online, manuale utente e demo. L'Indicatore Smart Price Action Concepts è uno strumento molto potente sia per i nuovi che per i trader esperti. Racchiude più di 20 utili indicatori in uno solo, combinando idee di trading avanzate come l'Analisi del Trader del Circolo Interno e le Strategie di Tradin
Grabber System MT5
Ihor Otkydach
4.82 (22)
Ti presento un eccellente indicatore tecnico: Grabber, che funziona come una strategia di trading "tutto incluso", pronta all’uso. In un solo codice sono integrati strumenti potenti per l’analisi tecnica del mercato, segnali di trading (frecce), funzioni di allerta e notifiche push. Ogni acquirente di questo indicatore riceve anche gratuitamente: L’utility Grabber: per la gestione automatica degli ordini aperti Video tutorial passo dopo passo: per imparare a installare, configurare e utilizzare
Shock Pullback
Suleiman Alhawamdah
5 (1)
Semplicemente, puoi iniziare a fare trading quando il movimento dei numeri bianchi — noti come "pips" — inizia ad apparire accanto alla candela corrente. I "pips" bianchi indicano che un'operazione di acquisto o vendita è attualmente attiva e si sta muovendo nella direzione corretta, come indicato dal colore bianco. Quando il movimento dei pips bianchi si interrompe e diventa di colore verde statico, questo segnala la fine della spinta attuale. Il colore verde dei numeri rappresenta il profitto
Market Structure Patterns
Samuel Manoel De Souza
4.47 (19)
Disponibile per   MT4   e   MT5 . Unisciti al canale Market Structure Patterns per scaricare materiale di studio e/o informazioni aggiuntive. Pubblicazioni correlate: Market Structure Patterns - Introduzione Acquistalo ora con 50% di sconto | Prezzo precedente $90 | Offerta valida fino al 31 dicembre | Un importante aggiornamento è in arrivo e il prezzo originale verrà adeguato. Market Structure Patterns   è un indicatore basato sui   Smart Money Concepts   che mostra gli   elementi SMC/ICT  
Quantum TrendPulse
Bogdan Ion Puscasu
5 (20)
Ecco   Quantum TrendPulse   , lo strumento di trading definitivo che combina la potenza di   SuperTrend   ,   RSI   e   Stocastico   in un unico indicatore completo per massimizzare il tuo potenziale di trading. Progettato per i trader che cercano precisione ed efficienza, questo indicatore ti aiuta a identificare con sicurezza le tendenze di mercato, i cambiamenti di momentum e i punti di entrata e uscita ottimali. Caratteristiche principali: Integrazione SuperTrend:   segui facilmente l'andame
IX Power MT5
Daniel Stein
4.92 (12)
IX Power: Scopri approfondimenti di mercato per indici, materie prime, criptovalute e forex Panoramica IX Power è uno strumento versatile progettato per analizzare la forza di indici, materie prime, criptovalute e simboli forex. Mentre FX Power offre la massima precisione per le coppie di valute utilizzando i dati di tutte le coppie disponibili, IX Power si concentra esclusivamente sui dati di mercato del simbolo sottostante. Questo rende IX Power una scelta eccellente per mercati non correlat
ARIScalping
Temirlan Kdyrkhan
ARIScalp is a powerful trading companion designed to generate high-probability entry signals with dynamic TP/SL/DP levels based on volatility. Built-in performance tracking shows win/loss stats, PP1/PP2 hits, and success rates all updated live. Key Features: Buy/Sell signals with adaptive volatility bands Real-time TP/SL/DP levels based on ATR Built-in MA Filter with optional ATR/StdDev volatility Performance stats panel (Success, Profit/Loss, PP1/PP2) Alerts via popup, sound, push, or email Cus
ARICoins
Temirlan Kdyrkhan
ARICoin is a powerful trading companion designed to generate high-probability entry signals with dynamic TP/SL/DP levels based on volatility. Built-in performance tracking shows win/loss stats, PP1/PP2 hits, and success rates all updated live. Key Features: Buy/Sell signals with adaptive volatility bands Real-time TP/SL/DP levels based on ATR Built-in MA Filter with optional ATR/StdDev volatility Performance stats panel (Success, Profit/Loss, PP1/PP2) Alerts via popup, sound, push, or email Cust
Gold Sniper Scalper Pro
Ich Khiem Nguyen
3.5 (8)
Gold Sniper Scalper Pro è un indicatore professionale per MetaTrader 5, progettato per supportare i trader nell'identificare punti di ingresso e gestire il rischio in modo efficace. L'indicatore fornisce un set completo di strumenti analitici che include un sistema di rilevamento dei segnali, gestione automatica di Entry/SL/TP, analisi del volume e statistiche delle performance in tempo reale. Guida utente per comprendere il sistema   |   Guida utente per altre lingue CARATTERISTICHE PRINCIPALI
FX Dynamic MT5
Daniel Stein
5 (5)
FX Dynamic: Monitora volatilità e trend con un’analisi ATR personalizzabile Panoramica FX Dynamic è uno strumento potente che sfrutta i calcoli di Average True Range (ATR) per fornire ai trader informazioni impareggiabili sulla volatilità, sia giornaliera che intraday. Impostando soglie di volatilità chiare—ad esempio 80%, 100%, 130%—puoi individuare rapidamente opportunità di profitto o ricevere avvisi quando il mercato supera i range abituali. FX Dynamic si adatta al fuso orario del tuo brok
PZ Swing Trading MT5
PZ TRADING SLU
5 (5)
Protect against whipsaws: revolutionize your swing trading approach Swing Trading is the first indicator designed to detect swings in the direction of the trend and possible reversal swings. It uses the baseline swing trading approach, widely described in trading literature. The indicator studies several price and time vectors to track the aggregate trend direction and detects situations in which the market is oversold or overbought and ready to correct. [ Installation Guide | Update Guide | Tro
Introduction to X3 Chart Pattern Scanner X3 Cherart Pattern Scanner is the non-repainting and non-lagging indicator detecting X3 chart patterns including Harmonic pattern, Elliott Wave pattern, X3 patterns, and Japanese Candlestick patterns. Historical patterns match with signal patterns. Hence, you can readily develop the solid trading strategy in your chart. More importantly, this superb pattern scanner can detect the optimal pattern of its kind. In addition, you can switch on and off individu
Trend Forecaster
Alexey Minkov
5 (7)
The Trend Forecaster indicator utilizes a unique proprietary algorithm to determine entry points for a breakout trading strategy. The indicator identifies price clusters, analyzes price movement near levels, and provides a signal when the price breaks through a level. The Trend Forecaster indicator is suitable for all financial assets, including currencies (Forex), metals, stocks, indices, and cryptocurrencies. You can also adjust the indicator to work on any time frames, although it is recommen
Trend indicator AI mt5
Ramil Minniakhmetov
5 (13)
Trend Ai indicator è un ottimo strumento che migliorerà l'analisi di mercato di un trader combinando l'identificazione della tendenza con punti di ingresso utilizzabili e avvisi di inversione. Questo indicatore consente agli utenti di navigare nelle complessità del mercato forex con fiducia e precisione Oltre ai segnali primari, l'indicatore Ai di tendenza identifica i punti di ingresso secondari che si presentano durante i pullback o i ritracciamenti, consentendo ai trader di capitalizzare le
Support And Resistance Screener è in un indicatore di livello per MetaTrader che fornisce più strumenti all'interno di un indicatore. Gli strumenti disponibili sono: 1. Screener della struttura del mercato. 2. Zona di ritiro rialzista. 3. Zona di ritiro ribassista. 4. Punti pivot giornalieri 5. Punti pivot settimanali 6. Punti pivot mensili 7. Forte supporto e resistenza basati sul modello e sul volume armonici. 8. Zone a livello di banca. OFFERTA A TEMPO LIMITATO: il supporto HV e l'indicatore
Altri dall’autore
Special offer : ALL TOOLS , just $35 each! New tools   will be   $30   for the   first week   or the   first 3 purchases !  Trading Tools Channel on MQL5 : Join my MQL5 channel to update the latest news from me L'indicatore Volumetric Order Blocks Multi Timeframe è uno strumento potente progettato per i trader che cercano approfondimenti sul comportamento del mercato identificando le aree di prezzo chiave dove i partecipanti significativi accumulano ordini. Queste aree, note come blocchi d'ordi
Special offer : ALL TOOLS , just $35 each! New tools   will be   $30   for the   first week   or the   first 3 purchases !  Trading Tools Channel on MQL5 : Join my MQL5 channel to update the latest news from me Scopri la potenza del concetto di Inversion Fair Value Gap (IFVG) di ICT con l’ Indicatore Inversion Fair Value Gaps ! Questo strumento all’avanguardia porta i Fair Value Gaps (FVG) a un livello successivo, identificando e visualizzando le zone di FVG invertite – aree chiave di supporto
Volumatic VIDyA MT4
Duc Hoan Nguyen
4.5 (4)
Special offer : ALL TOOLS , just $35 each! New tools   will be   $30   for the   first week   or the   first 3 purchases !  Trading Tools Channel on MQL5 : Join my MQL5 channel to update the latest news from me Volumatic VIDYA (Variable Index Dynamic Average) è un indicatore avanzato progettato per monitorare le tendenze e analizzare la pressione di acquisto e vendita in ogni fase di una tendenza. Utilizzando il Variable Index Dynamic Average come tecnica principale di smorzamento dinamico, que
Special offer : ALL TOOLS , just $35 each! New tools   will be   $30   for the   first week   or the   first 3 purchases !  Trading Tools Channel on MQL5 : Join my MQL5 channel to update the latest news from me Presentiamo il SuperTrend ATR Multiplier with Scanner for MT5 – uno strumento versatile e potente progettato per aiutarti a essere sempre un passo avanti alle tendenze di mercato, con funzionalità personalizzabili e avvisi in tempo reale. Basato sulla logica comprovata del SuperTrend di
FREE
Special offer : ALL TOOLS , just $35 each! New tools   will be   $30   for the   first week   or the   first 3 purchases !  Trading Tools Channel on MQL5 : Join my MQL5 channel to update the latest news from me L'indicatore Volumetric Order Blocks Multi Timeframe è uno strumento potente progettato per i trader che cercano approfondimenti sul comportamento del mercato identificando le aree di prezzo chiave dove i partecipanti significativi accumulano ordini. Queste aree, note come blocchi d'ordi
Supertrend Fakeout MT5
Duc Hoan Nguyen
5 (3)
Special offer : ALL TOOLS , just $35 each! New tools   will be   $30   for the   first week   or the   first 3 purchases !  Trading Tools Channel on MQL5 : Join my MQL5 channel to update the latest news from me L'indicatore Supertrend Fakeout è una versione migliorata del classico indicatore Supertrend , progettata per fornire segnali di tendenza più affidabili. Integrando funzionalità avanzate come Fakeout Index Limit e Fakeout ATR Mult , questo indicatore aiuta a filtrare i falsi segnali di i
FREE
Volumatic VIDyA MT5
Duc Hoan Nguyen
5 (2)
Special offer : ALL TOOLS , just $35 each! New tools   will be   $30   for the   first week   or the   first 3 purchases !  Trading Tools Channel on MQL5 : Join my MQL5 channel to update the latest news from me Volumatic VIDYA (Variable Index Dynamic Average) è un indicatore avanzato progettato per monitorare le tendenze e analizzare la pressione di acquisto e vendita in ogni fase di una tendenza. Utilizzando il Variable Index Dynamic Average come tecnica principale di smorzamento dinamico, que
Special offer : ALL TOOLS , just $35 each! New tools   will be   $30   for the   first week   or the   first 3 purchases !  Trading Tools Channel on MQL5 : Join my MQL5 channel to update the latest news from me Presentiamo il rivoluzionario RSI Kernel Optimized with Scanner per MT5, uno strumento all'avanguardia che ridefinisce l'analisi RSI tradizionale integrando il potente algoritmo di stima della densità del nucleo (KDE). Questo indicatore avanzato non solo fornisce informazioni in tempo re
Special offer : ALL TOOLS , just $35 each! New tools   will be   $30   for the   first week   or the   first 3 purchases !  Trading Tools Channel on MQL5 : Join my MQL5 channel to update the latest news from me Massimizza il tuo vantaggio nel trading con Follow Line MT5 con Scanner, un indicatore avanzato basato sulla volatilità progettato per trader seri. Questo strumento combina la potenza delle Bande di Bollinger con impostazioni personalizzabili, offrendo intuizioni precise sui movimenti de
FREE
Special offer : ALL TOOLS , just $35 each! New tools   will be   $30   for the   first week   or the   first 3 purchases !  Trading Tools Channel on MQL5 : Join my MQL5 channel to update the latest news from me Trendlines with Breaks Scanner è uno strumento di trading all’avanguardia progettato per aiutare i trader a identificare tendenze critiche e rilevare rotture in tempo reale. Con linee di tendenza generate automaticamente basate su punti pivot, questo indicatore consente ai trader di cogl
Special offer : ALL TOOLS , just $35 each! New tools   will be   $30   for the   first week   or the   first 3 purchases !  Trading Tools Channel on MQL5 : Join my MQL5 channel to update the latest news from me SMC è un approccio al trading che aiuta i trader a identificare le zone di liquidità, le posizioni istituzionali degli ordini e i principali punti di svolta del mercato. Sfruttando i principi SMC, i trader possono navigare nel mercato in modo più efficace, trovando punti di ingresso e us
OA SnR Power MT5
Duc Hoan Nguyen
5 (2)
Special offer : ALL TOOLS , just $35 each! New tools   will be   $30   for the   first week   or the   first 3 purchases !  Trading Tools Channel on MQL5 : Join my MQL5 channel to update the latest news from me Panoramica OA SnR Power è uno strumento potente progettato per aiutare i trader a identificare e valutare la forza dei livelli di supporto e resistenza. Integrando fattori chiave come il volume di trading, la frequenza dei rimbalzi e il numero di test, questo indicatore offre una vision
FREE
Supertrend Fakeout MT4
Duc Hoan Nguyen
4.25 (4)
Special offer : ALL TOOLS , just $35 each! New tools   will be   $30   for the   first week   or the   first 3 purchases !  Trading Tools Channel on MQL5 : Join my MQL5 channel to update the latest news from me L'indicatore Supertrend Fakeout è una versione migliorata del classico indicatore Supertrend , progettata per fornire segnali di tendenza più affidabili. Integrando funzionalità avanzate come Fakeout Index Limit e Fakeout ATR Mult , questo indicatore aiuta a filtrare i falsi segnali di i
FREE
Liquidity Pools MT4
Duc Hoan Nguyen
5 (1)
Special offer : ALL TOOLS , just $35 each! New tools   will be   $30   for the   first week   or the   first 3 purchases !  Trading Tools Channel on MQL5 : Join my MQL5 channel to update the latest news from me L'indicatore Liquidity Pools è uno strumento avanzato che identifica e segna potenziali zone di liquidità sul grafico analizzando aree di massimo e minimo con frequenti tocchi di stoppino, insieme al numero di rivisitazioni e al volume scambiato all'interno di ciascuna zona. Questo strum
Special offer : ALL TOOLS , just $35 each! New tools   will be   $30   for the   first week   or the   first 3 purchases !  Trading Tools Channel on MQL5 : Join my MQL5 channel to update the latest news from me Scopri la potenza del concetto di Inversion Fair Value Gap (IFVG) di ICT con l’ Indicatore Inversion Fair Value Gaps ! Questo strumento all’avanguardia porta i Fair Value Gaps (FVG) a un livello successivo, identificando e visualizzando le zone di FVG invertite – aree chiave di supporto
Special offer : ALL TOOLS , just $35 each! New tools   will be   $30   for the   first week   or the   first 3 purchases !  Trading Tools Channel on MQL5 : Join my MQL5 channel to update the latest news from me Supply Demand Retest and Break Multi Timeframe , questo strumento traccia le zone di offerta e domanda basate su candele a forte momentum, permettendoti di identificare queste zone su più timeframe utilizzando la funzione   timeframe selector   . Con etichette di retest e break, insieme
Special offer : ALL TOOLS , just $35 each! New tools   will be   $30   for the   first week   or the   first 3 purchases !  Trading Tools Channel on MQL5 : Join my MQL5 channel to update the latest news from me Massimizza il tuo vantaggio nel trading con Follow Line con Scanner, un indicatore avanzato basato sulla volatilità progettato per trader seri. Questo strumento combina la potenza delle Bande di Bollinger con impostazioni personalizzabili, offrendo intuizioni precise sui movimenti dei pr
FREE
Special offer : ALL TOOLS , just $35 each! New tools   will be   $30   for the   first week   or the   first 3 purchases !  Trading Tools Channel on MQL5 : Join my MQL5 channel to update the latest news from me Il Fibonacci Confluence Toolkit Multi-Timeframe è uno strumento avanzato di analisi tecnica progettato per trader professionisti, che aiuta a identificare potenziali zone di inversione del prezzo combinando segnali e modelli chiave del mercato. Con capacità di visualizzazione multi-timef
Special offer : ALL TOOLS , just $35 each! New tools   will be   $30   for the   first week   or the   first 3 purchases !  Trading Tools Channel on MQL5 : Join my MQL5 channel to update the latest news from me Nell'ambiente in continua evoluzione del trading finanziario, identificare e analizzare accuratamente i livelli di supporto e resistenza è essenziale per prendere decisioni di investimento informate. SnR Retest and Break Multi-Timeframe è un indicatore di supporto e resistenza progettato
Offerta speciale : ALL TOOLS , solo $35 ciascuno! New tools   will be   $30   for the   first week   or the   first 3 purchases !  Trading Tools Channel on MQL5 : Join my MQL5 channel to update the latest news from me In un ambiente di trading volatile, uno strumento di analisi potente e intuitivo può aiutarti a cogliere rapidamente le opportunità. Fibonacci Trend Scanner non solo integra le funzioni tradizionali dell’indicatore Fibonacci e SuperTrend, ma amplia anche le funzionalità con la sca
Special offer : ALL TOOLS , just $35 each! New tools   will be   $30   for the   first week   or the   first 3 purchases !  Trading Tools Channel on MQL5 : Join my MQL5 channel to update the latest news from me Cominciamo con le caratteristiche eccezionali: L'EA è dotato di un FILTRO NOTIZIE e di un FILTRO RSI. Basso rischio (alcune coppie di valute hanno un DrawDown <10%, persino del 5%). Questo EA non utilizza alcuna funzione di martingala o griglia. L'EA può visualizzare zone visive per il t
Special offer : ALL TOOLS , just $35 each! New tools   will be   $30   for the   first week   or the   first 3 purchases !  Trading Tools Channel on MQL5 : Join my MQL5 channel to update the latest news from me Presentiamo il SuperTrend by Kivanc Ozbilgic with Scanner – uno strumento versatile e potente progettato per aiutarti a essere sempre un passo avanti alle tendenze di mercato, con funzionalità personalizzabili e avvisi in tempo reale.  Puoi regolare il metodo di calcolo dell' ATR tra RMA
FREE
Special offer : ALL TOOLS , just $35 each! New tools   will be   $30   for the   first week   or the   first 3 purchases !  Trading Tools Channel on MQL5 : Join my MQL5 channel to update the latest news from me Panoramica OA SnR Power è uno strumento potente progettato per aiutare i trader a identificare e valutare la forza dei livelli di supporto e resistenza. Integrando fattori chiave come il volume di trading, la frequenza dei rimbalzi e il numero di test, questo indicatore offre una vision
FREE
AI Channels MT5
Duc Hoan Nguyen
5 (1)
Special offer : ALL TOOLS , just $35 each! New tools   will be   $30   for the   first week   or the   first 3 purchases !  Trading Tools Channel on MQL5 : Join my MQL5 channel to update the latest news from me L'indicatore AI Channels utilizza il clustering K-means mobile —una potente tecnica di apprendimento automatico nell'analisi dei cluster—per fornire intuizioni in tempo reale sulle tendenze di prezzo sottostanti. Questo indicatore crea canali adattivi basati su dati di prezzo raggruppati
FREE
AI Channels MT4
Duc Hoan Nguyen
5 (1)
Special offer : ALL TOOLS , just $35 each! New tools   will be   $30   for the   first week   or the   first 3 purchases !  Trading Tools Channel on MQL5 : Join my MQL5 channel to update the latest news from me L'indicatore AI Channels utilizza il clustering K-means mobile —una potente tecnica di apprendimento automatico nell'analisi dei cluster—per fornire intuizioni in tempo reale sulle tendenze di prezzo sottostanti. Questo indicatore crea canali adattivi basati su dati di prezzo raggruppati
FREE
Special offer : ALL TOOLS , just $35 each! New tools   will be   $30   for the   first week   or the   first 3 purchases !  Trading Tools Channel on MQL5 : Join my MQL5 channel to update the latest news from me Il Fibonacci Confluence Toolkit Multi-Timeframe è uno strumento avanzato di analisi tecnica progettato per trader professionisti, che aiuta a identificare potenziali zone di inversione del prezzo combinando segnali e modelli chiave del mercato. Con capacità di visualizzazione multi-timef
Special offer : ALL TOOLS , just $35 each! New tools   will be   $30   for the   first week   or the   first 3 purchases !  Trading Tools Channel on MQL5 : Join my MQL5 channel to update the latest news from me Trendlines with Breaks Scanner è uno strumento di trading all’avanguardia progettato per aiutare i trader a identificare tendenze critiche e rilevare rotture in tempo reale. Con linee di tendenza generate automaticamente basate su punti pivot, questo indicatore consente ai trader di cogl
Special offer : ALL TOOLS , just $35 each! New tools   will be   $30   for the   first week   or the   first 3 purchases !  Trading Tools Channel on MQL5 : Join my MQL5 channel to update the latest news from me Nei mercati finanziari dinamici, identificare i segnali di inversione di tendenza è essenziale per un trading efficace. L'RSI Divergence Scanner è progettato per aiutarti a rilevare segnali di divergenza RSI su varie coppie di valute e timeframe in modo accurato ed efficiente. Vedi più v
FREE
Special offer : ALL TOOLS , just $35 each! New tools   will be   $30   for the   first week   or the   first 3 purchases !  Trading Tools Channel on MQL5 : Join my MQL5 channel to update the latest news from me I. Introduzione Market Structure Trend Targets Scanner è uno strumento potente per analizzare le tendenze di mercato, identificare i punti di breakout e gestire il rischio tramite uno stop loss dinamico. Tracciando i massimi e i minimi precedenti per individuare i breakout, questo strum
Special offer : ALL TOOLS , just $35 each! New tools   will be   $30   for the   first week   or the   first 3 purchases !  Trading Tools Channel on MQL5 : Join my MQL5 channel to update the latest news from me Presentiamo il rivoluzionario RSI Kernel Optimized with Scanner, uno strumento all'avanguardia che ridefinisce l'analisi RSI tradizionale integrando il potente algoritmo di stima della densità del nucleo (KDE). Questo indicatore avanzato non solo fornisce informazioni in tempo reale sull
Filtro:
benny12
311
benny12 2026.01.21 15:03 
 

Perfect

Rispondi alla recensione