Trend Detection Indicator
- Indicators
-
Elham Afsharpour
 I am an experienced trading software developer with 8 years of programming experience, especially in Python, C++, and MQL5. During the last 2 years, I have focused mainly on developing Expert Advisors, custom indicators, trading tools, and automation systems for MetaTrader.
 - Version: 1.2
- Updated: 19 July 2026
- Activations: 5
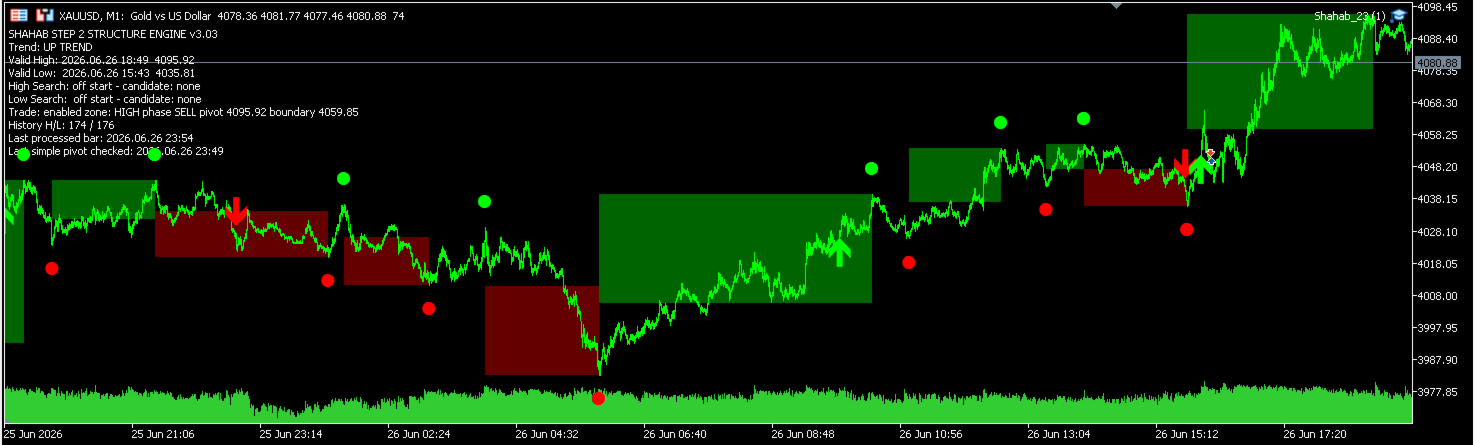
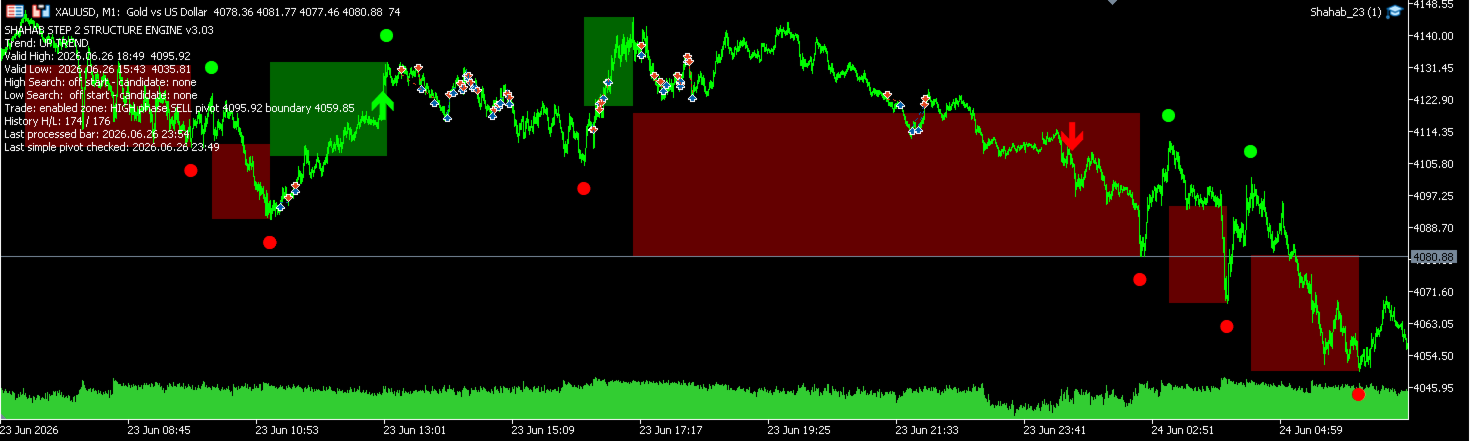
A clean MT5 structure-based trend detector with visual trend arrows, valid pivot markers, and optional structure areas.
STS Structure Trend Detector is a clean MetaTrader 5 indicator for detecting market trend direction from price structure.
STS Structure Trend Detector is designed for traders who want a simple visual tool to follow the current market structure directly on the chart. The indicator analyzes valid highs and lows, detects structural trend changes, and displays the result with clear arrows, pivot markers, and optional structure zones.
This is not an Expert Advisor and it does not open, close, or manage trades. It is a visual market-structure indicator only. It can be used as an additional confirmation tool for discretionary trading, manual analysis, or as part of a trader’s own strategy.
Main Features
-
Structure-based trend detection
-
Visual uptrend and downtrend arrows
-
Valid high and valid low markers on the chart
-
Optional price-structure areas between valid pivots
-
Optional simple pivot debug view for deeper analysis
-
Clean chart-window display
-
No trading logic
-
No orders, no position management, no money management
-
Suitable for manual market analysis
How It Can Help
The indicator helps traders identify the current direction of the market based on structural price behavior. Instead of showing many unnecessary signals, it focuses on important market turning points and trend changes. This makes the chart cleaner and easier to read.
It can be used for:
-
Trend direction confirmation
-
Market structure analysis
-
Manual entry filtering
-
Higher-timeframe bias checking
-
Support and resistance structure review
-
Visual study of valid highs and lows
Requirements
This indicator is made for MetaTrader 5.
Before using the indicator, the user should set the initial structure points correctly. The indicator requires an initial valid high candle time and an initial valid low candle time. These two points are used as the starting structure reference for the chart.
For best results:
-
Use the indicator on a chart with enough loaded history
-
Set the initial high and low candle times carefully
-
Choose the correct initial trend direction
-
Use a symbol and timeframe that fits your own trading method
-
Test the settings on a demo chart before using it in live analysis
Indicator Structure
The indicator is organized into several clean input sections:
Initial Structure
This section defines the first valid structure points used by the indicator.
Main inputs:
-
Initial valid high candle time
-
Initial valid low candle time
-
Initial trend direction
-
Snap to nearest bar option
-
Maximum snap distance in minutes
Structure Logic
This section controls the general structure confirmation behavior.
Main inputs:
-
Simple pivot side bars
-
Equal high/low tolerance
-
Break confirmation mode
-
Break buffer
-
Process history on start
-
Reset opposite search after valid pivot confirmation
Trend Arrows
This section controls how trend-change arrows are shown on the chart.
Main inputs:
-
Show or hide trend arrows
-
Arrow distance from candle
-
Uptrend arrow style
-
Downtrend arrow style
-
Arrow size
-
Uptrend color
-
Downtrend color
Valid Pivot Markers
This section controls the display of confirmed valid highs and lows.
Main input:
-
Show or hide valid pivot markers
Simple Pivot Debug
This section is mainly for users who want to visually study the internal simple pivot structure.
Main input:
-
Show or hide simple pivot debug markers
Valid Pivot Areas
This section controls optional structure zones drawn between important pivot areas.
Main inputs:
-
Show or hide valid pivot areas
-
Area percentage
-
High area color
-
Low area color
-
Rectangle transparency
-
Draw rectangles in background
General Settings
This section contains general display and chart-object settings.
Main inputs:
-
Clear old objects on initialization
-
Delete objects on deinitialization
Important Notes
STS Structure Trend Detector is an analysis tool, not a trading robot. It does not guarantee trading results and it does not replace risk management or personal trading judgment. The indicator is intended to help traders read market structure more clearly and make better-informed manual decisions.
Always test the indicator on a demo account or historical chart before using it in real trading conditions.