Super Arrow Indicator MT5
- Indicators
- Eda Kaya
- Version: 2.2
- Updated: 19 August 2025
Super Arrow Indicator MetaTrader5
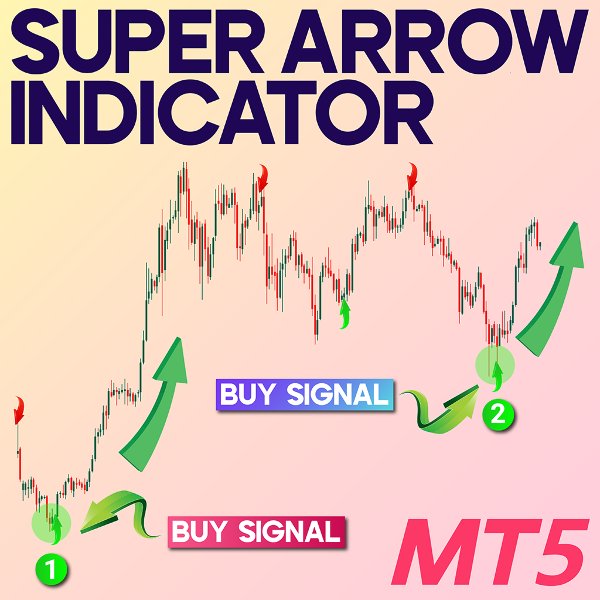
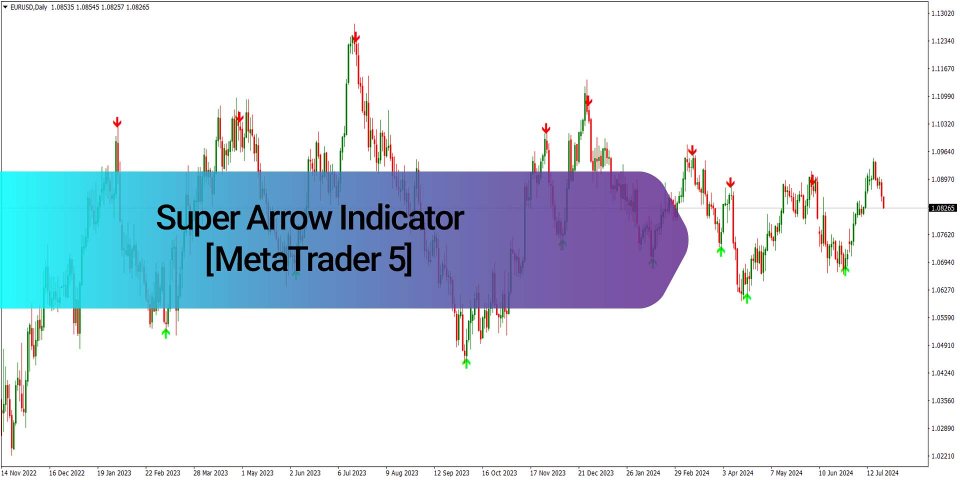
The Super Arrow indicator, designed for MetaTrader 5, integrates signals from several technical indicators to generate the most probable reversal signals and identify pivot highs and lows. It combines RSI, Bollinger Bands, Moving Average, and Magic Filter indicators to highlight lows with green arrows and highs with red arrows.
«Indicator Installation & User Guide»
MT5 Indicator Installation | Super Arrow Indicator MT4 | ALL Products By TradingFinderLab | Best MT5 Indicator: Refined Order Block Indicator for MT5 | Best MT5 Utility: Trade Assistant Expert TF MT5 | TP & SL Tool: Risk Reward Ratio Calculator RRR MT5 | Prop Firm Protector: Trade Assist Prop Firm Plus TF Expert MT5 | Money Management + DrawDown Protector: Trade Panel Prop Firm Drawdawn Limiter Pro MT5
Indicator Table
| Indicator Category | Signal and Forecast |
| Platforms | MetaTrader 5 |
| Trading Skills | Beginner |
| Indicator Types | Reversal - Lagging |
| Timeframe | M15 - M30 - H1 - H4 - D1 |
| Trading Style | Intraday - Day Trader - Swing Trading |
| Trading Instruments | Forex - Crypto - Indices |
Overview
When multiple indicators provide conflicting signals simultaneously, it can confuse traders and lead to poor decisions, increasing risk. To reduce this risk, combining several indicators can help eliminate false signals and result in more reliable trades.
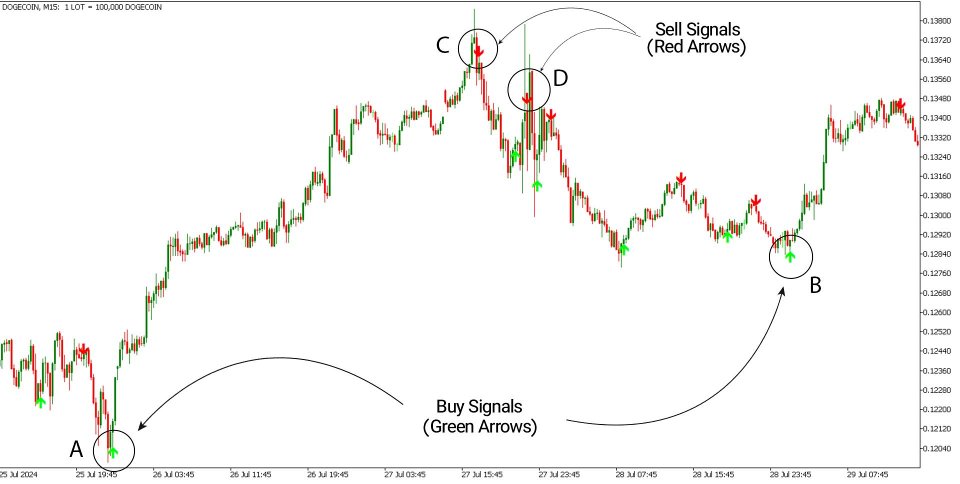
The Super Arrow indicator identifies potential lows (valleys) with a green arrow when a bullish trend is expected and multiple buy signals are detected. Likewise, it marks potential highs (peaks) with a red arrow when the trend is expected to be bearish and sell signals are confirmed. This method allows traders to make decisions based on the most likely trend reversal points.
Buy Signals (Uptrends)
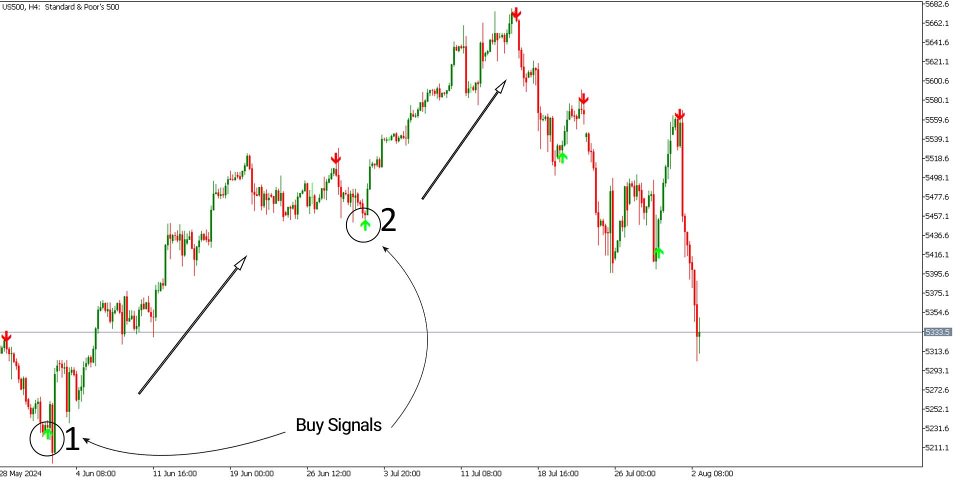
The image below illustrates a 4-hour chart of the S&P 500 index (US500). The indicator has pinpointed two major valleys at points 1 and 2, which serve as critical starting points for upward trends, and marked them with green arrows (Buy). When these buy signals appear, traders can prepare to go long by considering support levels and confirming tools such as candlestick patterns, classical chart patterns, trend lines, and channels.
Sell Signals (Downtrends)
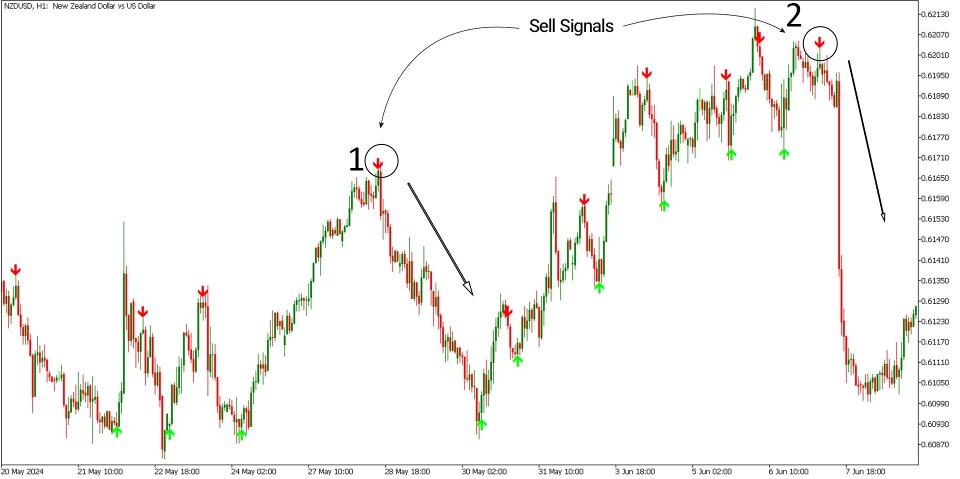
In the image below, a 1-hour chart of the NZD/USD currency pair is shown. The indicator has identified key peaks at points 1 and 2—locations often signaling a change in trend. These highs are marked with red arrows (Sell), indicating potential reversals. To confirm these sell signals, traders may use trend lines, static resistance levels, and reversal patterns.
Settings of the Super Arrow Indicator
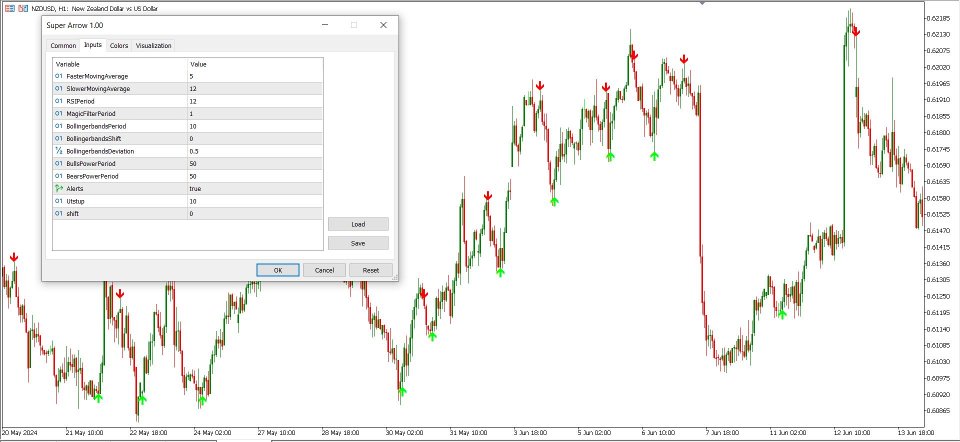
- FasterMovingAverage: 5
- SlowerMovingAverage: 12
- RSIPeriod: 12
- MagicFilterPeriod: 1
- BollingerbandsPeriod: 10
- BollingerbandsShift: 0
- BollingerbandsDeviation: 0.5
- BullsPowerPeriod: 50
- BearsPowerPeriod: 50
- Alerts: True
- Utstup: 10
- Shift: 0
Conclusion
Pinpointing market lows and highs—valleys and peaks—is a fundamental objective for traders. By aggregating signals from multiple indicators, the Super Arrow indicator helps identify areas with the greatest potential for major trend reversals. It can be utilized across all financial markets and various timeframes.
For stronger and more confident trading strategies, it is recommended to use this indicator alongside other tools such as price channels, regression channels, Fibonacci levels, and divergence analysis.

























LO ESTOY PROBANDO DE NUEVO CON LA VERSIÓN ACTUALIZADA.