Anti Alternate Shark Harmonic Indicator MT4
- Indicators
- Eda Kaya
- Version: 2.1
Anti Alternate Shark Harmonic Pattern Indicator MT4
The Anti Alternate Shark Harmonic Pattern Indicator is an advanced technical analysis tool built on harmonic pattern principles, emphasizing deep reversal zones and overextended price behavior. Unlike the traditional Shark pattern, this version adapts to structural changes in wavelength and direction to identify more accurate reversal zones.
«Indicator Installation & User Guide»
MT4 Indicator Installation | Anti Alternate Shark Harmonic Indicator MT5 | ALL Products By TradingFinderLab | Best MT4 Indicator: Refined Order Block Indicator for MT4 | Best MT4 Utility: Trade Assistant Expert TF MT4 | TP & SL Tool: Risk Reward Ratio Calculator RRR MT4 | Prop Firm Protector: Trade Assist Prop Firm Plus TF Expert MT4 | Money Management + DrawDown Protector: Trade Panel Prop Firm Drawdawn Limiter Pro MT4
Anti Alternate Shark Harmonic Pattern Specifications Table
The features of the Anti Alternate Shark Harmonic Pattern Indicator are presented in the table below:
| Category | Price Action – Candlestick – Harmonic Pattern |
| Platform | MetaTrader 4 |
| Skill Level | Intermediate |
| Indicator Type | Trend-following – Reversal |
| Timeframe | Multi time frame |
| Trading Style | Intraday trading |
| Trading Market | All markets |
Indicator Overview
The Anti Alternate Shark Harmonic Pattern typically appears at the conclusion of strong price movements and suggests a potential trend reversal. To validate the pattern, these Fibonacci ratios are crucial:
- XA and AB: Wave AB should retrace between 1.13 and 1.618 of wave XA.
- BC: This wave should extend 1.618 to 2.24 times the length of wave AB.
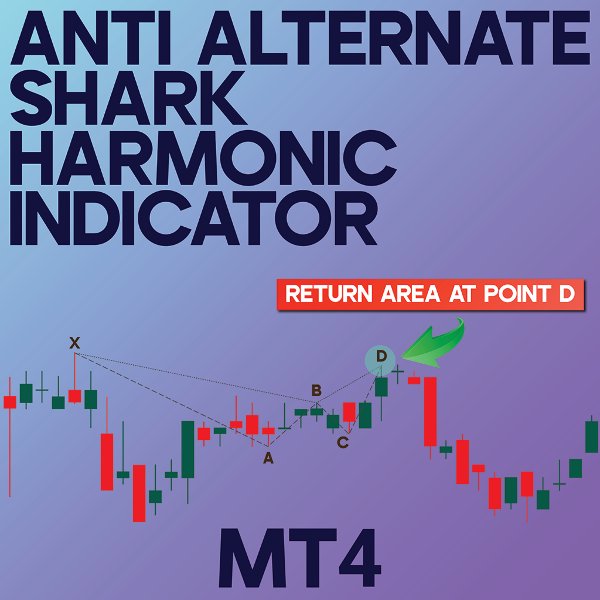
- CD: Point D is the key reversal zone and usually lies within the 0.886 to 1.13 retracement of wave XA.
Uptrend Conditions
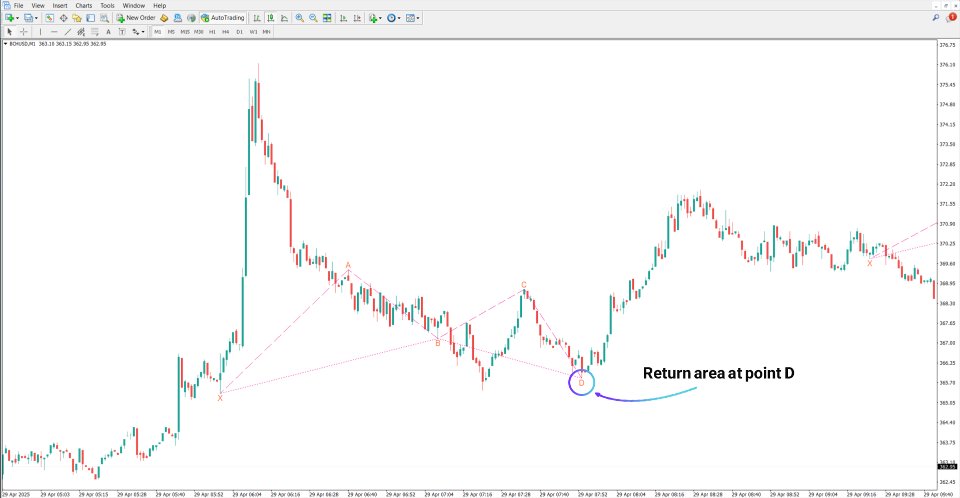
On the 1-minute Bitcoin Cash chart, a bullish Anti Alternate Shark pattern forms when point D is within the 0.886 to 1.13 Fibonacci range of wave XA. Price stabilization in this zone indicates a strong reversal area, likely triggering a bullish correction toward points C and A.
Downtrend Conditions
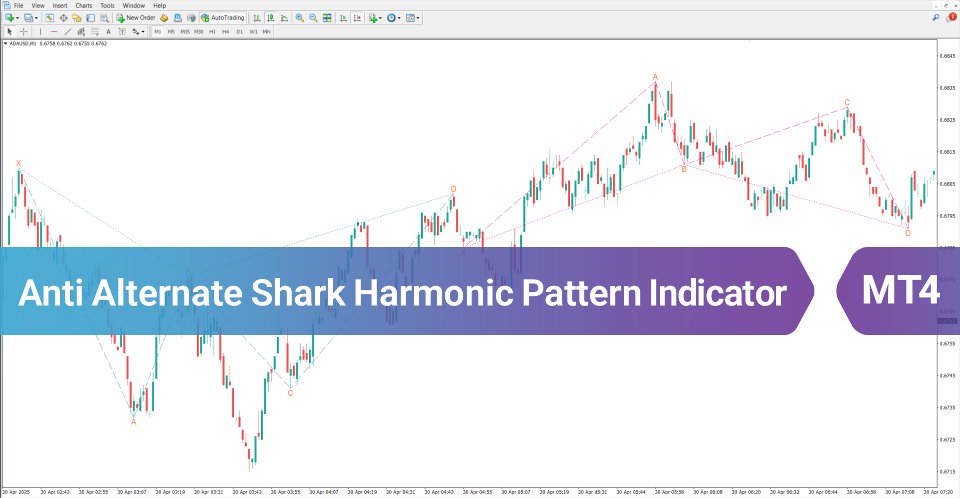
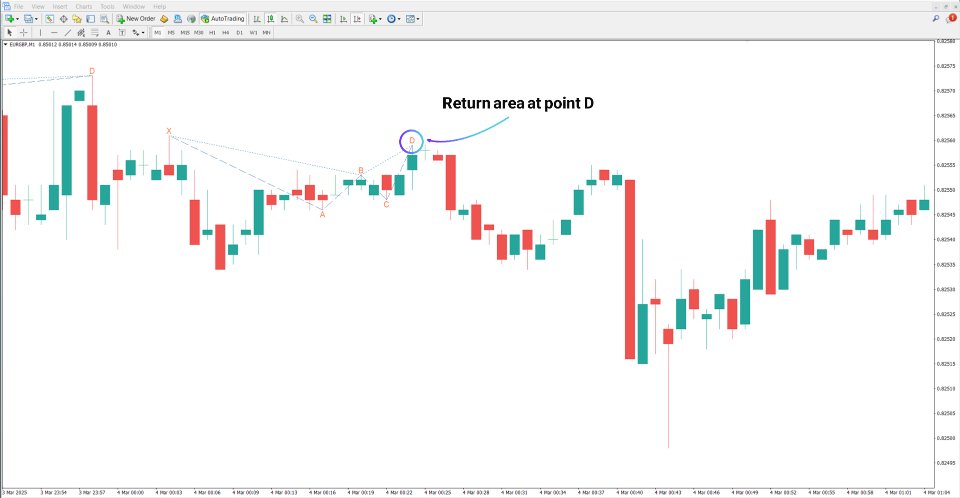
On the 1-minute EUR/GBP chart, the bearish pattern forms with point D also located in the 0.886 to 1.13 Fibonacci retracement zone of wave XA. This zone is treated as a reversal area and a valid point for initiating short positions.
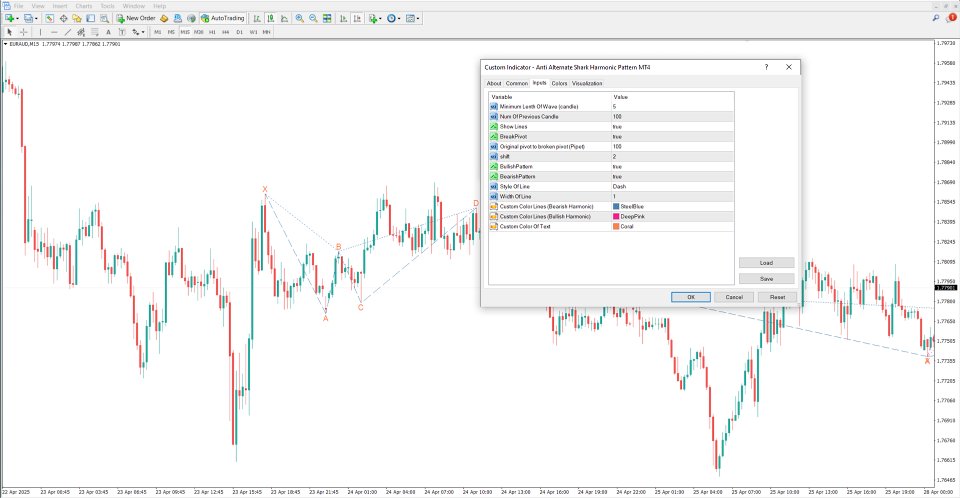
Anti Alternate Shark Harmonic Pattern Indicator Settings
- Minimum Length Of Wave (candle): Sets the minimum wavelength in candles
- Num Of Previous Candle: Number of previous candles used in analysis
- Show Lines: Toggle pattern line visibility
- Break Pivot: Enables pivot breakout detection
- Original pivot to broken pivot (Pipet): Sets distance between original and broken pivots
- Shift: Adjusts horizontal positioning of lines
- Bullish Pattern: Enables detection of bullish patterns
- Bearish Pattern: Enables detection of bearish patterns
- Style Of Line: Selects pattern line style
- Width Of Line: Adjusts pattern line thickness
- Custom Color Lines (Bearish Harmonic): Sets color for bearish harmonic lines
- Custom Color Lines (Bullish Harmonic): Sets color for bullish harmonic lines
- Custom Color Of Text: Sets label text color on the chart
Conclusion
The Anti Alternate Shark Harmonic Pattern Indicator is designed to identify reversal zones in the market by leveraging specific Fibonacci ratios within the XABCD structure. Once the pattern is formed and point D is confirmed, the indicator highlights the reversal zone, providing traders with a reliable technical foundation for both entry and exit strategies in bullish and bearish conditions.
