Three Drives Harmonic Pattern Indicator MT4
- Indicators
- Eda Kaya
- Version: 2.1
3 Drives Harmonic Pattern Indicator MetaTrader 4
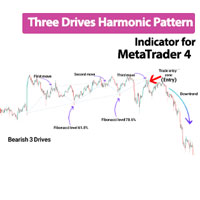
The Three Drives Harmonic Pattern Indicator, similar to the ABCD pattern, belongs to the category of classic chart patterns. It is designed to identify Potential Reversal Zones (PRZ) and integrates seamlessly with the MetaTrader 4 platform. This pattern can appear in both upward and downward trends:
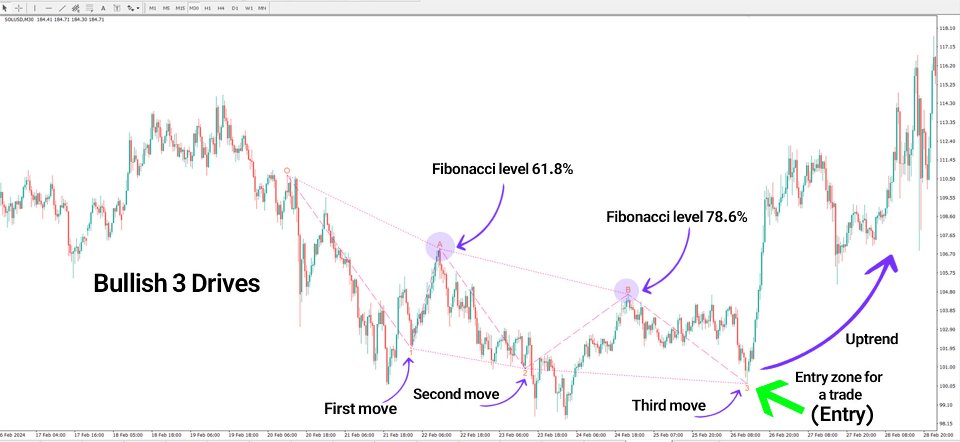
• In a bullish setup, three consecutive downward price movements suggest a potential reversal to the upside.
• In a bearish setup, three upward price drives indicate a possible reversal to the downside.
«Indicator Installation & User Guide»
MT4 Indicator Installation | Three Drives Harmonic Pattern Indicator MT5 | ALL Products By TradingFinderLab | Best MT4 Indicator: Refined Order Block Indicator for MT4 | Best MT4 Utility: Trade Assistant Expert TF MT4 | TP & SL Tool: Risk Reward Ratio Calculator RRR MT4 | Prop Firm Protector: Trade Assist Prop Firm Plus TF Expert MT4 | Money Management + DrawDown Protector: Trade Panel Prop Firm Drawdawn Limiter Pro MT4
Indicator Specifications Table
| Category | Harmonic Patterns – Support & Resistance – Classic Chart Patterns |
| Platform | MetaTrader 4 |
| Skill Level | Intermediate |
| Indicator Type | Continuation – Reversal |
| Timeframe | Multi-timeframe |
| Trading Style | Intraday trading |
| Markets | Cryptocurrency – Forex – Stocks |
Overview of the Indicator
Each move in the Three Drives Harmonic Pattern is measured using Fibonacci levels. Corrections typically retrace around 61.8% or 78.6% of the previous move, while the subsequent legs extend to 127.2% or 161.8% of the preceding correction. Once all three main drives and two corrections are completed, the endpoint of the third drive (Drive 3) becomes a strong reversal zone.
Traders can place buy (Entry) or sell (Exit) positions in alignment with the market direction at this zone.
Bullish Trend Analysis
In the Solana (SOL) cryptocurrency chart, the price initially drops, followed by a corrective move upward to Point A, which aligns with the 61.8% Fibonacci retracement of the first move. This resistance zone prompts a reversal downward. After the correction ends at Point B, the price extends to the 127.2% Fibonacci level of the B correction, marking a strong PRZ (Potential Reversal Zone).
Bearish Trend Analysis
In the USD/JPY currency pair, the price first increases, then pulls back to Point A, retracing 61.8% of the initial upward move. It then rises again to Point B before dropping to the 127.2% extension level of the B correction. This provides a reliable zone for initiating sell trades.
Indicator Settings
The indicator’s settings can be customized as follows:
• Minimum Length of Wave (candle): Sets the minimum number of candles needed to form a wave.
• Num of Previous Candles: Defines the number of past candles used for analysis.
• Show Lines: Toggles line visibility on the chart.
• Break Pivot: Shows pivot break analysis.
• Original Pivot to Broken Pivot (Pipet): Sets the pivot break range in pipettes.
• Shift: Adjusts line displacement on the chart.
• Bullish Pattern: Enables or disables bullish pattern display.
• Bearish Pattern: Enables or disables bearish pattern display.
• Style of Line: Selects the line style.
• Width of Line: Adjusts line thickness.
• Theme: Changes the indicator’s background theme.
• Custom Color Lines (Bearish Harmonic): Sets custom colors for bearish patterns.
• Custom Color Lines (Bullish Harmonic): Sets custom colors for bullish patterns.
• Custom Color of Text: Personalizes the color of text displayed.
Conclusion
The Three Drives Harmonic Pattern Indicator is rooted in harmonic trading principles and utilizes price action combined with Fibonacci retracement levels—mainly the 61.8% and 127.2% ratios. It is highly effective for identifying both bullish (uptrend) and bearish (downtrend) setups.
With its customizable features including line styles, price zones, themes, and color schemes, this indicator is a valuable tool for any trader.
