CCI Histogram Indicator MT5
- Indicators
- Eda Kaya
- Version: 1.3
CCI Histogram Indicator for MetaTrader 5
The CCI Histogram Indicator for MetaTrader 5 is designed to measure the deviation between current price levels and their historical averages over a selected timeframe. This enhanced version of the traditional Commodity Channel Index (CCI) offers improved precision for identifying price shifts and generating entry and exit signals.
«Indicator Installation & User Guide»
MT5 Indicator Installation | CCI Histogram Indicator MT4 | ALL Products By TradingFinderLab | Best MT5 Indicator: Refined Order Block Indicator for MT5 | Best MT5 Utility: Trade Assistant Expert TF MT5 | TP & SL Tool: Risk Reward Ratio Calculator RRR MT5 | Money Management: Easy Trade Manager MT5 | Trade Copier: Free Fast Local Trade Copier MT5 | Money management + prop protector: Trade Assist Prop Protector MT5
CCI Histogram Specification Table
The table below summarizes the key specifications of the CCI Histogram Indicator:
| Category | Volatile – Oscillator – Currency Strength |
| Platform | MetaTrader 5 |
| Skill Level | Intermediate |
| Indicator Type | Range – Breakout |
| Timeframe | Multi timeframe |
| Trading Style | Intraday Trading |
| Markets | All Markets |
Indicator Overview
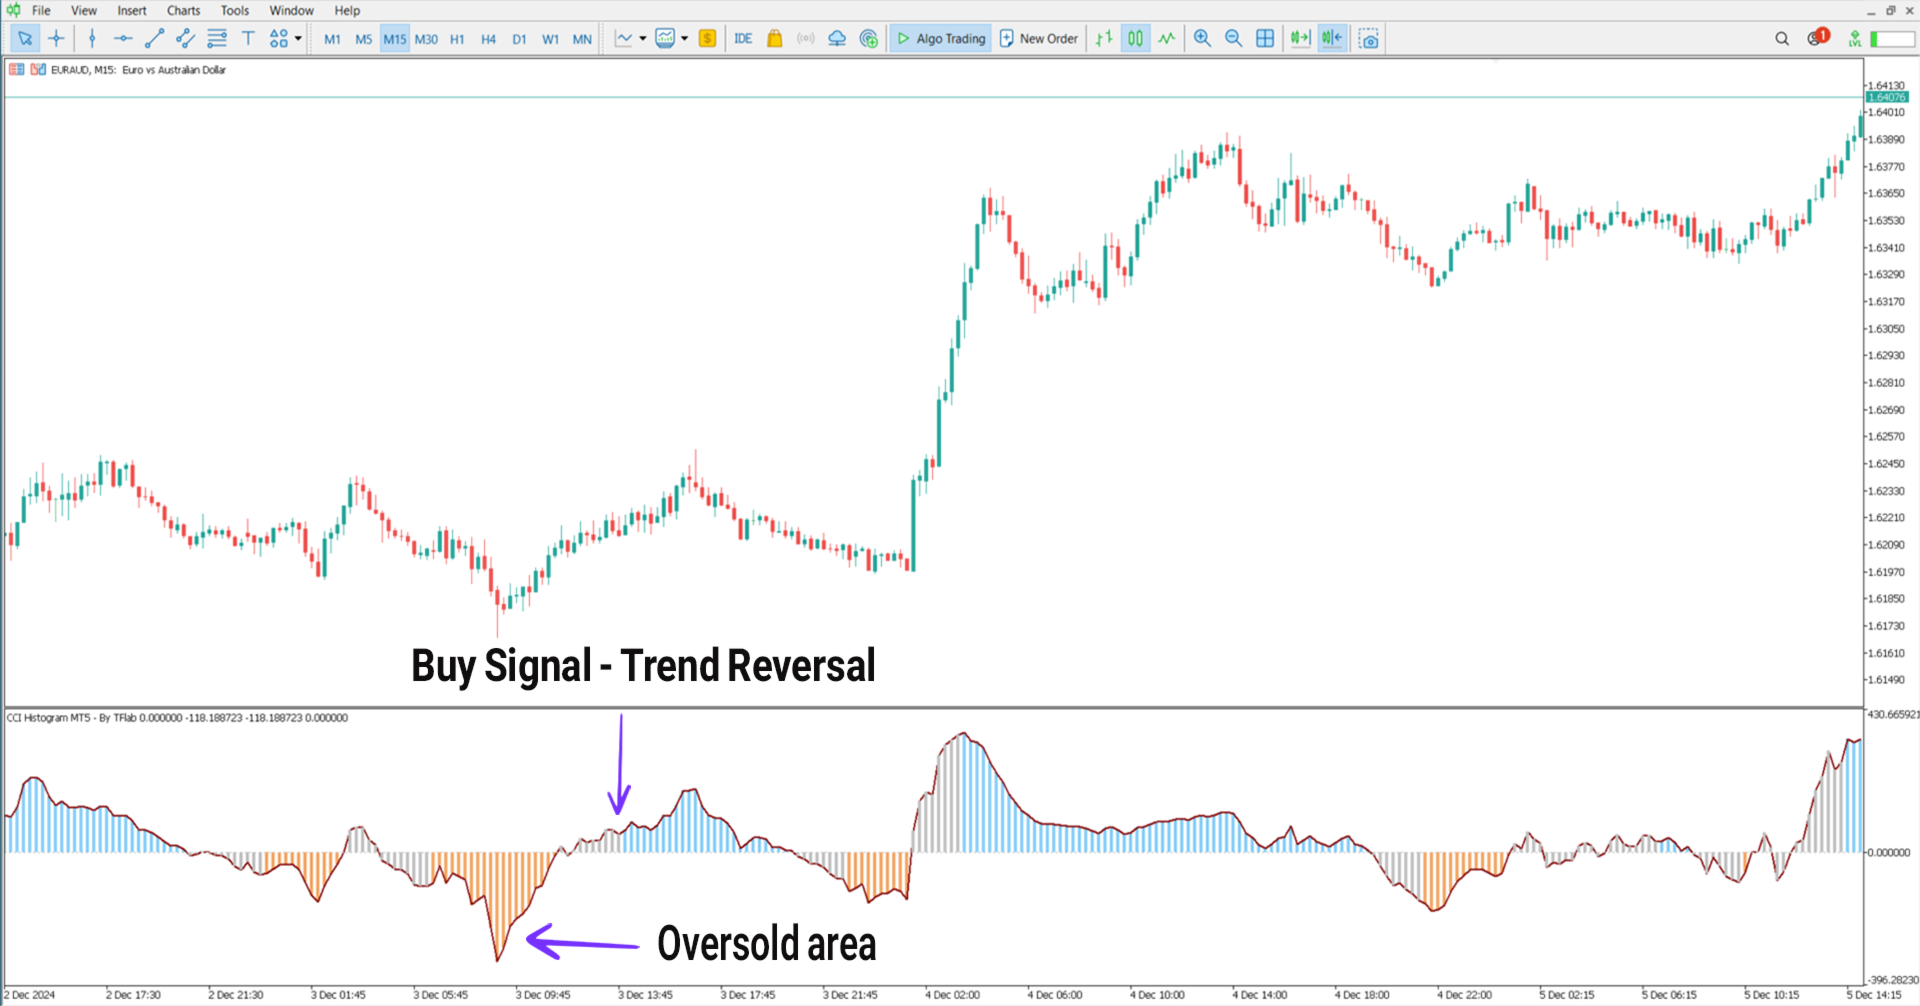
This indicator utilizes histogram bars to represent the difference between current price and historical average values over a defined period. Blue bars signal a positive deviation—indicating price is above the average—while orange bars suggest a negative deviation when price is below the average.
Gray bars represent neutral or consolidating market phases.
Uptrend Conditions
On the 15-minute EUR/AUD chart, orange histogram bars appear when the CCI value drops below zero, signaling an oversold condition. A subsequent shift to the upside in the histogram may indicate a potential buying opportunity as momentum builds.
Downtrend Conditions
On the 1-hour Dow Jones Index (DJI) chart, orange bars signal that the market is potentially overbought. When the CCI line crosses down from the positive territory, it often marks the beginning of a downtrend, presenting a sell opportunity.
Indicator Settings
The CCI Histogram Indicator includes several customizable inputs:
-
Chart Theme: Select your preferred chart layout
-
CCI Period: Define the number of bars for CCI calculation
-
Neutral Period: Set the range for the neutral zone
-
Lookback Period: Specify the historical range for analysis
Conclusion
The CCI Histogram Indicator simplifies the detection of trends, overbought and oversold conditions, and potential trade entries. By comparing current price levels to their historical averages, it delivers actionable insights across different timeframes and market conditions, making it a highly versatile trading tool.


perfect, its so helps