Tick Flow MT4
- Indicators
- Version: 1.2
- Updated: 31 August 2025
- Activations: 5

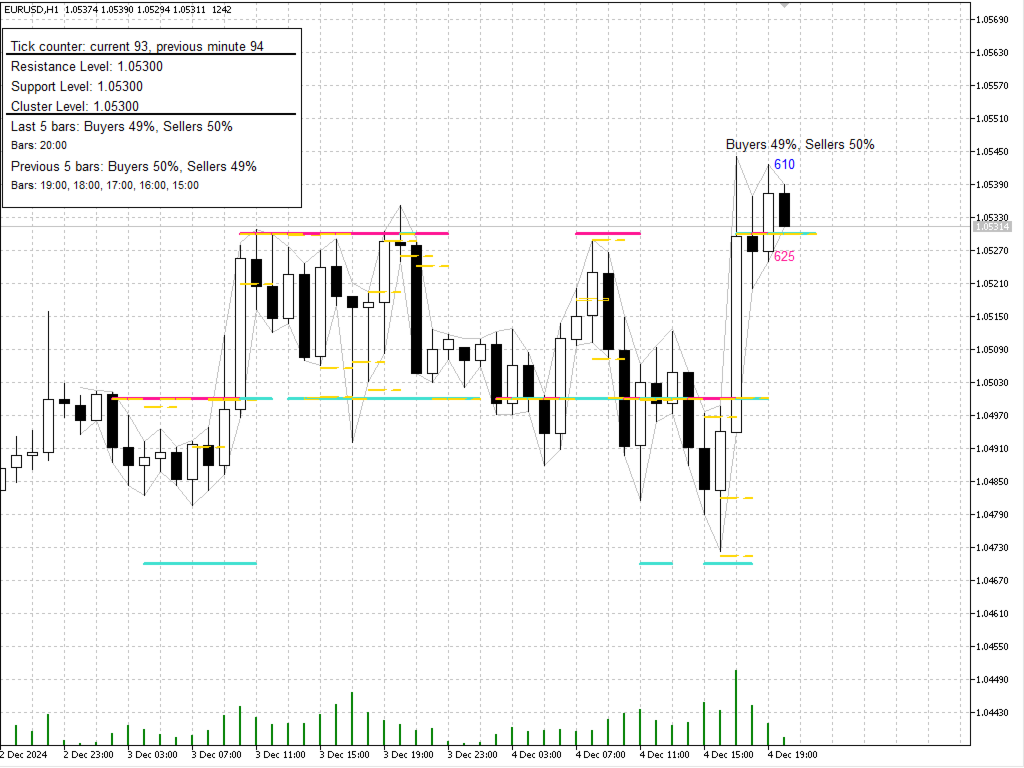
TickFlow is a tool for tick-data analysis and visual highlighting of significant zones on the chart. The utility aggregates current and historical ticks, shows the buy/sell balance, and helps to identify support/resistance levels and cluster zones.
This is the MetaTrader 5 version.
How it works (brief)
TickFlow collects tick data and aggregates it by price steps and candles.
Based on the collected data the indicator builds visual layers: up/down tick counters, buy/sell ratio, historical levels and clusters.
The user adjusts sensitivity and the analysis period in the settings. The tool does not make trading decisions — it provides data for analysis.
Features
-
Display of tick activity per candle (tick counters).
-
Percentage buy/sell ratio.
-
Construction of historical support and resistance levels based on tick volumes.
-
Cluster analysis of price areas (cluster analysis).
-
Flexible sensitivity settings for different trading horizons (scalping, intraday, medium-term).
-
Option to enable/disable tick history to reduce chart clutter.
-
Local storage of displayed data; does not require external DLLs and does not send data to external services.
Settings (key parameters; parameter names — in English)
General
-
NumberOfBarsForAnalysis — how many recent candles to analyze (for example, 5). More = wider coverage; less = more local analysis.
-
ShowTickActivityHistory — show tick activity for past candles (true/false).
-
NumberOfBarsToDisplay — how many candles with saved tick history to display (if history is enabled).
Display
-
ColorUpTickCounter — text color for the up-tick counter.
-
ColorDownTickCounter — text color for the down-tick counter.
-
ColorBuySellRatio — text color for the buy/sell percentage.
Levels and clusters
-
NumberOfTicksToAnalyze — number of ticks to use for building support/resistance levels (see suggested ranges below).
-
PriceStepAnalysis — minimal price step for level analysis (smaller step = more detailed levels).
-
UseClustering — enable cluster analysis (true/false).
-
ClusterPriceStep — price grouping step for clusters (for example, 0.001 for EURUSD with 5 decimal places).
-
NumberOfHistoricalLevels — how many previous levels to show on the chart.
Alerts
-
EnableAlerts — enable sound/text alerts when price reaches a level (true/false).
-
AlertPriceDistance — distance to the level that triggers an alert (in price units; example for EURUSD 5 decimals — 0.0001–0.0002).
Tuning recommendations (guidelines)
-
Scalping: NumberOfTicksToAnalyze ~ 5,000–10,000; use small values for PriceStepAnalysis and ClusterPriceStep .
-
Intraday: NumberOfTicksToAnalyze ~ 10,000–20,000; use a wider step for smoothing.
-
Medium-term: NumberOfTicksToAnalyze ~ 20,000–50,000; use larger steps so levels are broader.
These are guidelines — adjust settings to the specific instrument and liquidity.