LC Multi Session VWAP

LC Multi Session VWAP

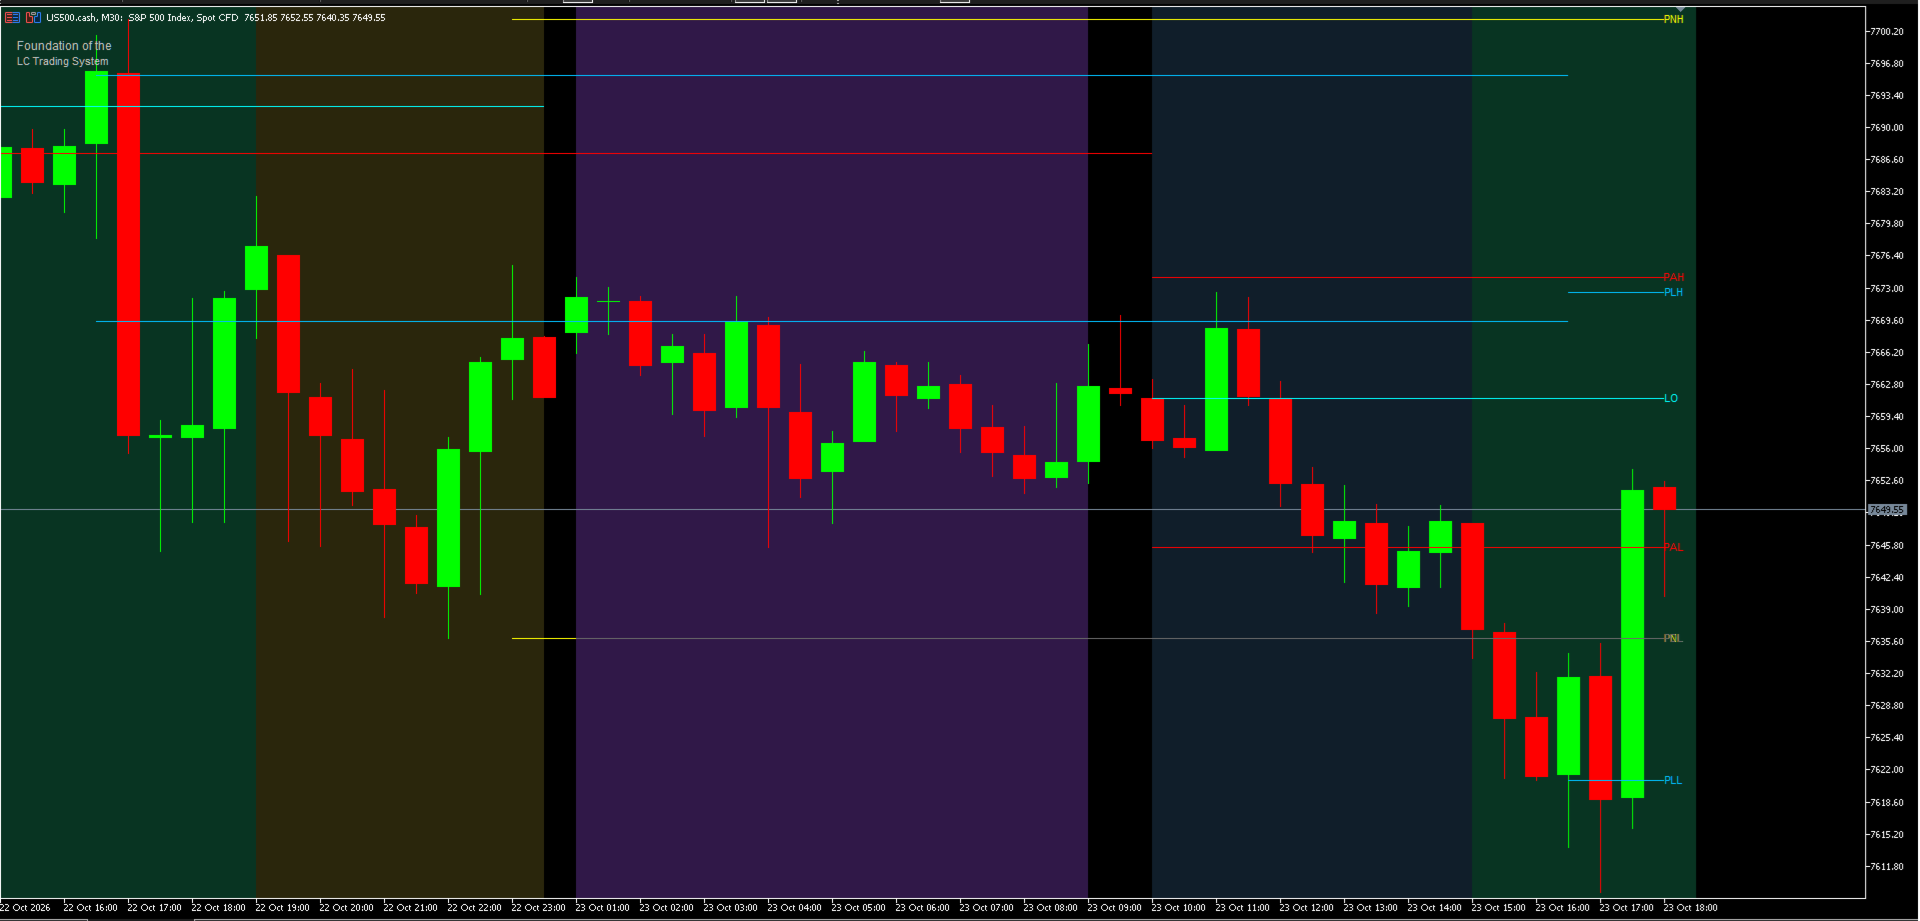
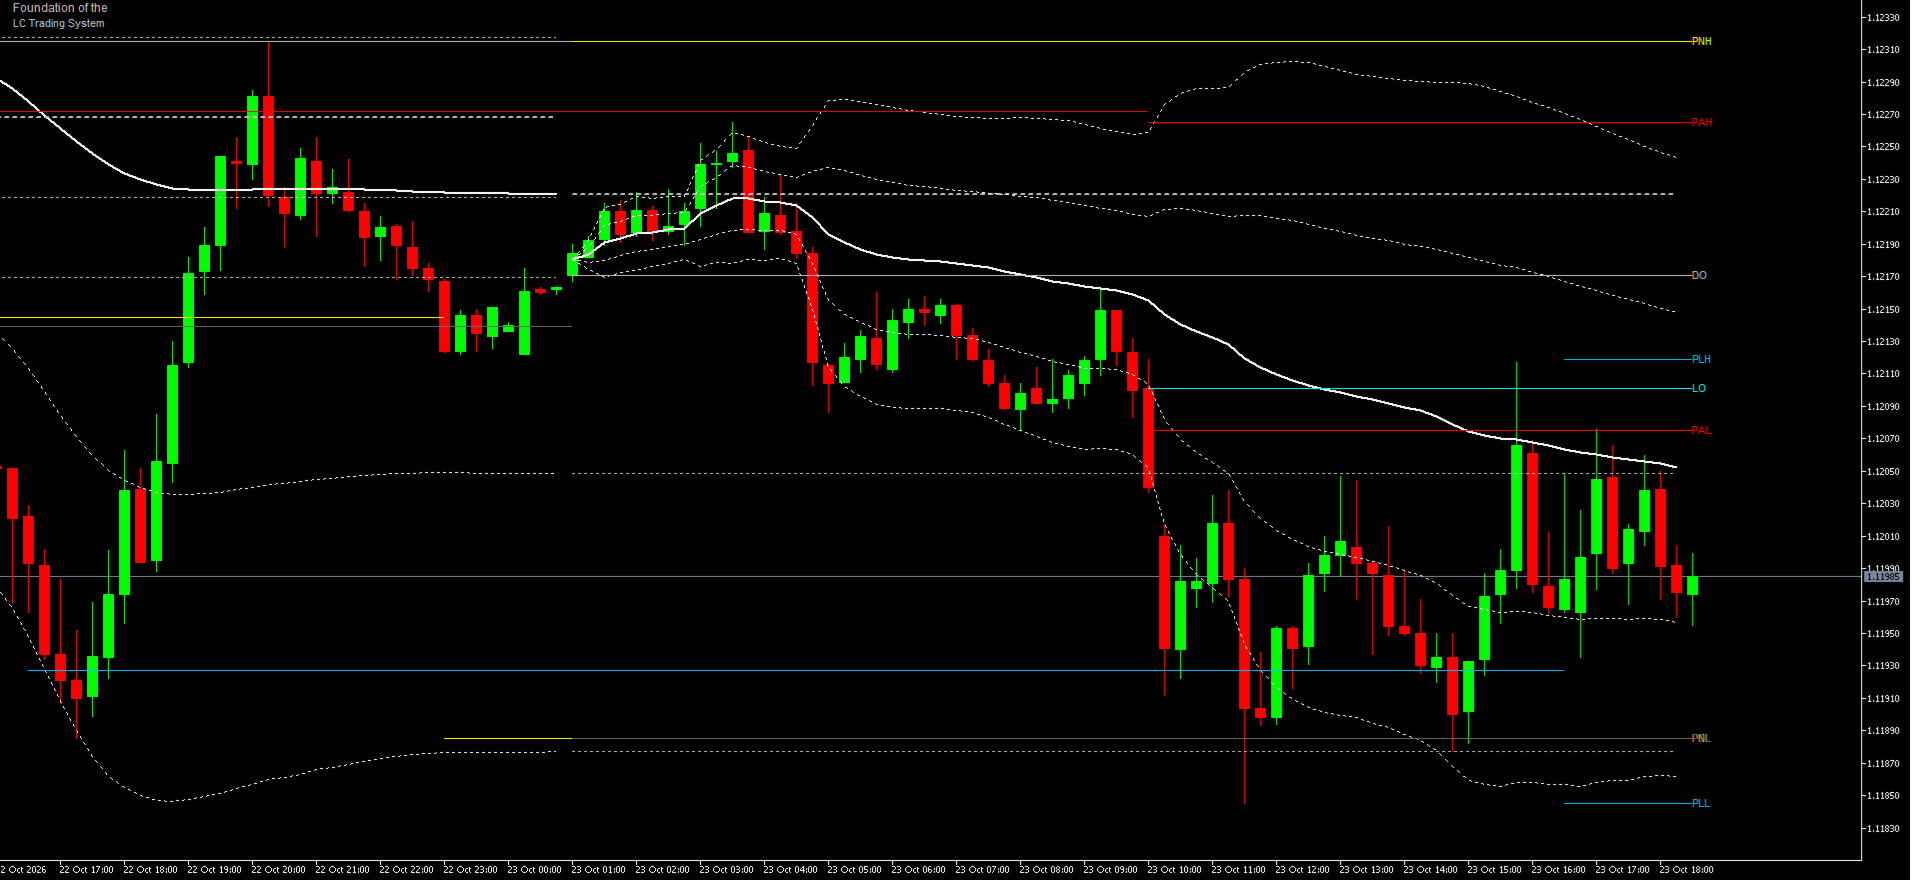
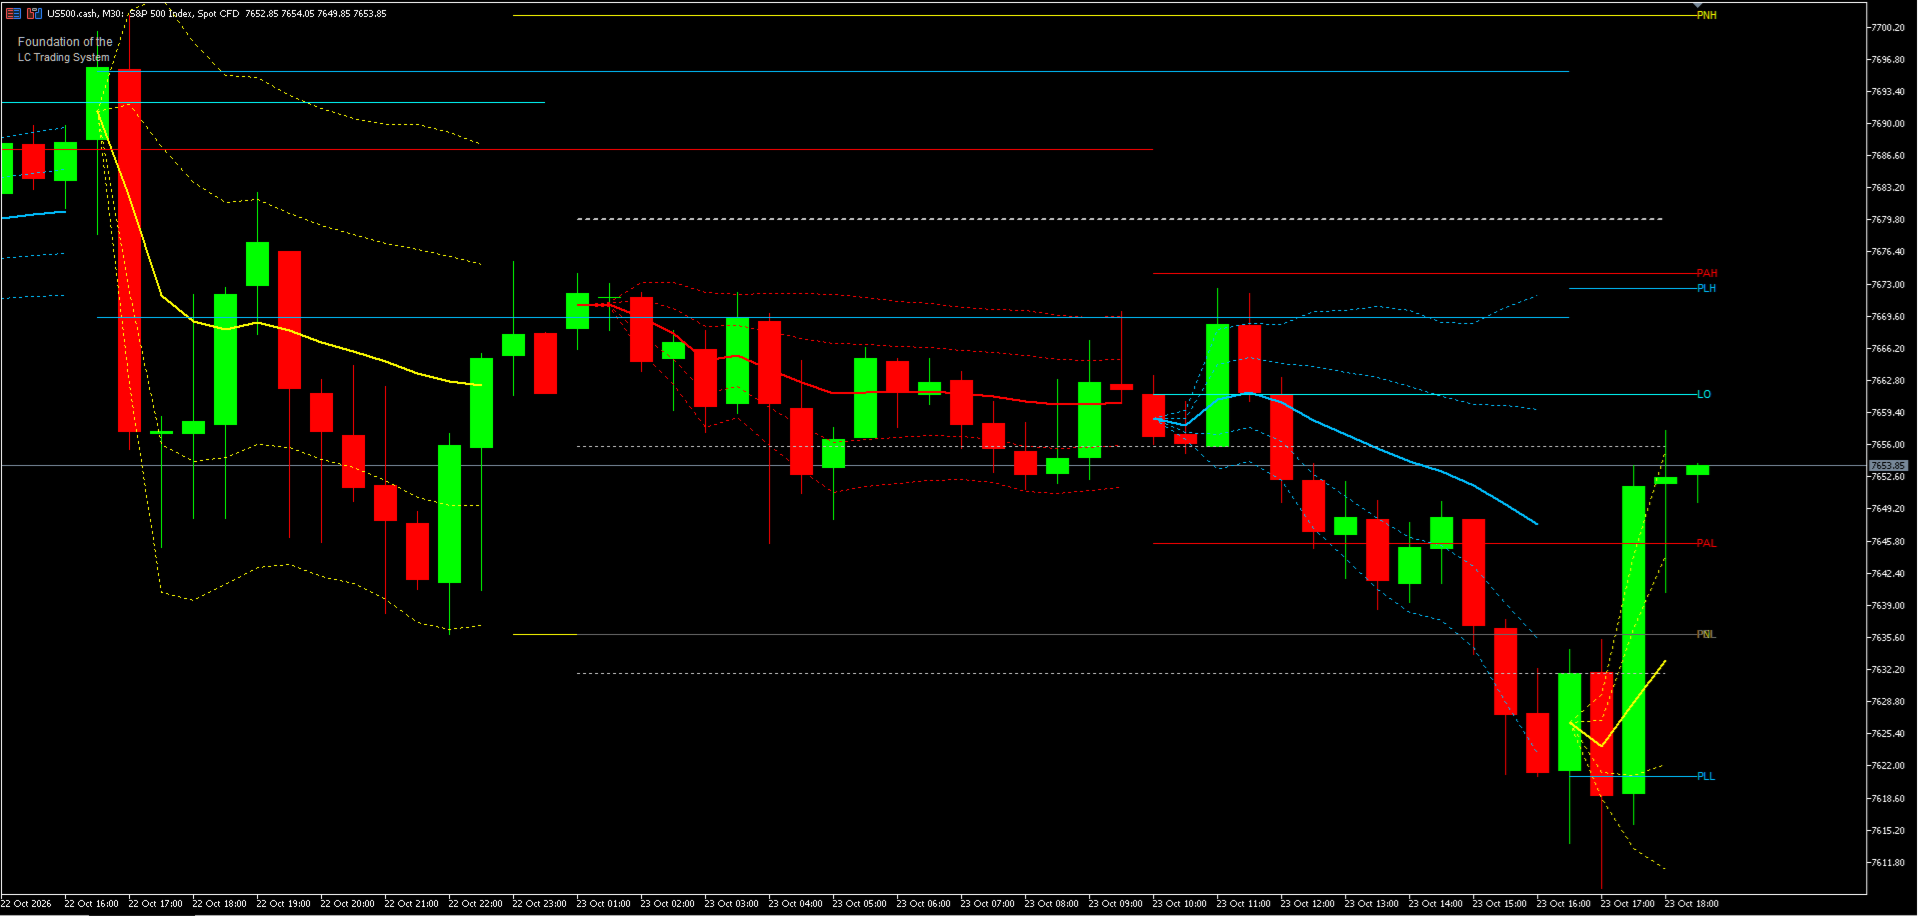
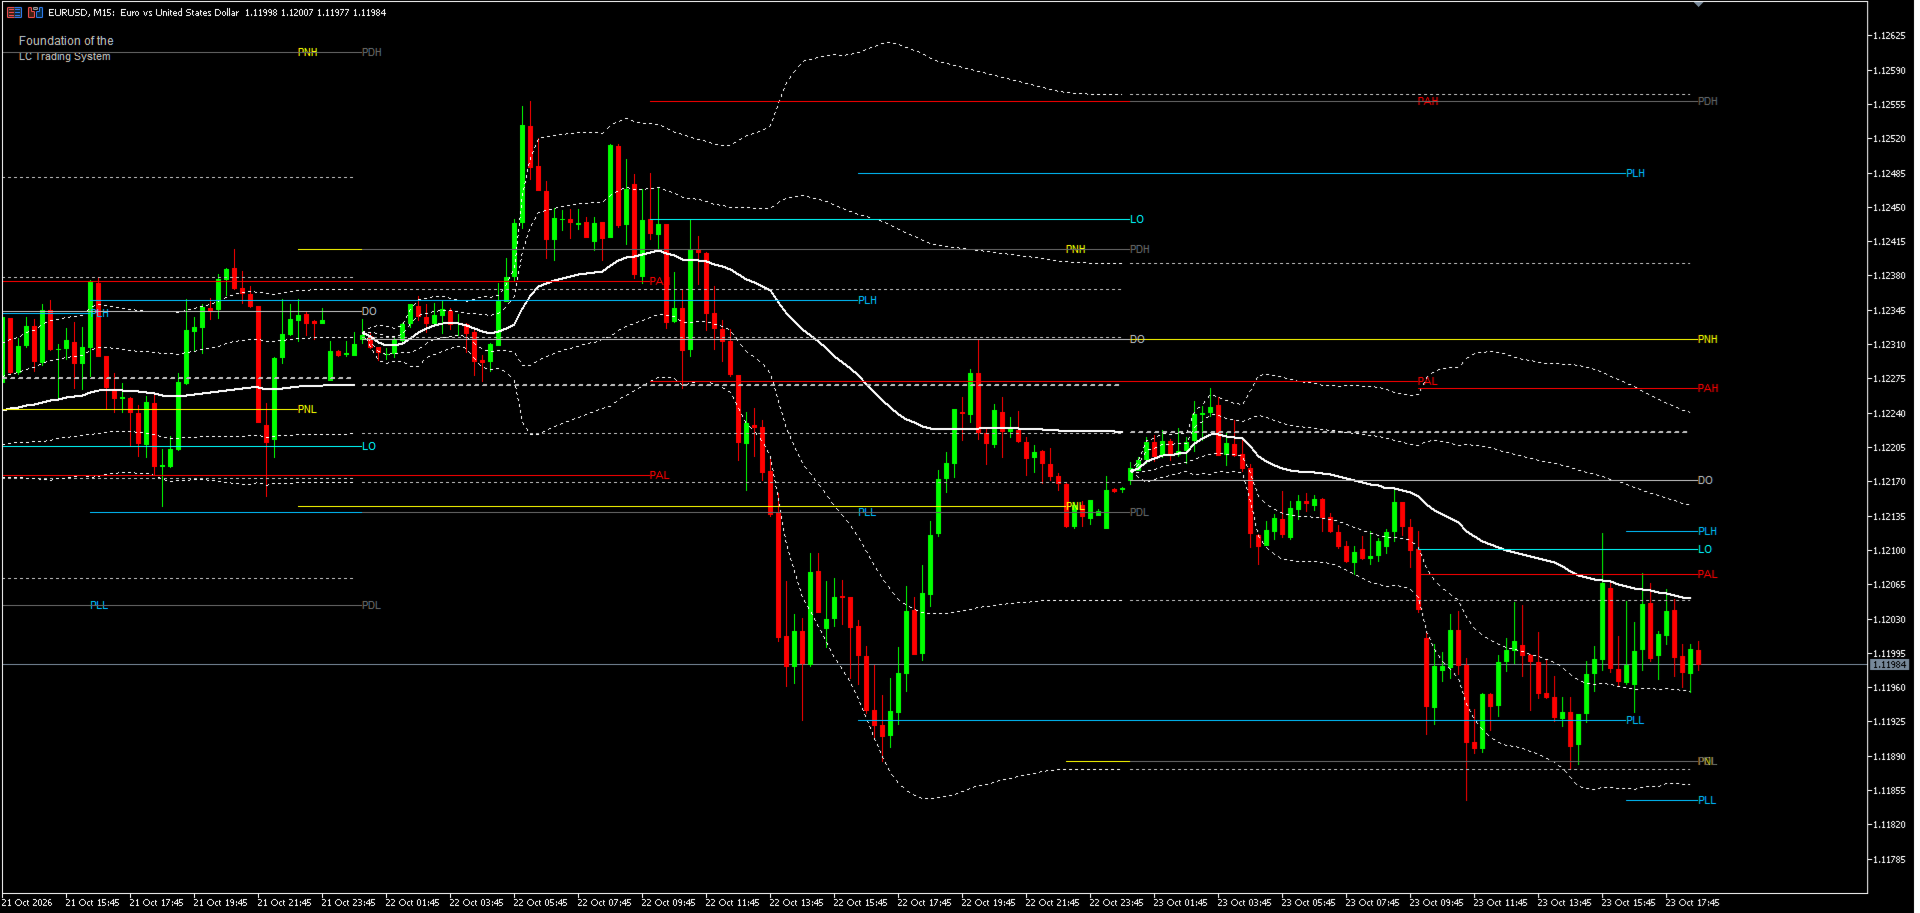
LC Multi Session VWAP is a technical analysis indicator for MetaTrader 5 that displays session-based Volume Weighted Average Prices (VWAP), Sigma Bands, daily VWAP references, previous-day and previous-session price levels, and global trading sessions directly on the price chart.

The indicator combines multiple independent visualization options to provide a structured view of intraday price activity.

Individual features can be enabled or disabled to suit different trading instruments, timeframes, and chart layouts.

Session VWAP and Daily VWAP

The indicator provides separate VWAP calculations for the following trading sessions:

  • Asia VWAP
  • London VWAP
  • New York VWAP

In addition to the individual session VWAPs, the indicator supports:

  • Running Daily VWAP - the VWAP of the current trading day
  • Previous-Day VWAP - a VWAP reference from the completed trading day

Each VWAP line can be enabled or disabled individually.

These references allow traders to observe price behavior relative to the volume-weighted average of different trading periods.

Sigma Bands

Optional Sigma Bands visualize price deviations around the VWAP.

Available settings include:

  • +1 and -1 Sigma Bands
  • +2 and -2 Sigma Bands

The two band groups can be enabled independently.

Sigma Bands can help visualize changes in price dispersion, expansion, and contraction around a VWAP reference.

Previous Day and Session Reference Levels

LC Multi Session VWAP includes horizontal reference lines derived from completed trading periods.

The available levels are:

  • PDH / PDL - Previous Day High and Low
  • PAH / PAL - Previous Asia Session High and Low
  • PLH / PLL - Previous London Session High and Low
  • PNH / PNL - Previous New York Session High and Low

Each level group can be displayed individually.

Optional labels identify the reference levels directly on the chart. Historical labels can also be displayed for older trading days.

These levels provide reference points for comparing current price activity with previously established trading ranges.

Daily Open and London Open

Two additional opening-price references are available:

  • DO - Daily Open
  • LO - London Open

The London Open reference uses 08:00 London local time.

Both opening-price lines can be displayed independently, with optional labels and historical visualization.

A7 Asia Reference Window

The A7 Asia reference window provides additional high and low levels derived from the indicator's underlying session calculations.

Available display features include:

  • A7 Asia High (AsiaH)
  • A7 Asia Low (AsiaL)
  • Optional high and low labels
  • Optional background shading of the A7 Asia window

The A7 window is defined by the underlying Core time model. The input settings control the visibility of its lines, labels, and background shading.

The displayed A7 levels are analytical references, not automatic trading signals.

Trading Session Shading

Optional background shading distinguishes trading periods visually.

Supported shading includes:

  • A7 Asia reference window
  • Tokyo trading hours
  • London trading hours
  • New York trading hours

Tokyo, London, and New York shading can be controlled separately.

Additional color settings are provided for overlapping session areas, making simultaneous trading periods easier to distinguish.

Session-start vertical lines are also available as an independent visualization option.

Chart Configuration and Historical Display

The indicator provides options for controlling how much historical information appears on the chart.

Separate history settings are available for session reference levels, background shading, and opening-price lines.

Users can combine VWAP lines, Sigma Bands, reference levels, and session shading according to their preferred chart layout.

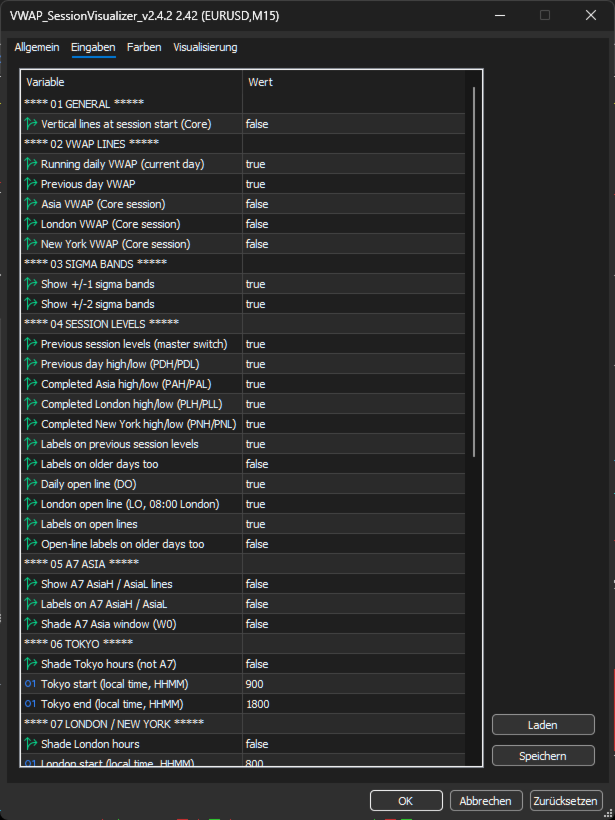
Complete Input Reference

Version 2.42 provides 49 configurable inputs organized into 10 groups.

All input descriptions are in English and are available directly in the MetaTrader 5 indicator settings.

The following reference explains the function of each input.

01 GENERAL

This group contains general chart visualization settings.

  • Vertical lines at session start (Core): Enables or disables vertical reference lines marking the session start times defined by the underlying Core.

02 VWAP LINES

This group controls which VWAP calculations are displayed on the chart.

  • Running daily VWAP (current day): Displays the running VWAP for the current trading day.
  • Previous day VWAP: Displays the VWAP reference from the previous completed trading day.
  • Asia VWAP (Core session): Displays the VWAP calculated for the Asia session.
  • London VWAP (Core session): Displays the VWAP calculated for the London session.
  • New York VWAP (Core session): Displays the VWAP calculated for the New York session.

Each VWAP can be enabled or disabled independently, allowing a chart to show only the required references.

03 SIGMA BANDS

This group controls the visibility of VWAP deviation bands.

  • Show +/-1 sigma bands: Displays the first positive and negative Sigma Bands.
  • Show +/-2 sigma bands: Displays the second positive and negative Sigma Bands.

The first and second band groups can be controlled independently.

04 SESSION LEVELS

This group controls historical session reference lines and opening-price levels.

  • Previous session levels (master switch): Master visibility control for the previous-session reference levels.
  • Previous day high/low (PDH/PDL): Displays the previous trading day's high and low.
  • Completed Asia high/low (PAH/PAL): Displays the high and low of the completed Asia session.
  • Completed London high/low (PLH/PLL): Displays the high and low of the completed London session.
  • Completed New York high/low (PNH/PNL): Displays the high and low of the completed New York session.
  • Labels on previous session levels: Displays identifying labels beside previous-session reference lines.
  • Labels on older days too: Extends the reference-level labels to older historical days.
  • Daily open line (DO): Displays the daily opening-price reference.
  • London open line (LO, 08:00 London): Displays the opening-price reference for 08:00 London local time.
  • Labels on open lines: Displays labels for the Daily Open and London Open lines.
  • Open-line labels on older days too: Extends opening-line labels to older historical days.

Individual level groups can be selected to reduce the number of lines displayed simultaneously.

05 A7 ASIA

This group controls the visualization of the A7 Asia reference window.

  • Show A7 AsiaH / AsiaL lines: Displays the high and low reference lines of the A7 Asia window.
  • Labels on A7 AsiaH / AsiaL: Displays identifying labels for the A7 Asia reference levels.
  • Shade A7 Asia window (W0): Enables or disables background shading of the A7 Asia reference window.

These settings control visualization. They do not change the underlying Core-defined A7 time window.

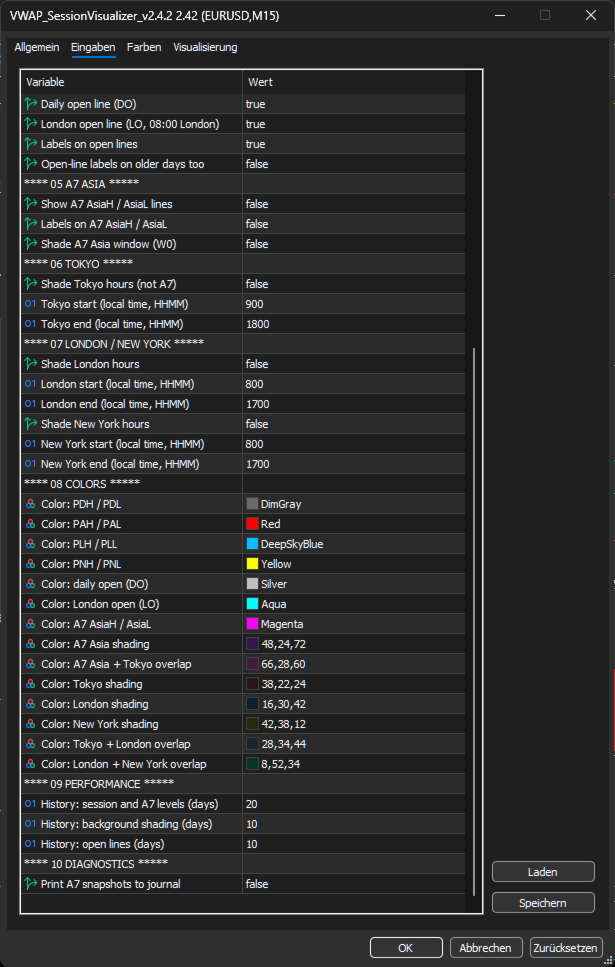
06 TOKYO

This group controls Tokyo session shading and its time boundaries.

  • Shade Tokyo hours (not A7): Enables or disables Tokyo trading-hour shading. This is separate from A7 Asia shading.
  • Tokyo start (local time, HHMM): Defines the start of the Tokyo shading period in Tokyo local time.
  • Tokyo end (local time, HHMM): Defines the end of the Tokyo shading period in Tokyo local time.

Times use the HHMM format. For example, 0900 represents 09:00.

07 LONDON / NEW YORK

This group controls the optional background shading of the London and New York trading periods.

  • Shade London hours: Enables or disables London trading-hour shading.
  • London start (local time, HHMM): Defines the beginning of the London shading period in London local time.
  • London end (local time, HHMM): Defines the end of the London shading period in London local time.
  • Shade New York hours: Enables or disables New York trading-hour shading.
  • New York start (local time, HHMM): Defines the beginning of the New York shading period in New York local time.
  • New York end (local time, HHMM): Defines the end of the New York shading period in New York local time.

The shading periods are configurable display windows. They should not be confused with the Core-defined session boundaries used for VWAP calculations.

08 COLORS

This group provides individual color settings for reference levels, opening prices, session shading, and overlapping session areas.

  • Color: PDH / PDL: Sets the color of Previous Day High and Low lines.
  • Color: PAH / PAL: Sets the color of Previous Asia High and Low lines.
  • Color: PLH / PLL: Sets the color of Previous London High and Low lines.
  • Color: PNH / PNL: Sets the color of Previous New York High and Low lines.
  • Color: Daily open (DO): Sets the color of the Daily Open reference line.
  • Color: London open (LO): Sets the color of the London Open reference line.
  • Color: A7 AsiaH / AsiaL: Sets the color of A7 Asia High and Low reference lines.
  • Color: A7 Asia shading: Sets the background color of the A7 Asia reference window.
  • Color: A7 Asia + Tokyo overlap: Sets the color used when the A7 Asia and Tokyo shading windows overlap.
  • Color: Tokyo shading: Sets the Tokyo session background color.
  • Color: London shading: Sets the London session background color.
  • Color: New York shading: Sets the New York session background color.
  • Color: Tokyo + London overlap: Sets the background color where Tokyo and London shading periods overlap.
  • Color: London + New York overlap: Sets the background color where London and New York shading periods overlap.

These settings allow reference lines and trading periods to be visually distinguished without changing the underlying calculations.

09 PERFORMANCE

This group controls how many days of historical visualization are retained.

  • History: session and A7 levels (days): Sets the historical display period for session reference levels and A7 levels.
  • History: background shading (days): Sets how many historical days of session background shading are displayed.
  • History: open lines (days): Sets how many historical days of opening-price reference lines are displayed.

Reducing historical display periods can help keep the chart less crowded.

10 DIAGNOSTICS

This group contains optional diagnostic output.

  • Print A7 snapshots to journal: Enables diagnostic journal messages for A7 reference snapshots. This setting is intended for troubleshooting and is not required for normal chart visualization.

Supported Instruments and Broker Time

The indicator has been used with EURUSD and US500.cash market data from FTMO.

Correct historical session assignment depends on the broker's server-time configuration.

Important broker-time requirement:

The current version uses a server-time model with UTC+2 during winter and UTC+3 during US daylight saving time.

Trading-session calculations use New York time and its daylight-saving rules. London-related references use UK daylight-saving conventions where applicable.

Brokers using different server-time models, including fixed UTC offsets or European daylight-saving schedules, are not currently supported for historically correct session assignment.

The indicator does not automatically detect or adjust to other broker server-time models.

Users should verify that their broker follows the supported convention before relying on historical session boundaries and VWAP reset times.

Version 2.42 Improvements

Version 2.42 includes the improvements introduced since version 2.20.

  • Added A7 Asia High and Low reference lines and optional labels.
  • Added optional shading for the A7 Asia reference window.
  • Added separate Tokyo session shading.
  • Reorganized the input settings into 10 clearly structured groups.
  • Improved the readability of the input dialog.
  • Removed seven unused settings.

Existing features such as the Daily VWAP, Previous-Day VWAP, session VWAPs, Sigma Bands, previous-session levels, and opening-price references remain available.

Update note: Some settings have been removed or reordered. Please review saved presets and chart templates after updating.

Specialized Indicators for a Clearer Chart

To keep charts clear and easy to read, the LC visualization tools are organized into separate, complementary indicators.

LC Multi Session VWAP focuses on daily and session VWAPs, Sigma Bands, previous-day and previous-session reference levels, and trading-session visualization.

Multi-timeframe Break of Structure (BOS), Change of Character (CHoCH), confirmed swing points, and Fair Value Gaps are provided by our separate indicator LC Reference Level Structure Visualizer.

A third indicator is currently under development. It is planned to include Liquidity Sweeps and Reclaims, Equal Highs/Lows, Micro-BOS, and additional market structure and reference markers.

This separation is intended to reduce chart clutter while allowing traders to combine the analytical tools they need.

Summary

LC Multi Session VWAP combines the Running Daily VWAP, Previous-Day VWAP, and separate Asia, London, and New York session VWAPs with optional Sigma Bands, previous-day and previous-session reference levels, Daily Open and London Open prices, and configurable session visualization.

The A7 Asia reference window and optional Tokyo, London, and New York shading provide additional visual context for intraday market observation.

With 49 configurable inputs organized into 10 groups, users can select the information they want to display while maintaining a structured chart layout.

The indicator is a chart analysis tool. It does not execute trades or provide automatic buy and sell signals. All trading decisions remain the responsibility of the user.
Recommended products
IBI Vwap
Brahim Eljaziri
IBI Vwap draws the Volume-Weighted Average Price calculated on the real volume of the exchange , with ±1 and ±2 standard-deviation bands. What you see VWAP : the average price paid by all participants since the session start, weighted by real traded volume. Institutions use it as a benchmark: above it buyers are in control, below it sellers are. ±1 and ±2 standard-deviation bands : how far price stretches from its average. The ±2 band marks an extension zone. Short labels on the right: VWAP (wit
FREE
Weis Waves is a technical indicator developed by David Weis, inspired by Richard Wyckoff’s principles. Unlike traditional volume, which is shown bar by bar, Weis Waves accumulates volume into bullish or bearish “waves,” restarting the count whenever price changes direction. This method allows traders to clearly see the true strength of market moves , as each wave reflects the intensity of the volume behind a sequence of candles. Key features: Groups volume into buying and selling waves. Highl
FREE
The Volume Weighted ATR indicator is a helpful tool for measuring market activity. It is based on the idea of the Volume-Weighted ATR. Combining these two elements helps identify potential turning points or breakout opportunities. The indicator for the classification of the activity of the market uses the moving average and its multiples. Accordingly, where the VWATR bar is located (relative to the moving average), it is labelled as ultra-low, low, average, high, very high or ultra high. The Vo
FREE
HTF Candles Nika overlays full-size candles from any higher timeframe directly onto your current chart in MetaTrader 5. It gives you a clear multi-timeframe view without leaving your chart. Key Features - Draws higher timeframe candles as filled rectangles with wicks on the current chart - Supports standard candlestick and Heiken Ashi display modes - Live countdown timer showing time remaining until the current HTF candle closes - Customizable colors for bullish and bearish candles - Auto or m
FREE
Stackable VWAP
Flavio Javier Jarabeck
3.5 (4)
Volume Weighted Average Price (VWAP) is a trading benchmark commonly used by Big Players that gives the average price a Symbol has traded throughout the day. It is based on both Volume and price. Additionally we put in this indicator the MVWAP (Moving Volume Weighted Average Price). For those who do not know the usage and the importance od this indicator I recommend a great article about this subject at Investopedia ( https://www.investopedia.com/articles/trading/11/trading-with-vwap-mvwap.asp
FREE
Daily VWAP
Riccardo Moreo
4.8 (5)
This is the Volume Avarage Weighted Price (VWAP) it's a indicator that shows where is the avarage of the current volumes and the levels at which the price is considered premium, above the second upper band, or discount, under the second lower band, it's also very usefull to use the VWAP level as a target for operations since it's a very liquid level so the price it's attracted to it. feel free to leave a feedback either positive or negative based on your expereince with this indicator, enjoy the
FREE
Macro-R Pro Signal — Advanced Trading Signal Indicator Macro-R Pro Signal is a professional trading indicator designed to deliver high-quality BUY and SELL signals with enhanced precision and reduced market noise. By combining Bollinger Bands, RSI, and adaptive volatility filtering , this indicator helps traders identify high-probability reversal points while avoiding unfavorable market conditions. How the Strategy Works This indicator is built on a mean reversion + momentum confirmation concep
FREE
Volume-to-Price Movement Oscillator (VP Oscillator) for MT5 The VP Oscillator highlights the balance (or imbalance) between trading volume and price movement, helping traders spot hidden accumulation, distribution, or weakening trends. How It Works: Calculates each bar’s price range (High–Low) and tick volume. Normalizes both values over a set period (default: 14). Plots the absolute difference between them ×100 — showing how closely price action aligns with trading activity. Interpretation: Hig
FREE
VWAP Indicator
LUC JACOBUS A VERHEECKE
4.14 (28)
Volume Weighted Average Price (VWAP) The volume weighted average price (VWAP) is a  trading   benchmark  used by traders that gives the average price a security has traded at throughout the day, based on both volume and price. It is important because it provides traders with insight into both the trend and value of a security. This indicator VWAP V2 is free and is the manual version of the extended Easy VWAP indicator (30 Euro), where the date and time properties are automatically entered. With
FREE
VWAP and MVWAP
Flavio Javier Jarabeck
4 (9)
Volume Weighted Average Price (VWAP) is a trading benchmark commonly used by Big Players that gives the average price a Symbol has traded throughout the day. It is based on both Volume and price. Additionally we put in this indicator the MVWAP (Moving Volume Weighted Average Price). For those who do not know the usage and the importance od this indicator I recommend a great article about this subject at Investopedia ( https://www.investopedia.com/articles/trading/11/trading-with-vwap-mvwap.asp )
FREE
Basic Vwap
james mugendi
4 (1)
Simple Vwap with the daily, weekly and monthly VWAP is the abbreviation for   volume-weighted average price , which is a technical analysis tool that shows the ratio of an asset's price to its total trade volume. It provides traders and investors with a measure of the average price at which a stock is traded over a given period of time. How it's used Identify entry and exit points:   Traders can use VWAP to determine when to buy or sell an asset.   Understand price trends :  Traders can use V
FREE
DS RVOL: The Relative Volume Indicator for MT5 RVOL is a straightforward Relative Volume (RVOL) indicator for MetaTrader 5. It shows you how current volume compares to a historical average, providing a quick way to gauge the strength of a price move. How it Works Relative Volume is a simple ratio: R V O L = C u rre n t V o l u m e ​/ A v er a g e H i s t or i c a l V o l u m e RVOL > 1.0 : Volume is higher than usual. This suggests there's strong interest and potential for a sustained move. RVOL
FREE
AvgVolumes
Marco Montemari
5 (1)
This indicator is based on Volumes standard indicator, calculates the average of Volumes based on the last N bars set by users, and if the value of the volume is bigger then a set % respect the average a different color will be used. The indicator is shown in a separate indicator window. This version has now a limitation in setting the % about the threshold. If you are interested to set threshold consider to buy the PRO version ( https://www.mql5.com/en/market/product/35925 ) If you want to use
FREE
Fair Value Gap Zone
Mattia Impicciatore
General Description The Fair Gap Value Indicator identifies and highlights “fair value gaps” on the MetaTrader 5 chart. A fair gap occurs when a price void forms between the low of one bar and the high of another, separated by an intermediate bar. The indicator draws colored rectangles (bullish and bearish) to emphasize these areas, providing clear visual support for price-action strategies. Key Features Bullish Gap Detection : highlights gaps between a bar’s low and the high of two bars prior w
FREE
Overview Experience professional-grade order flow analysis with the Anchored Volume Profile , an ultra-lightweight, high-performance volume distribution indicator designed exclusively for MetaTrader 5. Built from the ground up using raw memory canvas mechanics, this indicator eliminates the massive CPU lag, UI flickering, and chart freezing commonly associated with standard rectangle-object profiles. By processing native terminal tick volume into directional matrices, this tool provides a visu
FREE
MW Volume
Martin Bittencourt
3.8 (5)
The Martinware Volume indicator plots a colored moving average over volume bars. The coloring uses three colors and can be done in different ways choosable by the user and is applied both to the average as to the volume bars. Three types of coloring are possible: None: no coloring is done Increasing or decreasing: changes the color depending on the current value being bigger or lesser than the previous one Volume relative to average: colors vary if the current volume is bigger or lesser then
FREE
Onyx FVG Pro
Thirawut Detbangoon
Onyx FVG Pro Smart Market Structure & Fair Value Gap Trading System for MetaTrader 5 1. Market Structure Detection Engine Automatically identifies key market structure shifts including CHoCH (Change of Character) and BOS (Break of Structure) using advanced Swing High/Low logic to ensure you always trade in alignment with the dominant trend. 2. Dynamic FVG Detection (Auto-Mitigation) Scans and draws high-probability Fair Value Gap zones in real time based on customizable minimum point
FREE
Frato Vwap Bands
Francisco Felipe Alves Da Silva Rocha
Frato VWAP Bands — Volume Weighted Average Price with Standard Deviation Frato VWAP Bands is an indicator that combines the traditional VWAP with dynamic volatility bands. It offers a multi-period view of the volume-weighted average price. Main Functionality: The indicator calculates the VWAP (Volume Weighted Average Price) and plots up to 3 upper and lower bands based on the standard deviation. The calculation is reset at the beginning of each new selected period (Hourly, H4, Daily, Weekly,
FREE
VWAP Level MT5
Francesco Lenza
4.5 (2)
The VWAP Level indicator is a technical analysis tool that calculates the weighted average price for the traded volumes of a specific asset. The VWAP provides traders and investors with the average price of an asset over a specific time frame. It is commonly used by investors to compare data on "passive" trading operations, such as pension funds and mutual funds, but also by traders who want to check if an asset has been bought or sold at a good market price. To calculate the VWAP level we us
FREE
MIDAS Super VWAP
Flavio Javier Jarabeck
4.27 (11)
Imagine VWAP, MVWAP and MIDAS in one place... Well, you found it! Now you can track the movement of Big Players in various ways, as they in general pursue the benchmarks related to this measuring, gauging if they had good execution or poor execution on their orders. Traders and analysts use the VWAP to eliminate the noise that occurs throughout the day, so they can measure what prices buyers and sellers are really trading. VWAP gives traders insight into how a stock trades for that day and deter
FREE
Midas VWAP
Paulo Henrique Faquineli Garcia
4 (2)
Volume Weighted Average Price (VWAP) is a trading benchmark commonly used by Big Players that gives the average price a Symbol has traded throughout the day. It is based on both Volume and price. This indicator contains Daily VWAP and MIDAS' VWAP, which means you are able to anchor the beggining of MIDAS' calculations and, therefore you will be able to use this methodology to study price versus volume moves after anchor point. You will be able to anchor up to 3 HIGH MIDAS VWAP's and 3 LOW. Wish
FREE
Volume By Color RSJ paints the volume bar in a darker color when the traded volume is above its own moving average, so candles with unusual activity stand out. An optional four-color mode shows the strength of each candle's volume in steps. By default the indicator compares each bar with the 20-period simple average of the volume. The average type and period can be changed in the inputs. How to use The colored bars make it easy to spot breakouts, rejections and climax candles that happen with vo
FREE
VWAP + Volume Profile Combined Indicator FREE Launch Offer OVERVIEW Professional combination of VWAP (Volume Weighted Average Price)  and Volume Profile in a single MT5 indicator. This powerful tool  combines two of the most respected institutional trading tools  into one seamless display. KEY FEATURES 1. VWAP with 6 calculation modes 2. Volume Profile with Value Area analysis 3. Point of Control identification 4. Standard deviation bands 5. Dynamic color changing 6. Separate buy/sell vol
FREE
Value Chart Candlesticks
Flavio Javier Jarabeck
4.57 (14)
The idea of a Value Chart indicator was presented in the very good book I read back in 2020 , " Dynamic Trading Indicators: Winning with Value Charts and Price Action Profile ", from the authors Mark Helweg and David Stendahl. The idea is simple and the result is pure genius: Present candlestick Price analysis in a detrended way! HOW TO READ THIS INDICATOR Look for Overbought and Oversold levels. Of course, you will need to test the settings a lot to find the "correct" one for your approach. It
FREE
World Time Display
Mohd Firuz Fahmi Bin Yusoff
The best and the only World Time Display for MT5 Features : - JAPAN, LONDON & NEW YORK Time Display - You can customize with different Font, Color And Text Size - You can customize Box Position and Box Color to meet your satisfaction - Only For Metatrader 5 - Customize GMT according to your Time Zone - Simple To Use. Just Attach to your MT5 - No hidden code or no errors
FREE
Phoenix Measured Box
Nigel Nii Darku Narnor Darko
PHOENIX MEASURED BOX DASHBOARD, engineered specifically for Phoenix Au Trading to provide "No dreams, just the tools" for high-precision institutional-style trading. 1. THE INDICATOR DEFINITION The Phoenix Measured Box is a multi-dimensional analysis tool designed for SMC (Smart Money Concepts) and ICT-style traders. It combines time-segmented price action with real-time volume metrics and automated target projections. Key Components: 15m Range Boxes: Automatically identifies and boxes every 15
FREE
THV Daily VWAP MT5 – Daily Volume Weighted Average Price THV Daily VWAP MT5 is a technical indicator designed to display the Daily Volume Weighted Average Price (VWAP) directly on your MetaTrader 5 chart. Unlike traditional VWAP indicators that may only display limited session data or reset at specific trading sessions, this indicator plots a continuous VWAP line throughout the trading day, making it easy to observe how price behaves relative to the daily volume-weighted average price. The VWAP
LM Volume Profile MT5 LM Volume Profile MT5 displays the distribution of calculated volume across price levels directly on the MetaTrader 5 chart. The indicator divides the selected price range into configurable price rows and displays the volume distribution as a horizontal histogram. It also calculates the Point of Control, Value Area High, Value Area Low, average profile price, and optional VWAP reference. Four profile modes are available: - Visible Range - Fixed Range - Session - Daily
FREE
Aggression Volume
Flavio Javier Jarabeck
4.29 (17)
Aggression Volume Indicator is the kind of indicator that is rarely found in the MQL5 community because it is not based on the standard Volume data provided by the Metatrader 5 platform. It requires the scrutiny of all traffic Ticks requested on the platform... That said, Aggression Volume indicator requests all Tick Data from your Broker and processes it to build a very special version of a Volume Indicator, where Buyers and Sellers aggressions are plotted in a form of Histogram. Additionally,
FREE
KS Volume Bar Color Pro is a  MQL5 indicator for MetaTrader 5 that visually highlights candles with volume-weighted logic. Core Concept It detects market structure using a classic 3-candle pattern: The indicator  colors the middle candle (the displacement bar) using native DRAW_COLOR_CANDLES . This technique ensures perfect alignment with the actual price candles, just like volume-profile tools. Key Features 1. Volume-Weighted FVG Coloring Compares the displacement bar’s volume against a moving
FREE
Buyers of this product also purchase
Trend Sniper X
Sarvarbek Abduvoxobov
4.87 (46)
Trend Sniper X is a multi-timeframe trend-following indicator for MetaTrader 5 that helps traders identify trend direction and potential reversal points with clarity and precision. for MT4: https://www.mql5.com/en/market/product/193245 Price Information: The current price is promotional and is subject to change as upcoming updates and new features are released. Bonus Offer: To get the FREE Auto-Trade Assistant EA for this indicator, please message the author after purchasing. Code2Profit Channe
Smart Trend Trading System — MetaTrader 5 Message me on MQL5 after purchase to receive Smart Universal Expert Advisor for FREE, plus the online course, PDF manual, and private group access. STTS brings trend direction, entry and exit signals, reversal zones, and important price levels together on your chart. Follow the system manually, or connect a separate compatible EA for automated execution using your chosen settings. ONE SYSTEM. FOUR TRADING APPROACHES. STTS organizes its trading approaches
A new King in town - Indicator + Order management indications(tp1+tp2+tp3) + Optional Telegram Signal sender   INCLUDED (FREE) + Bonus EA Robot ( FULL TRADING  and SIGNAL SYSTEM ) Our best EA for Gold: Gold Slayer TRY > Reversion Queen  Expert advisor >JOIN Community Channel < NEW Free Automation EA link < click here ( disclaimer: this is new and still on testing and phase , use at your risk on demo) Free Telegram Bridge < click here  This indicator includes an advanced Strategy, a trading sys
Entry Points Pro shows you where to enter, where to put the stop and what lot to trade — before you place the order. PRICE Now 199 USD: 4 copies at this price, then 249 USD. The final price is 349 USD. I make my money trading the markets, and I show it, so I don't need to sell this indicator to everyone. It is a tool for traders who think for themselves, not a magic button. No breakout, no trade. A gray arrow is a cancelled signal: price did not break the signal candle, so there was no entry
SuperScalp Pro
Van Minh Nguyen
4.54 (37)
SuperScalp Pro - Professional Multi-Layer Confluence Scalping System SuperScalp Pro is an advanced scalping indicator that upgrades the classic Supertrend with multiple intelligent confirmation filters. It helps you identify higher-probability Buy/Sell opportunities while significantly reducing false signals. Clear Buy and Sell arrows appear directly on the chart, along with automatic ATR-based Stop Loss and Take Profit levels calculated in real time. After purchase, please message me on MQL5 to
Gann Made Easy   is a professional and easy to use Forex trading system which is based on the best principles of trading using the theory of W.D. Gann. The indicator provides accurate BUY and SELL signals including Stop Loss and Take Profit levels. You can trade even on the go using PUSH notifications. PLEASE CONTACT ME AFTER PURCHASE TO GET TRADING  INSTRUCTIONS   AND GREAT EXTRA INDICATORS  FOR FREE! Probably you already heard about the Gann trading methods before. Usually the Gann theory is a
M5 Sniper
MeanFX
5 (4)
Get your trading edge in the line of sight M5 Sniper   is a new indicator by MeanFX. It combines   precise trading signals   with   adaptive TP/SL levels   - creating best possible statistical trades as a result! The price increases every 5 purchases, the next price is 79$ Message me after purchase to receive tips/guide and bonus EA plus trading methodology Auto Optimisation only works on LIVE chart , needs data feed >JOIN Community Channel < What makes it stand out?   Proven statistical per
SMC Intraday Formula
VividMind Digital Solutions
5 (26)
Secure the Lowest Price Today. After purchase, contact via   MQL5 inbox   to receive your buyer kit and bonus. Let's be honest first. No indicator will make you profitable on its own. If someone tells you otherwise, they're selling you a dream. Every indicator that shows perfect buy/sell arrows can be made to look flawless — just zoom into the right window of history and screenshot the winners. We won't do that. SMC Intraday Formula is a tool. It reads the market structure for you, maps the hig
Zoryk Gold
Reda El Koutbane
4.68 (22)
discount ends SOON next price 69 $ ZORYK — Advanced XAUUSD Signal System for MetaTrader 5 You know the feeling. You spend time analyzing gold. You wait for the entry. You finally open the trade, and price immediately moves against you. You close too early, move the Stop Loss or hesitate for a few seconds. Then the market reaches the exact destination you originally expected without you. The direction was not always the problem. The real problem was uncertainty. You did not know exactly where th
Ultra Indicator
Ihor Otkydach
5 (1)
ULTRA is a technical indicator that operates on an “all-in-one” basis—it independently analyzes the market, generates trading signals, displays levels for setting stop-loss orders, and suggests when to close trades to lock in profits or minimize losses. In other words, it doesn't matter if you don't know how to analyze the market, determine levels—where to set your stop-loss—or struggle with money management. ULTRA will do all of that for you! BUYER BONUS: After purchasing the ULTRA indicator, s
GoldenX Entry MT5
VividMind Digital Solutions
5 (17)
Price will increase by $20 every 10 buyers to maintain premium value. After purchase, contact via   MQL5 inbox   to receive your buyer kit and bonus. You have probably tested dozens of indicators before. But we are not here to be “just another signals indicator.” Behind GoldenX Entry is intensive research & development focused on building sophisticated algorithms designed to adapt to the real behavior of every instrument — not generic signals recycled everywhere else. From advanced Auto Optim
Currency Strength Wizard   is a very powerful indicator that provides you with all-in-one solution for successful trading. The indicator calculates the power of this or that forex pair using the data of all currencies on multiple time frames. This data is represented in a form of easy to use currency index and currency power lines which you can use to see the power of this or that currency. All you need is attach the indicator to the chart you want to trade and the indicator will show you real s
Gold Trend Coach MT5
Cristhian Alexander Gaibor Cuasquer
4.27 (11)
Non-repainting buy and sell signals for gold (XAUUSD) on MetaTrader 5. Every signal comes with a stop loss and three take profits. A Smart Money Concepts filter with BOS and CHoCH, so you trade with the structure, not against it. A live Mentor on your panel that guides every step from the entry to TP3. And alerts straight to your phone and your own Telegram channel. That is Gold Trend Coach. Never trade alone again. FREE BUYER KIT with your purchase: 1. Telegram Alert Bridge: your signals go to
Auto Optimized SpeedAngle is an institutional-grade momentum vectoring system that eliminates curve-fitting through continuous Walk-Forward Optimization (WFO). Rather than relying on static inputs that degrade when market regimes shift, the indicator dynamically recalibrates its parameters using Out-of-Sample (OOS) validation, ensuring the displayed signals represent genuine statistical edges rather than historical anomalies. By shifting the focus from subjective visual angles to normalized, qua
Boba Analysis Suite
Trade Ready Solutions LLC
5 (2)
Boba Analysis Suite Boba Analysis Suite is an analytical indicator for MetaTrader 5. It brings market structure, relevant price zones and broader market context together in a single chart view. Developed through practical experience as a trader and trading coach, it supports a structured analysis process: assessing market direction, identifying important levels and considering multiple timeframes together. Analysis in Context Individual signals gain meaning through context. Boba Analysis Suite h
FX Power MT5 NG
Daniel Stein
5 (33)
FX Power: Analyze Currency Strength for Smarter Trading Decisions Overview FX Power is your go-to tool for understanding the real strength of currencies and Gold in any market condition. By identifying strong currencies to buy and weak ones to sell, FX Power simplifies trading decisions and uncovers high-probability opportunities. Whether you’re looking to follow trends or anticipate reversals using extreme delta values, this tool adapts seamlessly to your trading style. Don’t just trade—trade
BLACK FRIDAY – 20% OFF Multi Currency Strength and Momentum Indicator MT5 Dynamic Forex28 Navigator is the evolution of our long-time, popular indicators, combining the power of five in one: Advanced Currency Strength28 Indicator (700 reviews) Advanced Currency IMPULSE with ALERT (530 reviews) Currency Strength EXOTICS GOLD Impulse with Alert CS28 Combo Signals (recent Bonus) No need to buy four indicators and stack them on your charts. All of it is merged into one powerful indicator: the streng
M1 Sniper MT5
Oleg Rodin
5 (7)
M1 SNIPER  is an easy to use trading indicator system. It is an arrow indicator which is designed for M1 time frame. The indicator can be used as a standalone system for scalping on M1 time frame and it can be used as a part of your existing trading system. Though this trading system was designed specifically for short-term trading, it still can be helpful for all traders. This trading system can be used with any forex pair and time frame, though lower time frames are recommended from M1 up to M
Atomic Analyst MT5
Issam Kassas
4.51 (65)
Atomic Analyst — MetaTrader 5 Message me on MQL5 after purchase to receive Smart Universal Expert Advisor for FREE, plus the online course, PDF manual, and private group access. Atomic Analyst brings price action, trend direction, entry and exit signals, Stop Loss and multiple Take Profit levels together on your chart. SEE THE SIGNAL. UNDERSTAND THE SETUP. Atomic Analyst organizes its analysis into clear visual information: • Buy and sell arrows to identify potential entries. • Stop Loss and mul
Unix Scalper
Issam Kassas
4 (4)
Unix Scalper — MetaTrader 5 Message me on MQL5 after purchase to receive Smart Universal Expert Advisor for FREE, plus the online course, PDF manual, and private group access. Find the setup. See the plan. Choose how to trade it. UNIX Scalper brings market analysis, BUY/SELL/WAIT decisions and Entry, Stop Loss, TP1 and TP2 levels into one organized panel. SEE THE SIGNAL AND THE PLAN • Clear decisions: BUY, SELL or WAIT. • Defined levels: Entry, Stop Loss, TP1 and TP2. • Multi-timeframe overvie
Smc Pro ToolKit
Talal N Z Aljarusha
5 (13)
SMC PRO TOOLKIT — SMART MONEY ANALYSIS & STRUCTURED TRADE PLANNING SMC Pro ToolKit is a professional Smart Money Concepts analysis workspace for MetaTrader 5. It combines market structure, multi-timeframe analysis, institutional price zones, setup evaluation, confirmation tools, volume context, alerts, and risk planning inside one organized chart environment. One workspace. Multiple layers of confirmation. One structured trading plan. OPEN COMPLETE USER GUIDE MULTI-CONDITION SETUP ENGINE At
Azimuth Pro
Ottaviano De Cicco
5 (7)
Azimuth Pro V2: Synthetic Fractal Structure and Confirmed Entries for MT5 Overview Azimuth Pro is a multi-level swing structure indicator by Merkava Labs . Four nested swing layers, swing-anchored VWAP, ABC pattern detection, three-timeframe structural filtering, and closed-bar confirmed entries — one chart, one workflow from micro-swings to macro-cycles. This is not a blind signal product. It is a structure-first workflow for traders who care about location, context, and timing. 1. What Change
Apex Patterns PRO Buy Indicator - Get Expert Advisor Based on it for FREE. Self-Optimizing Chart Pattern & Breakout Intelligence Traditional pattern scanners rely on fixed inputs, often underperforming when market volatility and structures shift. Apex Patterns PRO is designed to adapt to changing market conditions by combining structural chart pattern recognition, momentum filtering, and statistical self-optimization into one analytical framework. Adaptive Scanning Engine Self-Optimizing Patter
Welcome to Entry In The Zone & SMC Multi Timeframe Entry In The Zone & SMC Multi Timeframe An indicator designed for market analysis based on Smart Money Concepts (SMC), displaying Market Structure, Key Zones (Order Blocks, Supply & Demand Zones, and Fair Value Gaps), Liquidity, and real-time BUY / SELL signals. It supports both Single-Timeframe and Multi-Timeframe analysis, along with the Confluence at Zone feature, which helps you evaluate supporting factors when price enters a key zone. Real-
Divergence Bomber
Ihor Otkydach
4.89 (94)
Each buyer of this indicator also receives the following for free: The custom utility "Bomber Utility", which automatically manages every trade, sets Stop Loss and Take Profit levels, and closes trades according to the rules of this strategy Set files for configuring the indicator for various assets Set files for configuring Bomber Utility in the following modes: "Minimum Risk", "Balanced Risk", and "Wait-and-See Strategy" A step-by-step video manual to help you quickly install, configure, and
Power Candles MT5
Daniel Stein
4.58 (12)
Power Candles - Self-Optimizing Strength Indicator Strength usually lives in a sub-window. The line runs below, the candle above, and your eye keeps connecting the two. Power Candles puts the strength into the candle itself, colored from dark red to dark green, so the chart reads at a glance and the sub-window stays closed. The indicator also finds its own settings for the symbol and timeframe in front of you. One click on [ Apply Best ] draws entry, Stop Loss and Take Profit at the exact prices
Gold Entry Sniper
Tahir Mehmood
5 (23)
Gold Entry Sniper – Professional Multi-Timeframe ATR Dashboard for Gold Scalping & Swing Trading Gold Entry Sniper is a cutting-edge MetaTrader 5 indicator designed to give traders precise buy/sell signals for XAUUSD and other symbols, powered by ATR Trailing Stop logic and a multi-timeframe analysis dashboard . Built for both scalpers and swing traders, it combines real-time market direction , dynamic stop levels , and professional visual dashboards to help you identify high-probability gold en
Gold Sniper Scalper Pro
Ich Khiem Nguyen
3.9 (10)
Gold Sniper Scalper Pro is a MetaTrader 5 indicator built specifically for detecting false breakout patterns on XAUUSD. It identifies the 4-bar trap structure where price breaks a range boundary, draws in breakout traders, then reverses back inside — confirming the move was a false breakout. The indicator scores each setup across 17 quality factors, evaluates it through a 4-layer confluence pipeline, verifies it against a 7-timeframe trend consensus engine, and checks it against a gold volatili
Naked Forex Tweezer Pro Indicator Tweezer Pro Indicator is a pattern recognition indicator for Forex, Stocks, Indices, Futures, Commodities and Cryptos. The standard Tweezer is a two bar pattern. Our enhanced version is a multi-bar pattern. We filter the patterns for you so that you only get the     best and most effective patterns   and ignore the noise. The Tweezer pattern is a simple and effective pattern to trade. The strategy that comes with the Tweezer is based on price action. The Twe
Adaptive Price Action Engine Buy Indicator- Get EA Based on it for FREE. Self-Optimizing Multi-Timeframe Trend & Candlestick Intelligence Markets do not behave the same way all the time—and not every price-action pattern has the same value in every market regime. Adaptive Price Action Engine is designed to adapt to changing market conditions by combining trend structure, multi-timeframe analysis, candlestick patterns, and statistical optimization into one analytical framework. Two Adaptive Mode
More from author
LC Reference Level Structure Visualizer – Version 2.10 MetaTrader 5 (MT5) Market Structure Indicator – BOS, CHoCH, Break of Structure, Change of Character, Fair Value Gaps (FVG), Swing Highs/Lows and Multi-Timeframe Price Action Overview LC Reference Level Structure Visualizer is a multi-timeframe market structure and price action indicator for MetaTrader 5 (MT5) . It displays Break of Structure (BOS) , Change of Character (CHoCH) , confirmed swing highs and swing lows , and Fair Value Gap (FVG)
FREE
Filter:
No reviews
Reply to review