Extended Traders Dynamic Index MT5
- Indicatori
-
Sergey Efimenko
 Ciao a tutti!
Se hai problemi con il mio prodotto contattami, cercherò di aiutarti il prima possibile.
Prova la demo per il tester di strategia, probabilmente troverai un buon assistente per creare la tua strategia di trading.
Cordiali saluti, Sergey! - Versione: 1.8
- Aggiornato: 6 marzo 2024
- Attivazioni: 7
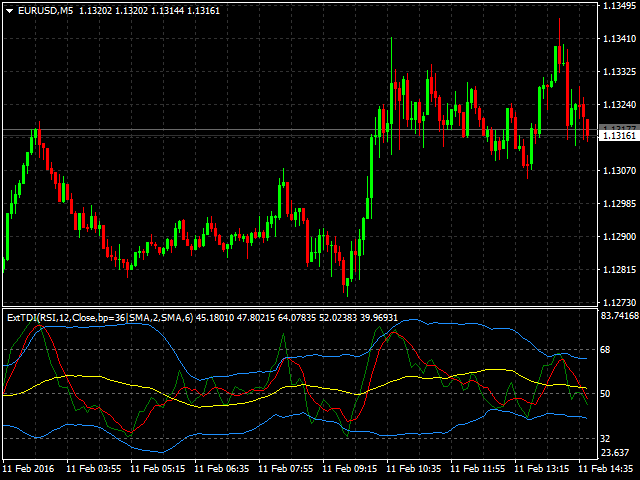
L'indicatore consente di determinare la direzione del prezzo corrente e la volatilità del mercato. Questa versione del Traders Dynamic Index ha eliminato il ridisegno dei dati storici, ottimizzata la velocità di calcolo dell'algoritmo, più parametri esterni per un aggiustamento più preciso e le sue funzionalità estese: aggiunta la selezione dell'oscillatore iniziale e le modalità di smoothing delle medie .
Parametri:
- Mode Osc - stima della selezione dell'oscillatore
- Period Osc - il periodo di calcolo dell'oscillatore utilizzato
- Price Osc - prezzo applicato per il calcolo dell'oscillazione
- Osc volatility bands period - periodo di volatilità dell'oscillatore
- Osc volatility bands multiplier - moltiplicatore di volatilità dell'oscillatore
- Smoothing Osc price line period - periodo di livellamento della linea principale
- Smoothing Osc price line method - metodo di levigatura della linea principale
- Smoothing Osc signal line period - periodo di livellamento della linea di segnale
- Smoothing Osc signal line method - metodo di livellamento della linea di segnale
- Use original levels - consente l'aggiunta dei livelli orizzontali iniziali dell'indicatore
A great indicator for MT5. Can't thank Sergey enough. Completely configurable, I have mine set to the old MT4 'Pro' settings. Author answers questions very quickly and went out of his way to make a purely cosmetic alteration. 5 Stars+ Many thanks.