Extended Traders Dynamic Index MT5
- Göstergeler
-
Sergey Efimenko
 Herkese merhaba!
Ürünümle ilgili herhangi bir sorun yaşarsanız benimle iletişime geçin, size en kısa sürede yardımcı olmaya çalışacağım.
Strateji test cihazı için demoyu deneyin, muhtemelen kendi ticaret stratejinizi oluşturmak için iyi bir yardımcı bulacaksınız.
Saygılarımla, Sergey! - Sürüm: 1.8
- Güncellendi: 6 Mart 2024
- Etkinleştirmeler: 7
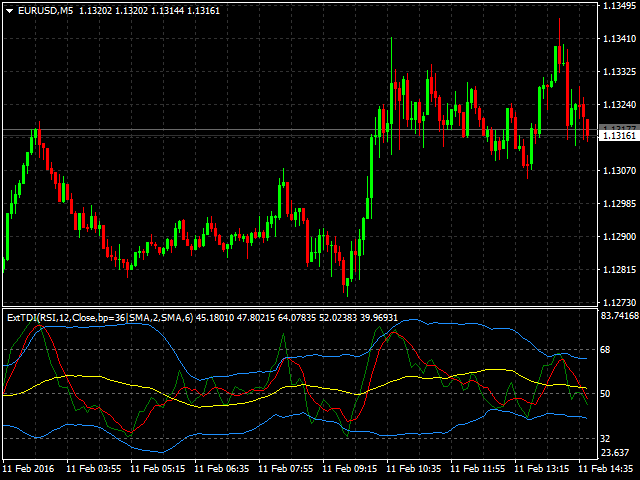
Gösterge, mevcut fiyat yönünü ve piyasa oynaklığını belirlemenizi sağlar. Traders Dynamic Index'in bu sürümü, geçmiş verilerin yeniden çizilmesini ortadan kaldırdı, algoritma hesaplama hızı optimize edildi, daha hassas ayarlamalar için daha fazla harici parametreye ve genişletilmiş işlevselliklere sahiptir: ilk osilatör seçimi ve ortalamaların yumuşatma yöntemleri eklendi .
parametreler:
- Mode Osc - tahmin osilatör seçimi
- Period Osc - kullanılan osilatörün hesaplama periyodu
- Price Osc - salınım hesaplaması için uygulanan fiyat
- Osc volatility bands period - osilatörün volatilite periyodu
- Osc volatility bands multiplier - osilatörün volatilite çarpanı
- Smoothing Osc price line period - ana hattın yumuşatma süresi
- Smoothing Osc price line method - ana hattın yumuşatma yöntemi
- Smoothing Osc signal line period - sinyal hattının yumuşatma periyodu
- Smoothing Osc signal line method - sinyal hattının yumuşatma yöntemi
- Use original levels - göstergenin ilk yatay seviyelerinin eklenmesini sağlar
A great indicator for MT5. Can't thank Sergey enough. Completely configurable, I have mine set to the old MT4 'Pro' settings. Author answers questions very quickly and went out of his way to make a purely cosmetic alteration. 5 Stars+ Many thanks.