Trend Master Histogram MT4
- Indicators
- Version: 1.0
- Activations: 5

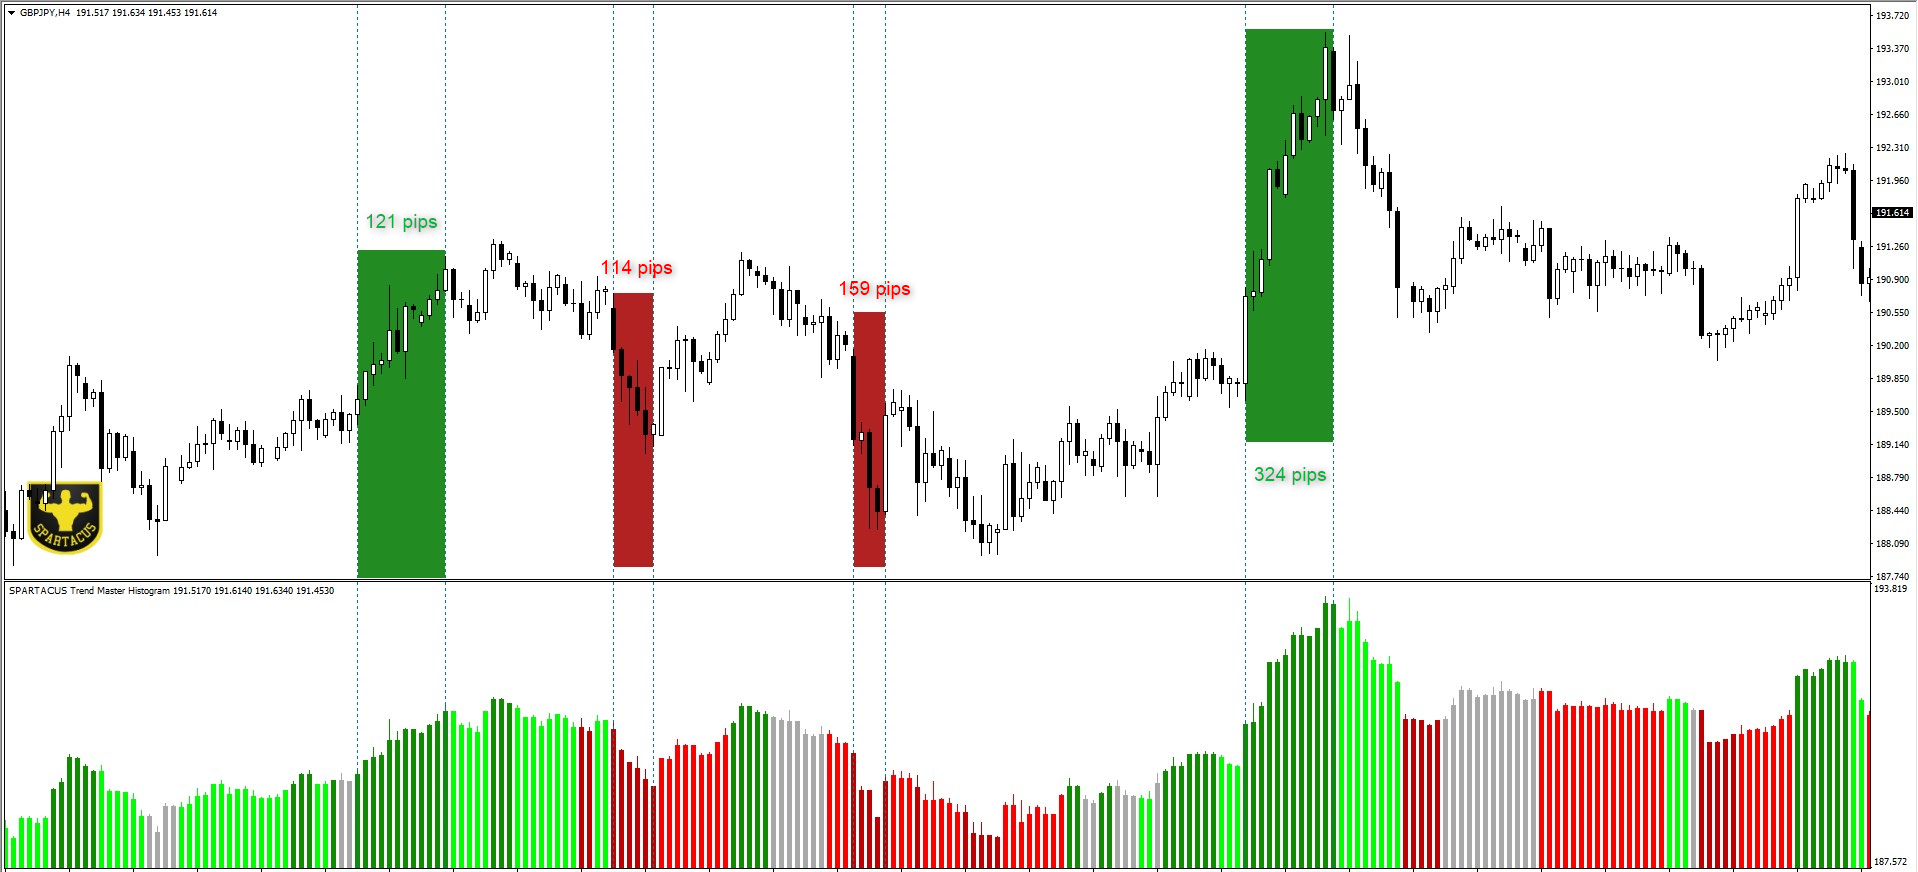
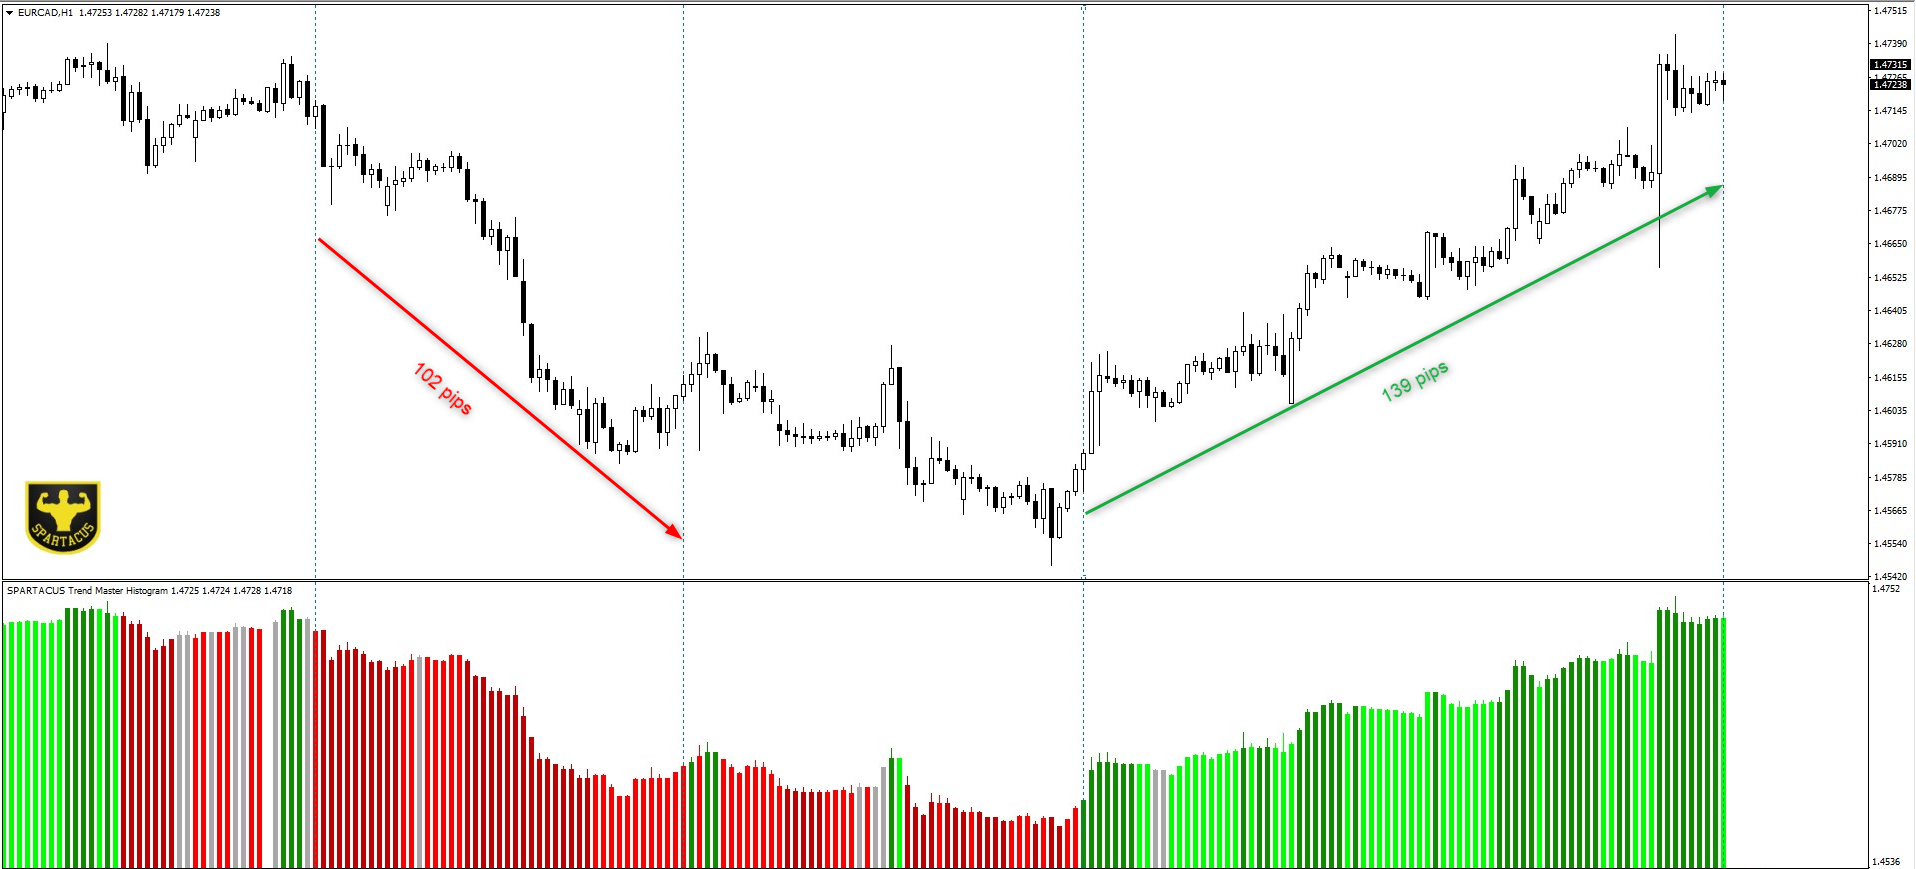
Trend Chart Histogram is an indicator based on an algorithm using two moving averages and several oscillators.
Thanks to its color code, it allows you to quickly identify the trend and take advantage of the biggest market impulses.
Light colors indicate the trend, dark colors define impulses and gray indicates that you should not enter the market.
It will be a very good ally in your decision-making, combined with your other indicators.
Input parameters:
- Period 1 (fast period)
- Period 2 (slow period)
- Oscillator period
You can enable two types of alerts:
- Bearish/Bullish alert (when the market changes trend).
- Buy/Sell alert (when there is a strong impulse).
The text of the alerts is fully customizable, put whatever you want!
Alerts available:
- Pop up
- Push notification.
Want to see other free SPARTACUS indicators, click here
SPARTACUS©2024