Enigmera
- Indicators
- Ivan Stefanov
- Version: 3.53
- Updated: 26 June 2025
- Activations: 20
ENIGMERA: The core of the market
The indicator’s code has been completely rewritten. Version 3.0 adds new functionalities and removes bugs that had accumulated since the indicator’s inception.
How It Works
Most of the indicator’s functionality is controlled through buttons on the left side of the chart, allowing rapid response to different market conditions.
Buttons
- ON/OFF - Shows or hides the entire indicator.
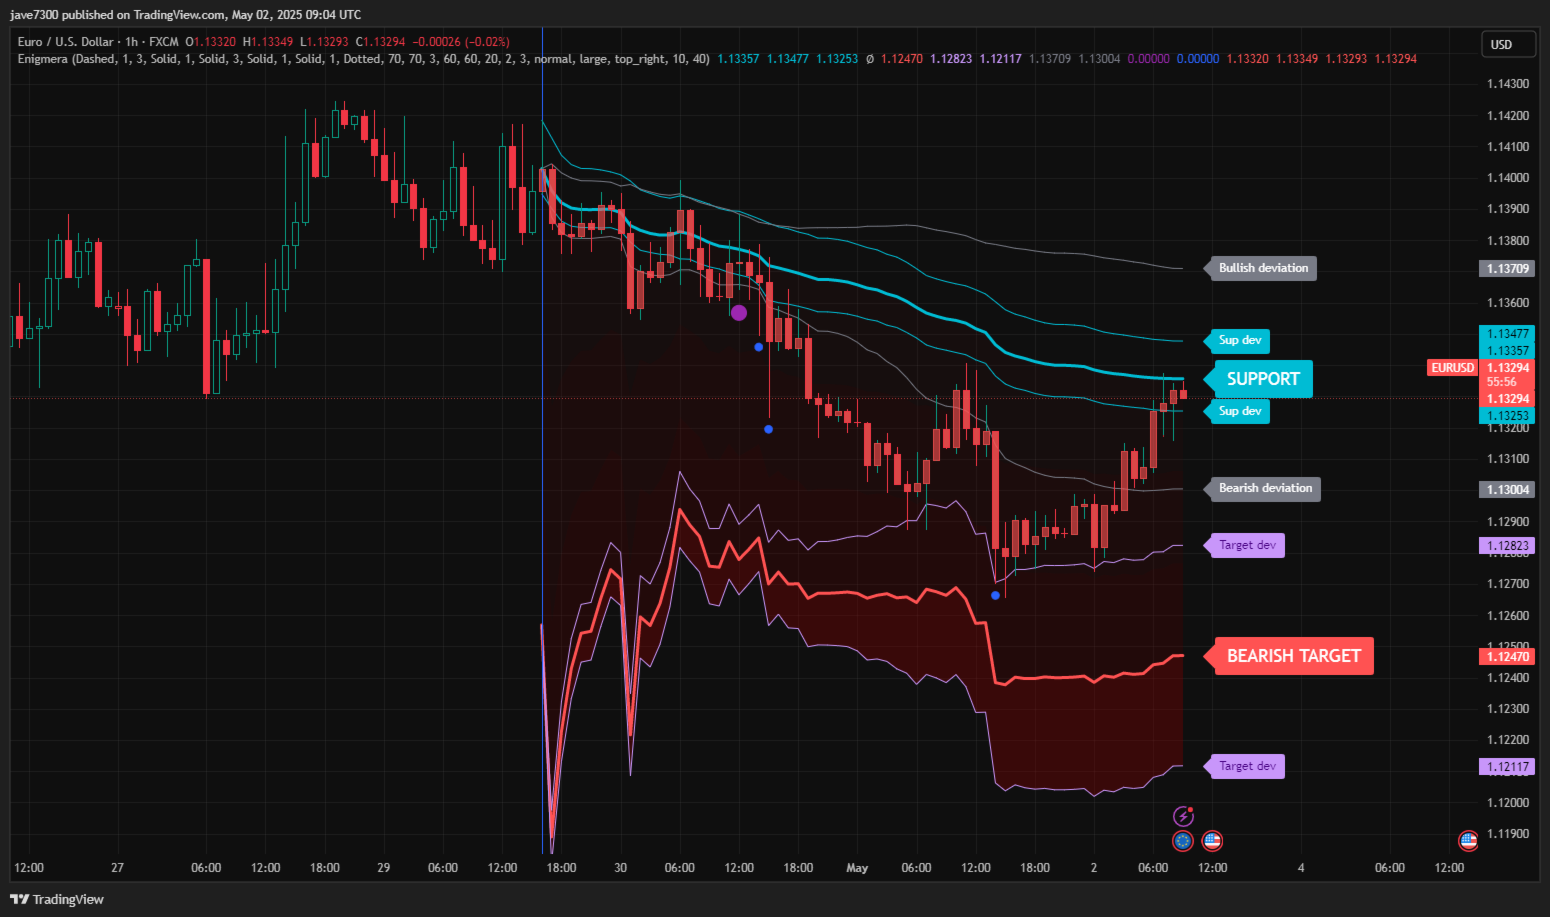
- Channel - Activates the support channel, indicating an acceptable range of deviation.
- Dev1 (First Deviation) - Indicates price movement within the support deviation, signaling market consolidation or strength accumulation.
- Dev2 (Second Deviation) - Shows price movement between deviations, signaling trend formation and direction.
- Dev3 (Third Deviation) - Indicates significant trend acceleration and high volatility.
- 45deg (45 Degrees) - Shows market pace and movement stability relative to the 45-degree line.
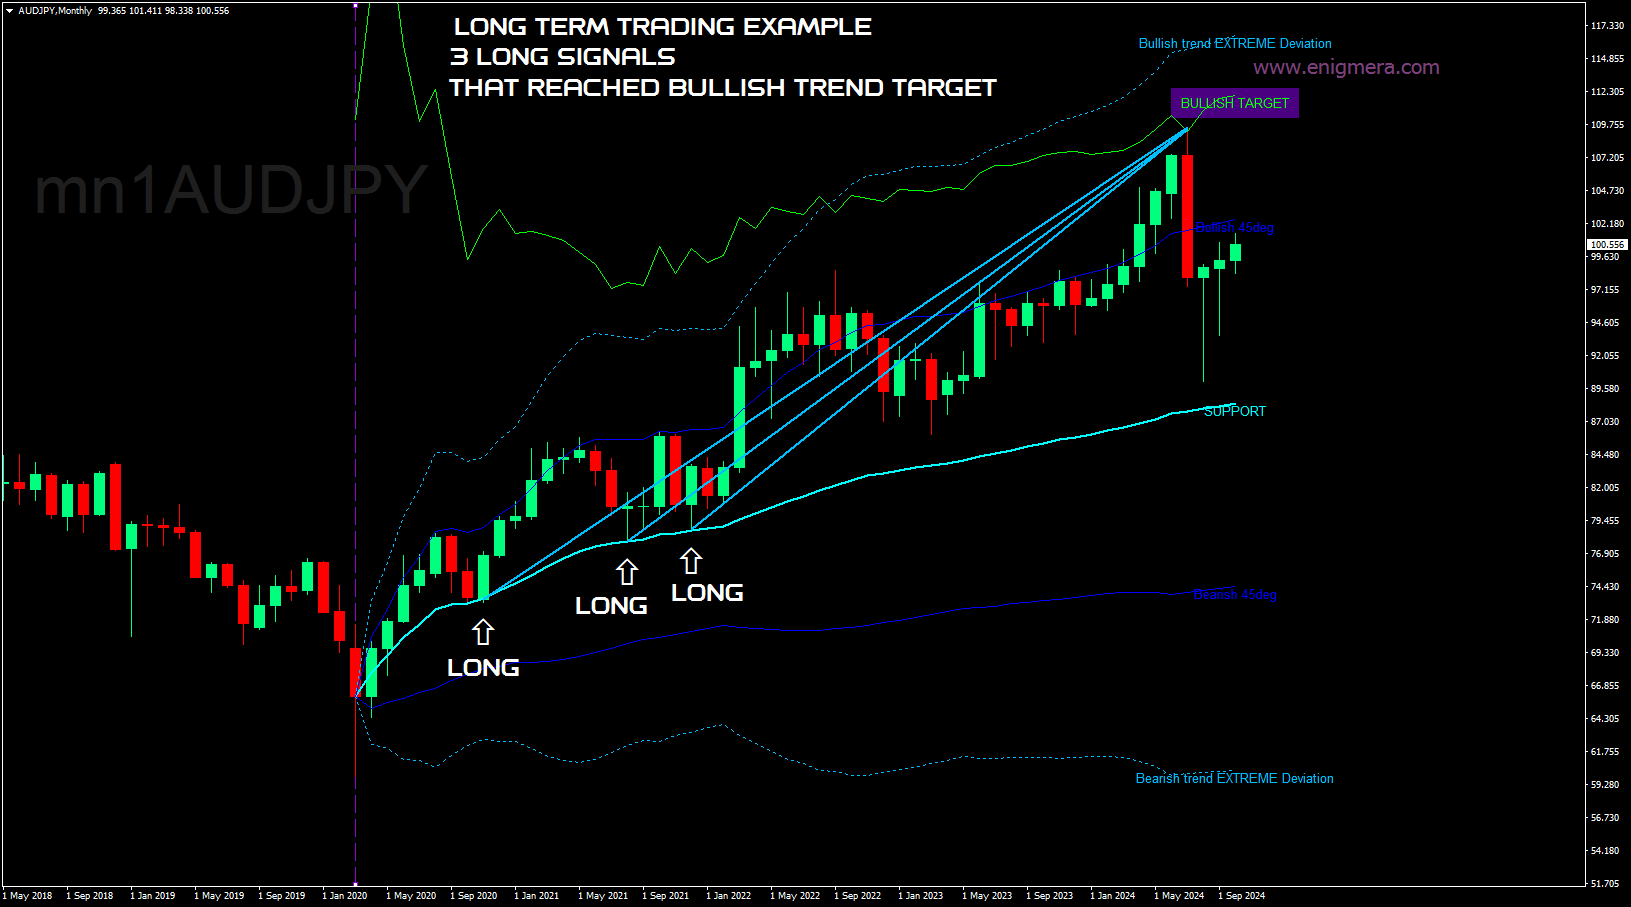
- Tgt1/2 (Half Target) - Represents half of the trend’s target line, used in the market’s final phase.
- Tgt (Target) - The trend’s target line, indicating levels to close positions.
- Tgt Dev - Channel whithin which the market target can vary
- Vol (Volume) - Displays volume dots on candles to indicate significant changes in market volume.
- X - Displays an “X” when the market reaches the target line.
- Lbls (Labels) - Shows or hides the labels on the lines.
- RandC (Random Colors) - Changes the indicator’s lines and labels to random colors for better visualization.
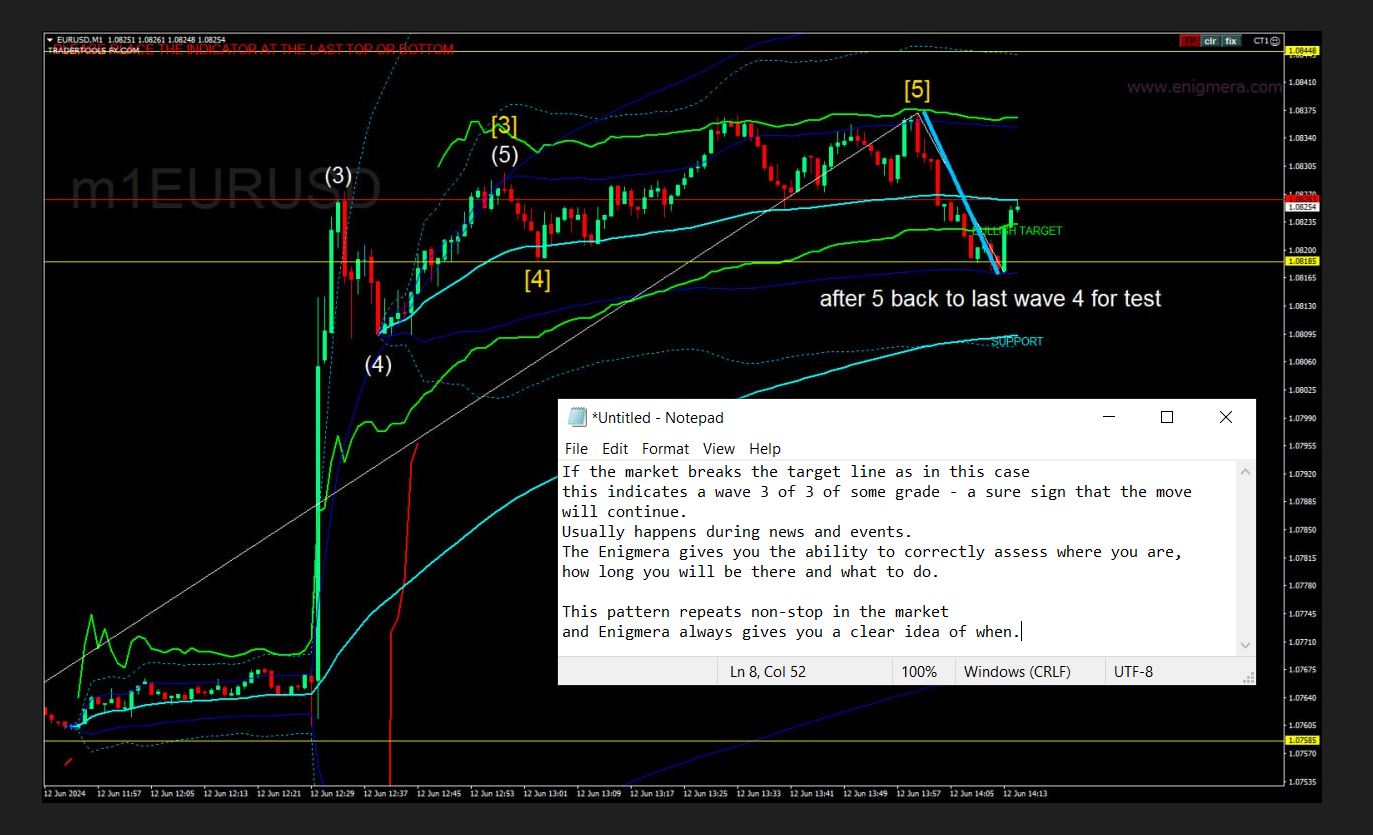
The system provides a complete picture of the present—unlike typical market indicators that merely extrapolate past data into the present and future. If you’re on support, it’s genuine support; if you’re on resistance, it’s genuine resistance. A broken level indicates a change in trend.
ENIGMERA is designed for financial analysts and consultants who need dependable insights to share with clients, as well as investors who demand the utmost precision and confidence.
It stands out for its optimal precision, enabling traders to evaluate their options with clarity and confidence.
Combining 20 years of trading expertise and knowledge into one comprehensive package, ENIGMERA is both intuitive and user-dependent. Its effectiveness relies on proper configuration by the user to maximize performance.
Recommendations:
- Currency Pair: All pairs, all markets
- Timeframe: All timeframes
- Minimum Deposit: No minimum deposit
- Account Type: No limitations
- Brokers: No limitations
This sophisticated indicator is ideal for effective day trading and scalping strategies. Optimize your discretionary trading with Enigmera’s advanced algorithms, suitable for Forex, stocks, indexes, and crypto markets. Designed for MetaTrader 4, MetaTrader 5 and TradingView, Enigmera streamlines stop-loss and risk management in trading.
All the tools you need to become a successful trader. Enigmera works on every market and every timeframe—with no redrawing.
Before you buy:
This product can be tested directly in the MetaTrader Strategy Tester.
I highly recommend that you explore how it behaves with your preferred instruments, timeframes, and market conditions before making a purchase decision.
Have questions or need clarification?
Feel free to send me a private message here on MQL5.
I’m available to assist and provide clear guidance to ensure you fully understand what the product offers.
Unlock a world of trading wisdom. Are you ready to take your financial decision-making to the ultimate level?
Enigmera is available for MT5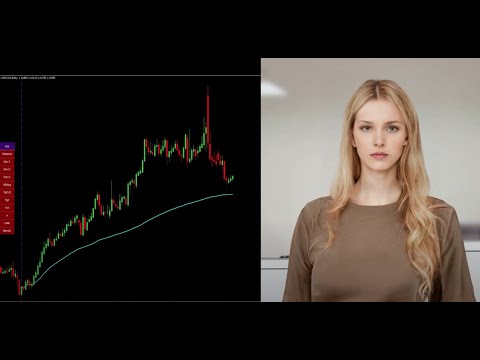


Yaklaşık olarak 10 yıldır forex piyasasında işlem yapmaktayım. Pek çok indikatör taradım ve aldım. Neredeyse bir çoğu çöptü diyebilirim. Enigmera indikatörden ziyade bir starteji yapmamı sağlamakta. Girmiş olduğum pozisyonlarda korkumu yenmeme katkı sağladı. Daha önce erken kapatmak zorunda olduğum pozisyonlarda bearish veya bullish hedefler neredeyse tam anlamıyla doğru çalışmakta ve buna bağlı olarak pozisyonlarımı daha uzun tutabilme güvenini sağladı. Özellikle support line çok ciddi olarak destek veya direnç olarak çalışmakta. Para yapmanıza kesinlikle katkı sağlayacaktır. Ivan teşekkür ederim.