Enigmera

5

ENIGMERA: 市場の中心

重要:MQL5.comのデモはStrategy Testerで実行されており、Enigmeraの機能を完全には反映していない場合があります。詳細については、説明、スクリーンショット、ビデオをご確認ください。質問があれば、遠慮なくメッセージを送ってください!

インジケーターのコードは完全に書き直されました。バージョン3.0は新機能を追加し、インジケーターの開始以来蓄積されたバグを修正しました。
紹介
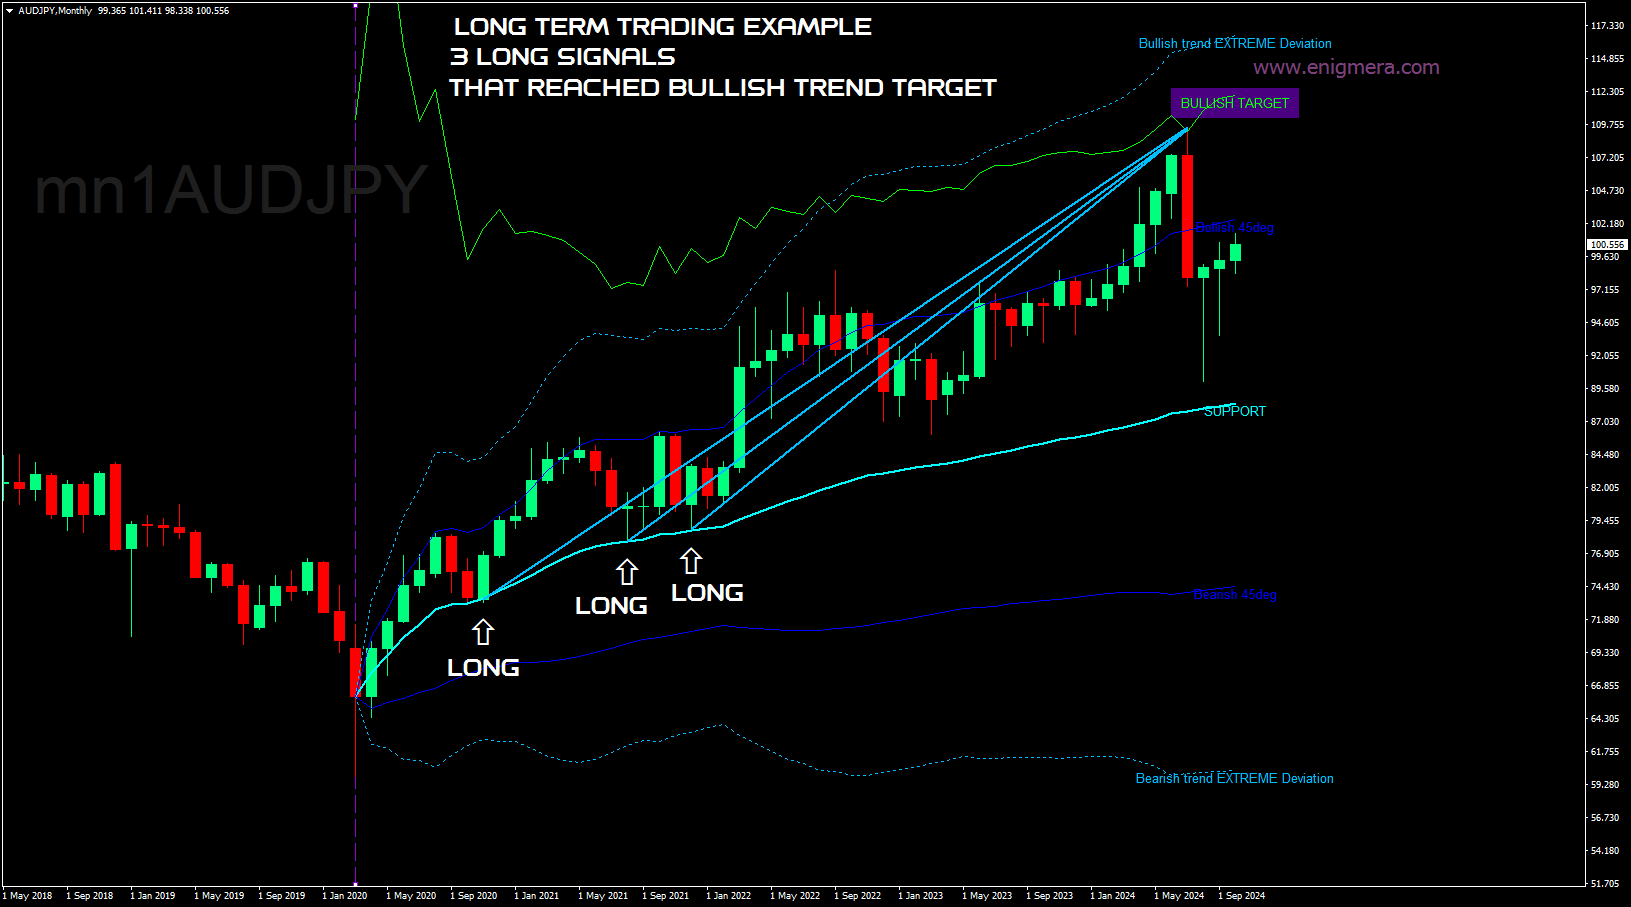
このインジケーターとトレーディングシステムは、金融市場への注目すべきアプローチです。ENIGMERAはフラクタルサイクルを使用して、サポートとレジスタンスのレベルを正確に計算します。真の蓄積フェーズを示し、方向と目標を提供します。トレンドでも修正でも機能するシステムです。
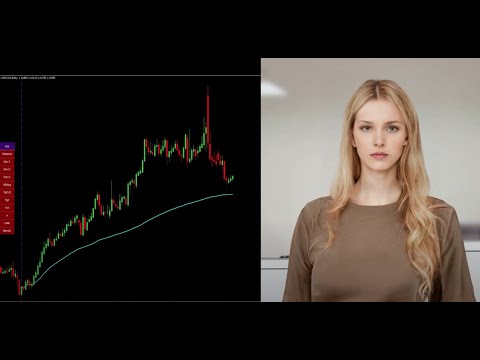
動作方法
インジケーターのほとんどの機能は、チャートの左側にあるボタンで制御され、市場の状況に迅速に対応できるようになっています。

ボタン

  1. ON/OFF – インジケーター全体を表示または非表示にします。
  2. Channel – サポートチャネルを有効にし、許容範囲の偏差を示します。
  3. Dev1 (第1偏差) – サポート偏差内での価格の動きを示し、市場の統合や力の蓄積を示します。
  4. Dev2 (第2偏差) – 偏差間の価格の動きを示し、トレンドの形成と方向を示します。
  5. Dev3 (第3偏差) – トレンドの急速な加速と高いボラティリティを示します。
  6. 45deg (45度) – 45度線に対する市場のペースと動きの安定性を示します。
  7. Tgt1/2 (半目標) – トレンドの目標線の半分を表し、市場の最終段階で使用されます。
  8. Tgt (目標) – ポジションを閉じるべきレベルを示すトレンドの目標線。
  9. Vol (ボリューム) – 市場のボリュームにおける顕著な変化を示すため、キャンドルにボリュームドットを表示します。
  10. X – 市場が目標ラインに達した時に「X」を表示します。
  11. Lbls (ラベル) – ライン上のラベルを表示または非表示にします。
  12. RandC (ランダムカラー) – インジケーターのラインとラベルをランダムな色に変更し、視覚的な改善を図ります。

システム
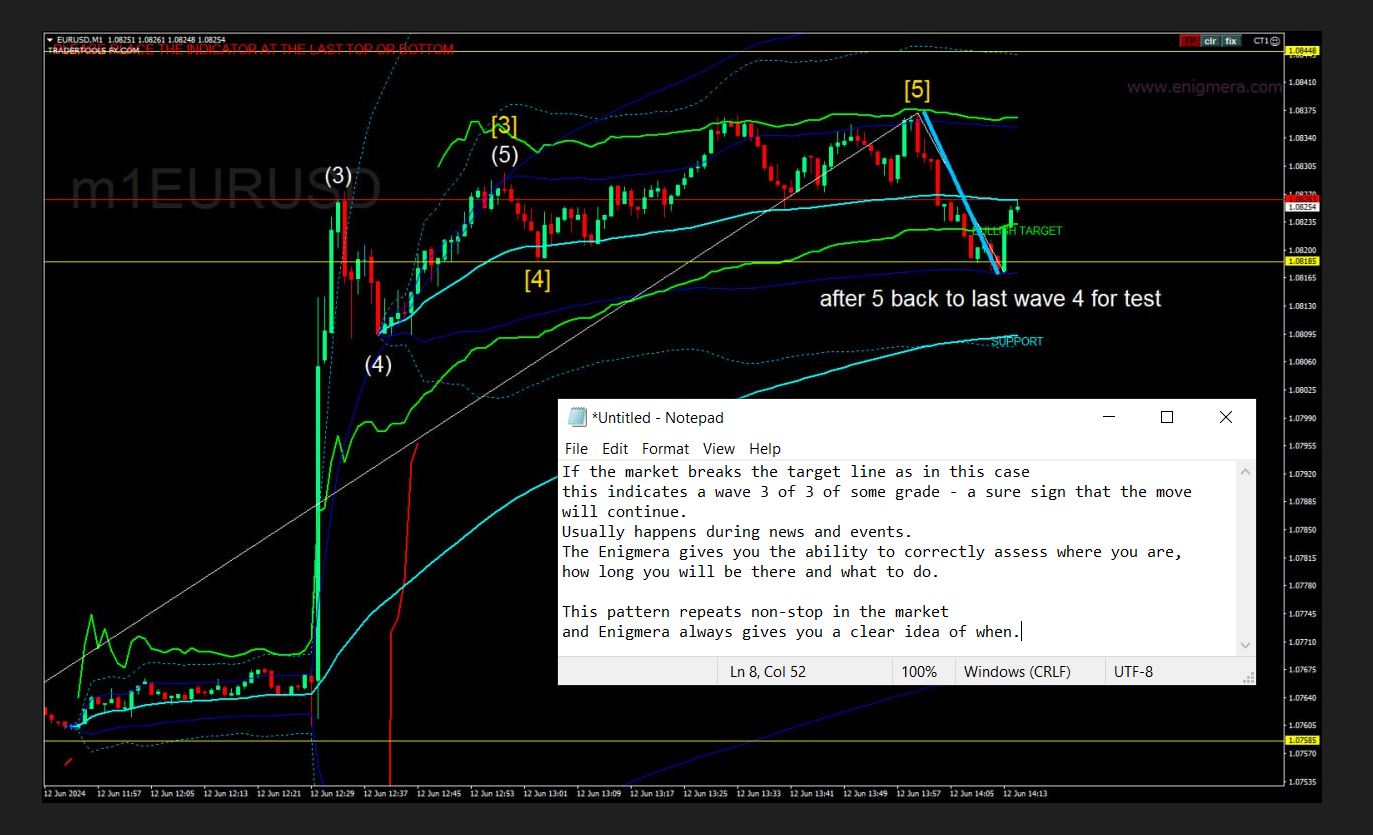
ENIGMERAは現在の市場の全体像を提供します。過去のデータを現在と未来に外挿する通常の市場インジケーターとは異なり、もしサポートにいるなら、それは本物のサポートです。もしレジスタンスにいるなら、それは本物のレジスタンスです。レベルが破られるとトレンドが変わることを示します。

ENIGMERAは、信頼できるインサイトをクライアントと共有する必要がある金融アナリストやコンサルタント、または最大限の精度と自信を求める投資家向けに設計されています。

その最適な精度により、トレーダーは明確で自信を持って選択肢を評価できます。

20年の取引経験と知識を1つのパッケージにまとめたENIGMERAは、直感的でユーザー依存型です。効果的には、ユーザーが適切に設定することに依存し、パフォーマンスを最大化します。

推奨事項:

  • 通貨ペア:すべてのペア、すべての市場
  • 時間枠:すべての時間枠
  • 最低預金:制限なし
  • 口座タイプ:制限なし
  • ブローカー:制限なし

この高度なインジケーターは、効果的なデイトレーディングやスキャルピング戦略に最適です。Enigmeraの高度なアルゴリズムを活用して、フォレックス、株式、指数、暗号通貨市場に適用できます。MetaTrader 4用に設計されており、Enigmeraはストップロスとリスク管理を簡素化します。

成功するトレーダーになるために必要なすべてのツール。Enigmeraはすべての市場と時間枠で機能し、再描画はありません。

あなたの金融意思決定を次のレベルに引き上げる準備はできていますか?


レビュー 10
onermentes
19
onermentes 2025.06.17 18:57 
 

Yaklaşık olarak 10 yıldır forex piyasasında işlem yapmaktayım. Pek çok indikatör taradım ve aldım. Neredeyse bir çoğu çöptü diyebilirim. Enigmera indikatörden ziyade bir starteji yapmamı sağlamakta. Girmiş olduğum pozisyonlarda korkumu yenmeme katkı sağladı. Daha önce erken kapatmak zorunda olduğum pozisyonlarda bearish veya bullish hedefler neredeyse tam anlamıyla doğru çalışmakta ve buna bağlı olarak pozisyonlarımı daha uzun tutabilme güvenini sağladı. Özellikle support line çok ciddi olarak destek veya direnç olarak çalışmakta. Para yapmanıza kesinlikle katkı sağlayacaktır. Ivan teşekkür ederim.

TANJU2690
614
TANJU2690 2025.03.05 13:37 
 

I have never and ever seen any system like Enıgmera. What ever you want, you can find on it. İt is incredible system. And Cretor of aenıgmera, Mr.Ivan is more and more helpfull to understant of logıc Enigmera. Fistly, I want sent all thankfull to Ivan because he teach me Enıgmera Logıc and also share this marvelous product with market

smso9466eiou
187
smso9466eiou 2025.02.23 15:38 
 

a very good indicator that composes all in one, entry, exit and reverse. Great!

おすすめのプロダクト
Gartley Projection D
Oleksandr Medviediev
3.71 (7)
このインジケーターは、H.M.Gartley (「株式市場の利益」、1935 年) の開発に従って調和パターン (XABCD) を識別します。 D 点を透視投影の点として投影します (設定で ProjectionD_Mode = true を指定します)。 再描画はしません。 作業時間枠のバーが閉じるとき、特定されたパターン ポイントが Patterns_Fractal_Bars バーの間に移動していない場合、チャート上に (予想される価格変動の方向に) 矢印が表示されます。 この瞬間から、矢印はチャート上に永久に残ります。 連続した 2 ~ 3 つ以上の矢印 - これは市場状況の変化であり、再描画/再描画ではありません (時間枠を前後に切り替えてはなりません)。 注: 2 ~ 3 つ以上の矢印が連続している場合 - これは市況の変化であり、再描画ではありません。 パターンの総数は 85 です (Gartley-222 と Gartley-222WS を含む。完全なリストはコメント セクションにあります)。 識別されたすべてのパターンのうち、最後に識別されたパターンのみがベ
This is an arrow indicator without a future function,developed based on the most advanced profit trading algorithms.It has the most innovative and advanced dual trend analysis module, as well as the latest and highly effective market trend prediction algorithm.Trends are your friends, and following larger trends can earn the maximum profit in foreign exchange. This indicator helps traders identify current trends and track them. Someone once made a profit of 10 times in a week by relying on it.No
This MT4 indicator, Stochastic Visual MTF, summarize the oscillator values in color graphic for both  Main and Signal in current market emotion stage which will show you in multi timeframes (9) and sum of the total Main and Signal oscillator values which is an important information for traders especially you can see all oscillator values in visualized graphic easily, You can add more by Shift, Hope it will be helpful tool for you for making a good decision in trading.
これはほぼ間違いなく、MetaTraderプラットフォームで見つけることができる最も完全な調和価格形成自動認識インジケーターです。 19種類のパターンを検出し、フィボナッチプロジェクションをあなたと同じように真剣に受け止め、潜在的逆転ゾーン(PRZ)を表示し、適切なストップロスとテイクプロフィットレベルを見つけます。 [ インストールガイド | 更新ガイド | トラブルシューティング | よくある質問 | すべての製品 ] 19の異なる調和価格形成を検出します プライマリ、派生および補完フィボナッチ投影(PRZ)をプロットします 過去の価格行動を評価し、過去のすべてのパターンを表示します この指標は、独自の品質とパフォーマンスを分析します 適切なストップロスとテイクプロフィットのレベルを表示します ブレイクアウトを使用して適切な取引を通知します すべてのパターン比をグラフにプロットします 電子メール/音声/視覚アラートを実装します スコット・M・カーニーの本に着想を得て、この指標は最も純粋で急を要するトレーダーのニーズを満たすように設計されています。ただし、トレードを容易にする
Forex Gump
Andrey Kozak
2.4 (5)
Forex Gump is a fully finished semi-automatic trading system. In the form of arrows, signals are displayed on the screen for opening and closing deals. All you need is to follow the instructions of the indicator. When the indicator shows a blue arrow, you need to open a buy order. When the indicator shows a red arrow, you need to open a sell order. Close orders when the indicator draws a yellow cross. In order to get the most effective result, we recommend using the timeframes H1, H4, D1. There
このインジケーターは アグレッシブなスキャルピング と バイナリーオプションの速いエントリー のために設計されており、 毎バー でシグナルを生成し、常に何が起こっているかを正確に把握できます。 Happy Scalpingチャンネルに参加する: MQL5 再描画しません :現在のバーのシグナルは リアルタイム で生成されるため、まだバーが形成されている間に、前のバーの終値に対して価格が上がるか下がるかによってシグナルが変わる可能性があります。 しかし、バーが 閉じる と、シグナルの色は 完全に固定されます 。変更されず、消えず、動かず、 見るものがそのまま残ります。 なぜこのように設計されたのか? 多くのスキャルパーは、特に価格が ブレイクアウトや急激な動き をする際に、すぐにシグナルを受け取ることを重視しています。そのため、その瞬間に迅速に取引を行い、すぐにピップを獲得することができます。 一方で、バーが閉じた後の 確認を待つ ことを好むトレーダーもおり、その場合でもこのインジケーターを問題なく使用できます。 どちらのアプローチも有効です 。このシステムはどちらのスタイルにも
The Sensitive Volume indicator is an indicator designed to generate trading signals. The purpose of this indicator is to generate signals from the highest probability of trading. Using a number of price movements and a set of indicator properties to generate these signals.  Easy to use, simple and understandable to the user. With alert features, user signals can be reached quickly.  Visually the user can easily recognize the signals. This indicator will not repaint. Parameters Trend_Period - pe
OFFER! OFFER! NEXT Price Will be 650$ and the rental option will be removed after this. Don't miss the current price offer before it is too late. Dear Traders I am so glad to introduce my Super Powers Indicator.  The purpose of this trading tool is to help serious traders who want to make trading one of their main source of income.  I know trading is not an easy task but if you have the right tools, knowledge and motivation to trade then you are ready to go in this industry. My role is to help y
このインジケーターは、手動および自動的な方法で描かれる調和パターンを検出します。 ご自身のレビューを追加してください。 注意事項: インジケーターにはコントロールパネルがあり、各(チャートとタイムフレーム)の設定を保存します。スペースを確保するために最小化することができ、他の分析ツールと一緒に作業する際にインジケーターデータをすべて非表示にするために閉じるボタンを押すこともできます。 このインジケーターを使用して設定を変更し、移動平均線やボリンジャーバンドなどのインジケーターを追加する場合、このインジケーターは自動的に編集したテンプレートを保存し、必要なときにロードすることができます。 Windows 10を使用している場合は、MetaTraderアイコンを右クリックして > 互換性 > 高DPI設定の変更 > システム(強化)を選択して、最適な画面設定にしてください(これはHDデバイスで行う必要があります)。 このインジケーターは、チャート上で調和トレーディング理論を解釈したもので、チャート上の調和パターンを検出します。詳しく学びたい場合は、Scott Carneyの「ハーモニックト
Overview Harmonic Patterns MT4 is a technical analysis indicator designed for the MetaTrader 5 platform. It identifies and displays harmonic price patterns, such as Butterfly, Cypher, Crab, Bat, Shark, and Gartley, in both bullish and bearish directions. The indicator calculates key price levels, including entry, stop loss, and three take-profit levels, to assist traders in analyzing market movements. Visual elements and customizable alerts enhance usability on the chart. Features Detects six ha
Introduction to Chart Pattern MT Chart Pattern MT is a chart pattern scanner to detect the triangle pattern, falling wedge pattern, rising wedge pattern, channel pattern and so on. Chart Pattern MT uses highly sophisticated chart pattern detection algorithm. However, we have designed it in the easy to use with intuitive user interface. Chart Pattern MT will show all the patterns in your chart in the most efficient format for your trading. You do not have to do tedious manual pattern detection an
Chart Patterns Detect 15 patterns (Ascending Triangle, Descending Triangle, Rising Wedge, Falling Wedge, Bullish Flag, Bearish Flag, Bullish Rectangle, Bearish Rectangle Symmetrical triangle, Head and Shoulders, Inverted Head and Shoulders, Triple top, Triple Bottom, Double Top, Double Bottom) Use historical data to calculate the probability of each pattern to succeed (possibility to filter notification according to the chance of success) gives graphic indication about the invalidation level and
Alpha Trend signは私たちの取引システムを検証し、取引信号を明確に提示し、信号がドリフトすることはありません。 主な機能: •市場が活況を示している地域に応じて、指標に基づいて現在の相場がトレンド相場に属しているか、それとも揺れ相場に属しているかを直感的に判断することができる。 そして、指標の指示矢印に基づいて市場に切り込み、緑の矢印は購入を提示し、赤の矢印は販売を提示する。 •小周期変動による頻繁な取引信号の発生を回避するために、5分以上の時間周期で取引を行うことを推奨します。 •最適な取引タイミングを逃さないために、シグナルプロンプトをオンにすることもできます。 •本指標はトレンド相場をよく予測するだけでなく、幅広振動相場でも利益を得ることができる。 •本指標は大道至簡の原則に基づいており、異なる段階のトレーダーが使用するのに適している。 注意事項: •Alpha Trend signには明確な入退場信号があり、損失を与えないように逆位相操作を提案しない。 •Alpha Trend signは特に成熟した指標であり、デルのチー
EARLY REMINDER: The Starting price is 65 price will rise soon up to 365$ and then 750$ after first 10 copies of sales. Grab this offer now! Introduction Hello, traders! Welcome to the demonstration of the Forex Beast Indicator , a comprehensive tool designed to assist aspiring traders in navigating the complexities of the forex market. This indicator incorporates seven essential components to provide a well-rounded trading experience: Moving Averages Colored Zones Support and Resistance Levels
Big Bull mt4 is a powerful arrow trend indicator for MetaTrader 4, designed to accurately identify market directions and key reversal points without redrawing. The indicator combines price channel analysis, ATR volatility, and adaptive SMA filters to generate clear trading signals with confirmation in the form of arrows and trend lines. It is ideal for traders who value a clean chart, timely signals, and reliable entry points. Features and benefits No redrawing — signals remain on the ch
ナイト ゴースト - バイナリ オプションの矢印インジケーター。 これからのあなたの頼もしいアシスタントです! 11 - チャートの再描画なし - すべての通貨ペアで大活躍! -インジケータの精度は最大 90% (特に夜間) ・長時間の設定不要(バイナリーオプションに最適な設定) - 信号が遅れない - 現在のローソク足でのシグナルの出現 ・M1期にピッタリ(No More!) ・目に優しいキャンドルカラー(赤・青) -インストールされたアラート それを扱う: - 青い矢印は信号アップを示します -赤い下向き矢印 M1 以上のインジケーターをチャートに配置しないでください. シグナルの精度が低下します! インジケーターのスクリーンショットとビデオを見る
Binary Options Support Resistance Indicator This indicator is designed for binary options trading and effectively shows retracements from support and resistance levels. Signals appear on the current candle. A red arrow pointing downwards indicates a potential selling opportunity, while a blue arrow pointing upwards suggests buying opportunities. All that needs adjustment is the color of the signal arrows. It is recommended to use it on the M1-M5 timeframes as signals are frequent on these timef
Monster Harmonics Indicator is a harmonic pattern indicator. It recognizes Gartley, Bat, Crab, Butterfly, Cypher, White Swan, Black Swan, Shark and several other patterns. Projected patterns that are not yet completed are recognized, too. Monster even shows the PRZ (Potential Reversal Zone). Users can add their own user defined patterns to Monster. Besides the current pattern, Monster also shows all patterns in the symbols history. Monster will provide alerts for developing patterns. Introduced
Embark on the pinnacle of Binary Options evolution. Our indicator isn't just adaptive—it's relentless. Picture a ninja riding a serpent, shadowing its every move; that's how this tool trails the market trend, unwavering till the end. Built upon the foundational prowess of the Ichimoku indicator and honed with an array of fine-tuned oscillators, it epitomizes accuracy and precision. Dive deep without getting lost in the Ichimoku's intricacies—our indicator simplifies the process for you. Perhaps
"Impulses and Corrections 4" is created to help traders navigate the market situation. The indicator shows multi-time frame upward and downward "Impulses" of price movements. These impulses are the basis for determining the "Base" , which is composed of zones of corrections of price movements, as well as "Potential" zones for possible scenarios of price movement. Up and down impulses are determined based on a modified formula of Bill Williams' "Fractals" indicator. The last impulse is always "U
「ダイナミック・スキャルピング・オシレーター」は、MT4向けの高度なカスタムCrypto_Forexインジケーターです。効率的な取引ツールです! - 新世代のオシレーター - 使い方は画像をご覧ください。 - ダイナミック・スキャルピング・オシレーターは、適応型の売られ過ぎ/買われ過ぎゾーンを備えています。 - オシレーターは、動的な売られ過ぎ/買われ過ぎエリアから正確なエントリーポイントを見つけるための補助ツールです。 - 売られ過ぎ値:グリーンラインより下、買われ過ぎ値:オレンジラインより上。 - このインジケーターは、プライスアクションパターンと組み合わせるのに最適です。 - 標準的なオシレーターよりもはるかに正確です。対応時間枠:M30、H1、H4、D1、W1。 - PCとモバイルの両方でアラート機能付き。 高品質のトレーディングロボットとインジケーターをご覧になるにはここをクリックしてください! これは、このMQL5ウェブサイトでのみ提供されるオリジナル製品です。
Reversal Pattern Pro
Boonyapagorn Rodvattanajinda
Reversal Patterns Pro Reversal Patterns Pro is a Price Action (PA) analytical tool that scans the reversal patterns.  - Finds and marks the most dependable Japanese candlestick patterns in real-time. - Supports all time frames (Best for Scalping) - Doesn't repaint making it an exceptional indicator for Expert Advisors. Input parameters : - Support & Resistance Mode ( true or false ) for enabling advanced filtering - Donchian Period - RSI Period - RSI Oversold Level - RSI Overbought Level - Al
自動エリオット波動理論 (Automated Elliott Wave) 1. 自動波動カウントとバイアスの排除(客観性) 通常、エリオット波動のカウントには「主観」や個人の意見が入りがちです。このインジケーターは以下のように役立ちます: 推進波(インパルス 1-2-3-4-5)の検出: 厳格なルール(例:3波は最短であってはならない、4波は1波と重なってはならない)を使用し、理論的に正しい価格構造を表示します。 修正波(A-B-C)の検出: トレンド方向への再エントリー機会を見つけるために、価格の調整局面を捉えます。 2. マルチ・ディグリー分析 (Multi-Degree Analysis) 単一の時間枠だけでなく、3つの深度レベルを同時に分析し、市場を立体的(3D)に捉えます: マイナー (Minor): 短期的な素早い動き。 インターミディエイト (Intermediate): 主要なトレンド。 プライマリー (Primary): 市場の大きな全体像。 メリット: トレードスタイルに合わせて各レベルの表示/非表示を切り替え可能です。 3. ターゲット価格とエントリーポイント
Gioteen Volatility Index (GVI)   - your ultimate solution to overcoming market unpredictability and maximizing trading opportunities. This revolutionary indicator helps you in lowering your losing trades due to choppy market movements. The GVI is designed to measure market volatility, providing you with valuable insights to identify the most favorable trading prospects. Its intuitive interface consists of a dynamic red line representing the volatility index, accompanied by blue line that indicat
Introduction to X3 Chart Pattern Scanner X3 Cherart Pattern Scanner is the non-repainting and non-lagging indicator detecting X3 chart patterns including Harmonic pattern, Elliott Wave pattern, X3 patterns, and Japanese Candlestick patterns. Historical patterns match with signal patterns. Hence, you can readily develop the solid trading strategy in your chart. More importantly, this superb pattern scanner can detect the optimal pattern of its kind. In addition, you can switch on and off individu
ICT Killzones & Pivots Pro is a powerful trading indicator designed to visualize the most important intraday sessions and liquidity zones used by professional traders. It automatically highlights key trading periods such as Asia, London, and New York sessions, allowing traders to clearly see when market activity and volatility are at their highest. Pricing Launch Price : $33 Incremental Price Increase : The price will increase by $10 after every 10 purchases. Final Price : $69 The indicator draw
The Th3Eng PipFinite indicator is based on a very excellent analysis of the right trend direction with perfect custom algorithms. It show the true direction and the best point to start trading. With StopLoss point and Three Take Profit points. Also it show the right pivot of the price and small points to order to replace the dynamic support and resistance channel, Which surrounds the price. And Finally it draws a very helpful Box on the left side on the chart includes (take profits and Stop loss
Indicator for binary options arrow is easy to use and does not require configuration works on all currency pairs, cryptocurrencies buy signal blue up arrow sell signal red down arrow tips do not trade during news and 15-30 minutes before their release, as the market is too volatile and there is a lot of noise it is worth entering trades one or two candles from the current period (recommended for 1 candle) timeframe up to m 15 recommended money management fixed lot or fixed percentage of the depo
The   RSI Divergence + FVG Signal   indicator combines   Relative Strength Index (RSI) Divergence   with   Fair Value Gap (FVG)   detection to generate high-probability buy and sell signals based on both momentum shifts and institutional imbalance zones. Core Features: RSI Divergence Detection : Identifies both regular and hidden bullish/bearish divergences between price and RSI. Divergences indicate potential trend reversals or continuation. FVG Zone Recognition : Detects Fair Value Gaps (imbal
EZZ Elite Zig Zag is an indicator for the MetaTrader 4 terminal. This indicator traces the peak of the trend based on the market reversal, thus showing various opportunities in the financial market. EZZ Elite Zig Zag is a visual tool, intuitive, and easy to understand and use.  Test it Yourself by Downloading it for Free. Author Paulo Rocha all rights reserved
このプロダクトを購入した人は以下も購入しています
「 Dynamic Scalper System 」インジケーターは、トレンド波の中でスキャルピング取引を行う手法のために設計されています。 主要通貨ペアと金でテスト済みで、他の取引商品との互換性があります。 トレンドに沿った短期的なポジションオープンのシグナルを提供し、追加の価格変動サポートも提供します。 インジケーターの原理 大きな矢印はトレンドの方向を決定します。 トレンド波の中では、小さな矢印の形でスキャルピングシグナルを生成するアルゴリズムが機能します。 赤い矢印は強気方向、青い矢印は弱気方向です。 トレンドの方向には敏感な価格変動ラインが描かれ、小さな矢印のシグナルと連動します。 シグナルは次のように機能します。適切なタイミングでラインが現れるとエントリーシグナルが形成され、ラインが開いている間はポジションが保持され、完了すると取引が終了します。 推奨される動作時間枠はM1~H4です。 矢印は現在のローソク足に形成され、次のローソク足が開いている場合は、前のローソク足の矢印は再描画されません。 入力パラメータ Trend Wave Period - トレンド方向
Binary Booster
Yaroslav Varankin
5 (1)
Binary Options Trading Indicator: A Reliable Tool for Your Trades This indicator is specifically designed for binary options trading and has proven its high quality, reliability, and adequate accuracy, depending on the dynamics of the chart. Key Points: Signal Interpretation: When a blue cross signal appears, it indicates a potential entry into a trade, though it is considered a weak signal on its own. However, if the blue cross is accompanied by an arrow, it is considered a more reliable buy s
Miraculous Indicator – ガン・スクエア・オブ・ナインに基づく100%非リペイントのFXおよびバイナリーツール この動画では、FXおよびバイナリーオプションのトレーダー向けに特別に開発された、非常に正確で強力な取引ツールである Miraculous Indicator を紹介しています。このインジケーターがユニークなのは、伝説的な ガン・スクエア・オブ・ナイン と ガンの振動の法則 に基づいている点で、現代の取引で利用できる最も正確な予測ツールの一つとなっています。 Miraculous Indicatorは 完全に非リペイント であり、ローソク足が確定した後にシグナルが変化したり消えたりすることはありません。つまり、見たものがそのまま利用できます。これにより、トレーダーは自信を持ってエントリーおよびエグジットを行うための信頼性と一貫性のある根拠を得ることができます。 主な特徴: ガン・スクエア・オブ・ナインとガン理論に基づいて構築 100%非リペイントのシグナルシステム すべての時間枠(M1、M5、H1、H4、日足、週足)で機能 FXおよびバイナリーオプション取引
SYSTEM INTRODUCTION:   The Binary Options Channels System Is Specifically Designed For Binary Options Trading. Unlike Other Systems And Indicators That Were Adopted From Other Trading Environments For Binary Options. Little Wonder Why Many Of Such Systems Fail To Make Money . Many End Up Loosing Money For Their Users.  A Very Important Fact That Must Be Noted Is The Fact That Application Of Martingale Is not Required. Thus Making It Safer For Traders Usage And Profitability. A Trader Can Use Fi
Precautions for subscribing to indicator This indicator only supports the computer version of MT4 Does not support MT5, mobile phones, tablets The indicator only shows the day's entry arrow The previous history arrow will not be displayed (Live broadcast is for demonstration) The indicator is a trading aid Is not a EA automatic trading No copy trading function The indicator only indicates the entry position No exit (target profit)  The entry stop loss point is set at 30-50 PIPS Or the front hi
Quantum Momentum Guard (QMG) Advanced Breakout & Momentum Indicator for MetaTrader 4 Quantum Momentum Guard (QMG) is a next-generation MetaTrader 4 trading indicator designed to identify high-probability breakout opportunities using a powerful combination of advanced momentum analysis and high-level mathematical calculations . Unlike ordinary indicators that generate signals based on a single condition, QMG confirms every breakout with momentum strength and mathematical validation , ensuring
Linear Trend Predictor ー - エントリ ポイントと方向サポート ラインを組み合わせたトレンド インジケーター。高値/安値チャネルを突破するという原理に基づいて機能します。 インジケーターのアルゴリズムは市場のノイズをフィルタリングし、ボラティリティと市場の動向を考慮します。 インジケーターの機能  平滑化手法を使用して、市場のトレンドと、買い注文または売り注文を開くためのエントリー ポイントを表示します。  任意の時間枠のチャートを分析して、短期および長期の市場の動きを判断するのに適しています。  あらゆる市場や時間枠に適応可能な入力パラメータにより、トレーダーはインジケーターを独自にカスタマイズできます。  設定されたインジケーター信号は消えず、再描画もされません。ローソク足の終値で決定されます。  いくつかの種類の通知が矢印と組み合わされています。  このインジケーターは、独立した取引システムとして使用することも、他の取引システムへの追加として使用することもできます。  あらゆるレベルの経験を持つトレーダーが使用できます。 主なパラメータ Vol
Pulse Scalping Line - an indicator for identifying potential pivot points. Based on this indicator, you can build an effective Martingale system. According to our statistics, the indicator gives a maximum of 4 erroneous pivot points in a series. On average, these are 2 pivot points. That is, the indicator shows a reversal, it is erroneous. This means that the second signal of the indicator will be highly accurate. Based on this information, you can build a trading system based on the Martingale
El indicador "MR BEAST ALERTAS DE LIQUIDEZ" es una herramienta avanzada diseñada para proporcionar señales y alertas sobre la liquidez del mercado basándose en una serie de indicadores técnicos y análisis de tendencias. Ideal para traders que buscan oportunidades de trading en función de la dinámica de precios y los niveles de volatilidad, este indicador ofrece una visualización clara y detallada en la ventana del gráfico de MetaTrader. Características Principales: Canal ATR Adaptativo: Calcula
Meravith
Ivan Stefanov
5 (3)
マーケットメーカーのためのツール。 Meravith は次の機能を提供します: すべての時間足を分析し、現在有効なトレンドを表示します。 強気と弱気の出来高が等しくなる流動性ゾーン(出来高均衡)を強調表示します。 異なる時間足のすべての流動性レベルをチャート上に直接表示します。 テキスト形式の市場分析を生成し、参考情報として表示します。 現在のトレンドに基づいて目標値、サポートレベル、ストップロスを計算します。 取引のリスクリワード比を算出します。 口座残高に基づいてポジションサイズを計算し、潜在的な利益を推定します。 また、市場に大きな変化があった場合には警告を表示します。 インジケーターの主要ライン: 強気/弱気の出来高エグゾーストライン ― 目標値として機能します。 市場のトレンドを示すライン。市場が強気か弱気かによって色が変わり、トレンドのサポートとして機能します。主にその色が市場センチメントを示します。 出来高均衡ライン(Eq)。Eq(Volume Equilibrium)ラインはシステムの中核です。これは買い手と売り手の出来高のバランスポイントを表します。市場の流動性を示し
GEM Signal Pro GEM Signal Pro は、MetaTrader 4 向けのトレンドフォロー型インジケーターです。より明確なシグナル、より整理されたトレードセットアップ、そして実用的なリスク管理をチャート上で確認したいトレーダーのために設計されています。 単純な矢印だけを表示するのではなく、GEM Signal Pro はトレード全体の考え方を、より見やすく分かりやすい形で表示します。条件が確認されると、インジケーターはエントリー価格、ストップロス、利確目標をチャート上に表示し、トレードセットアップをより効率的に確認できるようにします。 動作の仕組み このインジケーターは、まず内部ロジックに基づいて有効なシードシグナルを検出します。 確認条件が満たされると、GEM Signal Pro はチャート上に完全なセットアップを表示します。これにより、トレーダーはトレード構造をより明確に把握し、手作業による分析を減らすことができます。 チャート上のトレードレベル 確認済みシグナルに対して、GEM Signal Pro は以下を表示できます。 エントリー価格 ストップロス テ
Product Name:   Quantum Regime Indicator Short Description:   A multi-engine structural regime and volatility filter. Description: Quantum Regime Indicator (QRI) is a sophisticated technical analysis algorithm designed to identify market structure shifts and volatility regimes. Unlike standard indicators that rely on immediate price action, QRI utilizes a hierarchical logic architecture to filter market noise and identify statistical extremes. The indicator is built on the philosophy of "Market
Fxland Price Reversal Zones (MT4) FXLAND Smart Reversal Indicator is a professional technical analysis tool designed to help traders identify potential price reversal zones and key market turning points with clarity and precision. The best reversal indicator and price return by choosing only one ceiling or floor in each time frame A masterpiece of combining mathematics and Gann, fractal matrix, Fibonacci, movement angle and time. Completely intelligent Key Features Detects potential pr
PairMaster Buy Sell Arrow Indicator for MT4 Trade Reversals Like a Pro — Catch Every Swing Point with Precision The PairMaster Buy Sell Arrow Indicator is a powerful MetaTrader 4 tool built to identify high-probability swing trading opportunities . Designed for traders who value accuracy, clarity, and simplicity, PairMaster detects key market turning points and plots intuitive buy and sell arrows directly on your chart. Key Features Accurate Swing Point Detection – Automatically identifies ma
"Dragon's Tail" is an integrated trading system, not just an indicator. This system analyzes each candle on a minute-by-minute basis, which is particularly effective in high market volatility conditions. The "Dragon's Tail" system identifies key market moments referred to as "bull and bear battles". Based on these "battles", the system gives trade direction recommendations. In the case of an arrow appearing on the chart, this signals the possibility of opening two trades in the indicated directi
The Nihilist 5.0 Indicator includes Forexalien and Nihilist Easy Trend trading strategies and systems. It is composed of an MTF Dashboard where you can analyze the different input possibilities of each strategy at a glance. It has an alert system with different types of configurable filters. You can also configure which TF you want to be notified on your Metatrader 4 platform and Mobile application The indicator has the option to view how could be a TP and SL by using ATR or fixed points, even w
This indicator depends on some secrets equations to draw Signals with Stop loss and maximum 4 Take profits. There is a free EA depends on this indicator as a gift when you purchase/rent it. Features Simply it gives you entry point as Ready sign (Buy / Sell) and arrow (Buy / Sell) after candle closed, also SL line and 4 TP lines or less. Once SL-TP lines are shown with the arrow, they remains as they are until signal change. It is historical indicator. No Repaint. user manual for V5 please click
Algo Trading Indicaor  With this indicator , you’ll have zones and trends that hight probability the price will reverse from it. so will gives you all the help that you need  MT5 Version                    https://www.mql5.com/en/market/product/170028 MT4 Version                    https://www.mql5.com/en/market/product/88034 Why should you join us !?  1-This indicator is logical since it’s working in previous days movement , to predict the future movements. 2-Algo trading indicator will hel
Bomb Bank Signal
Igor Pereira Calil
5 (1)
Bomb Bank シグナル: MetaTrader 4 の信頼度インジケーター Bomb Bank Signal は、金融市場で最も関連性の高いトレンドを特定するように設計された MetaTrader 4 の強力なインジケーターです。動きを正確に予測するツールをお探しなら、Bomb Bank が最適です。 仕組み: このインジケーターは、出来高分析、ローソク足終値、対称トレンドという 3 つの異なる方法を組み合わせて、売買の機会を検出してシグナルを送ります。 Bomb Bank は、買いの機会を特定するときは「爆弾」のようなものであり、売りシグナルを検出するときは「ドクロ」のようなものです。 ボムバンクはなぜ違うのですか? 完全な信頼性: Bomb Bank Signal は信号を削除しません。一度シグナルが発せられると、シグナルは残り続けるので、チャンスを逃すことはありません。 極めて高い精度: Bomb Bank は誤った信号を送信しません。リアルタイムで最新情報を更新し、市場の進化に合わせて調整しながら、以前のシグナルの透明性を維持します。 ライブアップデート: シ
OrderFlow Absorption – MT4用プロフェッショナル・デルタ&アブソープションシグナルインジケーター OrderFlow Absorptionで本物のオーダーフロー分析の力を解き放ちましょう。MetaTrader 4向けの究極のデルタヒストグラム&アブソープションシグナルインジケーターです。あらゆる価格変動の裏側で何が起きているのかを知りたいトレーダーのために設計されており、市場を動かす隠れた買い/売り圧力や吸収イベントを明らかにします。 特徴 デルタヒストグラムの可視化:   買い圧力・売り圧力を色分けされたヒストグラムで即座に表示。 アブソープションシグナル検出:   高度なロジックで強気・弱気の吸収イベントを特定し、反転の兆しを早期に通知。 チャートマーカー:   吸収シグナルをチャート上に直接マークし、視覚的に分かりやすく表示。 ポップアップアラート:   新しい吸収シグナルが出現した際にリアルタイムで通知。 カスタマイズ可能な閾値:   弱いシグナルを除外し、高確率のセットアップに集中。 リソース管理:   大きなチャートでも高速に動作する効率的な計算。
Gold Channel is a volatility-based indicator, developed with a specific timing algorithm for the XAUUSD pair, which consists of finding possible corrections in the market. This indicator shows two outer lines, an inner line (retracement line) and an arrow sign, where the theory of the channel is to help identify overbought and oversold conditions in the market. The market price will generally fall between the boundaries of the channel. If prices touch or move outside the channel it is a tradi
Rtc ML Ai | Predictor CORE MACHINE LEARNING ENGINE Adaptive ML Market Predictor – Multi-Bar Trend & Candle Forecast What This Indicator Does This indicator is a  real-time market prediction engine  designed to analyze price behavior and estimate  future market tendencies . Unlike conventional indicators, this system  does not rely on static parameters or historical curve-fitting , but adapts its internal state dynamically during live market operation. Instead of using static rules, the indic
Currently switched to the 4 hour chart - but use other time frames for confirmation. :-)  I change my main time frame based on the market movement at the time. The Hurricane Forex Indicator is a multi time frame indicator that includes such things as Trade Notifications, Trade Calculator, Momentum Indicator, risk reward and much more. We have a free Trade room for our users as well. Please check out the video for full details of how this indicator works as it has over 15 years worth of developme
ConfluencePro v2.0 – Ultimate Confluence Indicator for Binary Options & Forex Professional Multi-Filter Signal System with Dashboard, News Filter & Real-Time Statistics ConfluencePro v2.0 is the most advanced confluence-based indicator ever released on the MQL5 Market. It combines 17+ professional filters (Trend, Smart Money Concepts, Market Structure, Divergence, MTF Confirmation, News Events, Volume, Regime Detection and more) into a single, easy-to-read confluence score (0–100%). Only the hi
Naked Forex Kangaroo Tail Pro Indicator Kangaroo Tail Pro Indicator is a pattern recognition indicator for Forex, Stocks, Indices, Futures, Commodities and Cryptos. The Kangaroo Tail is a multi-bar pattern. The Kangaroo Tail pattern is very effective and is very simple to trade. The strategy that comes with the Kangaroo Tail is based on price action. The indicator does what it was designed for: displaying Kangaroo Tail patterns.   Don't expect to follow the up and down arrows and make money
[Trend Line Pro 3]  Trend Line Pro 3 is a discretionary analysis indicator that visualizes swing structure based on Dow Theory / ZigZag concepts and organizes key lines (support/resistance and trendlines) as well as potential break/structure-change points (BreakEdge) directly on the chart. * This product is NOT an EA. It does not place trades or send orders. It helps you organize market structure with the same rules and align your decision criteria more consistently.
How to use Pair Trading Station Pair Trading Station is recommended for H1 time frame and you can use it for any currency pairs. To generate buy and sell signal, follow few steps below to apply Pair Trading Station to your MetaTrader terminal. When you load Pair Trading Station on your chart, Pair Trading station will assess available historical data in your MetaTrader platforms for each currency pair. On your chart, the amount of historical data available will be displayed for each currency pai
FFx Engulfing Setup Alerter gives trade suggestions with Entry, Target 1, Target 2 and StopLoss. Below are the different options available: Entry suggestion - pips to be added over the break for the entry 3 different options to calculate the SL - by pips, by ATR multiplier or at the pattern High/Low 3 different options to calculate the 2 TPs - by pips, by ATR multiplier or at Risk/Reward Offset the dashboard - any place on the chart Remove the suggestion once the price reached the SL line Lines
FFx InsideBar Setup Alerter gives trade suggestions with Entry, Target 1, Target 2 and StopLoss. Below are the different options available: Entry suggestion - pips to be added over the break for the entry Minimum candle size - to avoid too close buy/sell entry suggestions 3 different options to calculate the SL - by pips, by ATR multiplier or at the pattern High/Low 3 different options to calculate the 2 TPs - by pips, by ATR multiplier or at Risk/Reward Offset the dashboard - any place on the c
FFx OutsideBar Setup Alerter gives trade suggestions with Entry, Target 1, Target 2 and StopLoss. Below are the different options available: Entry suggestion - pips to be added over the break for the entry. 3 different options to calculate the SL - by pips, by ATR multiplier or at the pattern High/Low. 3 different options to calculate the 2 TPs - by pips, by ATR multiplier or at Risk/Reward. Offset the dashboard - any place on the chart. Remove the suggestion once the price reached the SL line.
作者のその他のプロダクト
マーケットメーカーのためのツール。 Meravith は次の機能を提供します: すべての時間足を分析し、現在有効なトレンドを表示します。 強気と弱気の出来高が等しくなる流動性ゾーン(出来高均衡)を強調表示します。 異なる時間足のすべての流動性レベルをチャート上に直接表示します。 テキスト形式の市場分析を生成し、参考情報として表示します。 現在のトレンドに基づいて目標値、サポートレベル、ストップロスを計算します。 取引のリスクリワード比を算出します。 口座残高に基づいてポジションサイズを計算し、潜在的な利益を推定します。 また、市場に大きな変化があった場合には警告を表示します。 インジケーターの主要ライン: 強気/弱気の出来高エグゾーストライン ― 目標値として機能します。 市場のトレンドを示すライン。市場が強気か弱気かによって色が変わり、トレンドのサポートとして機能します。主にその色が市場センチメントを示します。 出来高均衡ライン(Eq)。Eq(Volume Equilibrium)ラインはシステムの中核です。これは買い手と売り手の出来高のバランスポイントを表します。市場の流動性を示し
MERAVITH SCANNERは、MetaTrader 5用のプロフェッショナルな金融市場インジケーターで、複数の分析ツールを一つの統合システムにまとめています。独自の出来高加重平均価格(VWAP)手法を使用してすべての計算を自動で行い、主観的な解釈を完全に排除します。 このインジケーターは、すべての資産クラス(FX、株式、指数、商品、暗号通貨)およびM1から月足までのすべての時間軸で動作します。基本原理は「価格は出来高に従う」というものです。MERAVITHは機関投資家の出来高が集中するポイントを特定し、その集中から数学的に正確な価格レベルを導き出します。予測や投機は行わず、計算のみを行います。 MERAVITH SCANNERを使用すると、28の主要FX通貨ペアをすべての時間軸でわずか2~3分でスキャンできます。また、任意の市場をスキャンすることも可能です。例えば、約100銘柄の株式を約10分でスキャンできます。 インジケーターは、消耗レベル、均衡線、偏差、統計レベル、およびターゲット予測を算出します。 チャート要素 Origin Point :すべての計算が始まる起点です。イン
このインジケーターは、価格の動きとMACDヒストグラムの間の強気および弱気のダイバージェンスを正確に識別します。使用する指数移動平均(EMA)の期間は、5(速い)、34(遅い)、および信号線の期間は5です。このインジケーターは、モメンタムが弱まるポイントを強調表示し、トレンドの反転の可能性を示唆します。 正しいダイバージェンスの識別ルール: 強気のダイバージェンスは、価格がより低い安値を形成し、MACDヒストグラムがゼロラインの上で同時により高い安値を形成する場合に有効です。 弱気のダイバージェンスは、価格がより高い高値を形成し、MACDヒストグラムがゼロラインの下で同時により低い高値を形成する場合に有効です。 ヒストグラムの極値と価格の極値がゼロラインの同じ側に一致していない場合、ダイバージェンス信号は無効となります。これは誤った信号を引き起こす可能性があります。 このアプローチは、MACDダイバージェンス分析を適用するための最も正確で信頼性の高い方法です。 インジケーターの特徴: 確認された強気および弱気のダイバージェンスを明確にマークします。 MACDダイバージェンス検証ルール
FREE
このインジケーターは、市場で 関心が示されたゾーン をハイライトし、その後に 注文の蓄積ゾーン を表示します。 これは、大規模な**板情報(オーダーブック)**のように機能します。 これは、 巨大な資金 のためのインジケーターです。その性能は卓越しています。 市場にどんな関心が存在していても、 必ず目に見えるようになります 。 (これは 完全に再設計され、自動化されたバージョン です。もはや手動分析は必要ありません。) トランザクションスピード(取引速度) は新しい概念のインジケーターで、市場で大口注文が どこに・いつ 集中しているかを示し、それに基づいたチャンスを提供します。 トレンドの変化を 非常に早い段階 で察知することができます。 FXでは「出来高」と呼ばれているものは誤解されています。実際には、これは 時間あたりの価格変動量 です。したがって、正しい名称は トランザクションスピード です。 考え方・行動・分析の仕方すべてが問われます。 分析パラダイムの転換は非常に重要です。 このインジケーターは、FXにおける出来高の考え方を 根本から再定義 し、論理的な形で正確に活用する、
Meravith
Ivan Stefanov
5 (3)
マーケットメーカーのためのツール。 Meravith は次の機能を提供します: すべての時間足を分析し、現在有効なトレンドを表示します。 強気と弱気の出来高が等しくなる流動性ゾーン(出来高均衡)を強調表示します。 異なる時間足のすべての流動性レベルをチャート上に直接表示します。 テキスト形式の市場分析を生成し、参考情報として表示します。 現在のトレンドに基づいて目標値、サポートレベル、ストップロスを計算します。 取引のリスクリワード比を算出します。 口座残高に基づいてポジションサイズを計算し、潜在的な利益を推定します。 また、市場に大きな変化があった場合には警告を表示します。 インジケーターの主要ライン: 強気/弱気の出来高エグゾーストライン ― 目標値として機能します。 市場のトレンドを示すライン。市場が強気か弱気かによって色が変わり、トレンドのサポートとして機能します。主にその色が市場センチメントを示します。 出来高均衡ライン(Eq)。Eq(Volume Equilibrium)ラインはシステムの中核です。これは買い手と売り手の出来高のバランスポイントを表します。市場の流動性を示し
このインジケーターは、MetaTrader 4 および 5 用のインタラクティブなエリオット波動ラベリングツールです。 チャート上のメニューから、ラベルのサイズ、色、波動の種類(ABC修正波、5波のインパルス、またはWXY構造)を選択し、チャート上に直接波動ラベルを手動で配置することができます。 チャートを1回クリックするだけで、選択した価格と時間の位置に適切な波動ラベルが順番に配置され、エリオット波動構造を視覚的に整理・把握するのに役立ちます。 気に入ったら評価してください! このインジケーターは、MetaTrader 4 および 5 用のインタラクティブなエリオット波動ラベリングツールです。 チャート上のメニューから、ラベルのサイズ、色、波動の種類(ABC修正波、5波のインパルス、またはWXY構造)を選択し、チャート上に直接波動ラベルを手動で配置することができます。 チャートを1回クリックするだけで、選択した価格と時間の位置に適切な波動ラベルが順番に配置され、エリオット波動構造を視覚的に整理・把握するのに役立ちます。 気に入ったら評価してください!
FREE
Meravith Autoは、Meravithトレーディングシステムの自動化バージョンです。 このインジケーターは、色が変化するトレンドラインで構成されています。強気のときは緑色、弱気のときは赤色になります。これはトレンドのサポートラインです。強気の出来高と弱気の出来高が等しくなる流動性ライン。三重の強気デビエーションライン。三重の弱気デビエーションライン。大きな出来高を示す紫色と青色のドット。紫色のドットは平均出来高より2つのデビエーション分大きい出来高を示し、青色のドットは2つのデビエーションを示します。 使い方は? 強気のトレンドラインと、トレンドラインの上にある流動性は強気トレンドを示します。市場は上昇すると予想されます。ロングポジションを開きます。 弱気のトレンドラインと、トレンドラインの下にある流動性は弱気トレンドを示します。市場は下落すると予想されます。ショートポジションを開きます。 他のインジケーターと自由に組み合わせて使用できます。 どの通貨ペア、どの時間足でも使用できます。 ブローカーが提示する出来高の違いにより、結果が異なる場合があります。 出来高が多いため、大
RSI Divergence Pulse は、ダイバージェンス検出、マルチタイムフレーム分析、視覚ツールを1つの軽量アプリケーションに統合した包括的なRSIインジケーターです。RegularおよびHiddenダイバージェンスを自動的に識別し、ライブマルチタイムフレームRSIパネルを表示し、OB/OSゾーンを視覚的に認識しやすく塗りつぶし、価格チャートとRSIサブウィンドウの両方にダイバージェンス線を描画し、Buy/Sell矢印を配置し、リアルタイムアラートを提供します。 Features Color-Coded RSI Line RSIラインは現在のゾーンに基づいて色が変わります。青は中立ゾーン(30〜70)を示します。緑はオーバーボートゾーン(70以上)を示します。赤はオーバーソールドゾーン(30以下)を示します。 RSI Signal Line RSIのSMA(デフォルト期間9)がシグナルラインとして機能します。RSIとシグナルのクロスオーバーがタイミング情報を提供します。差分(Diff)はダッシュボードに表示されます。 Automatic Divergence Detectio
Horizont は、エントリーポイント、ターゲット1、ターゲット2、ストップロスを含む完全なトレードセットアップを提供するトレーディングシステムです。これらはすべて自動で計算されます。 システムは市場の高値と安値を自動的に検出し、それらを結んで現在のトレンドを定義します。どのトレンドで取引するかを選択すると、Horizont が対応するエントリー、ターゲット、ストップのレベルを生成します。 本システムには自動リスク管理機能が含まれています。口座残高を確認し、リスクを計算したうえで、適切なポジションサイズを提案します。リスクリワード比(R:R)は第1ターゲットに対してのみ表示されます。 計算は即時に行われます。ほかの取引機会を探したい場合は、通貨パネルをクリックして銘柄を切り替え、より良い R:R 比率を探すことができます。 本システムは主に Forex に焦点を当てていますが、金属、指数、暗号資産の取引も可能です(現在はベータ版であり、すべてのブローカーに対応しているとは限りません)。 システムは各セットアップごとに評価付きのシグナルを生成します。シグナルは星1つ、2つ、3つで評価さ
市場のボラティリティに応じて計算期間を自動的に調整し、より正確な買われ過ぎ・売られ過ぎのシグナルを提供する高度なモメンタム・オシレーターです。 仕組み このインジケーターは適応型の期間計算を使用しており、ボラティリティが高いときは期間を短くし、低いときは期間を長くします。この動的な調整により、トレンド相場ではより速いシグナルを提供し、レンジ相場ではダマシを減らします。 RSI の値はこの可変期間に基づいて計算されるため、現在の市場状況により敏感に反応します。従来の 30(売られ過ぎ)と 70(買われ過ぎ)の水準を使用しますが、適応型であるため、これらの水準に到達する際の重要性が高まります。 主な特徴: 市場のボラティリティに基づいて計算期間を自動調整 売買タイミングを示す矢印をチャートに表示 カラーオシレーター:50 以上は緑、50 未満は赤 トレンド相場での高速な反応 レンジ相場でのダマシの減少 リペイントなしのインジケーター ― ローソク足確定後に値は固定 すべての時間足およびすべての市場で使用可能
FREE
このインジケーターは、MetaTrader 4 および 5 用のインタラクティブなエリオット波動ラベリングツールです。 チャート上のメニューから、ラベルのサイズ、色、波動の種類(ABC修正波、5波のインパルス、またはWXY構造)を選択し、チャート上に直接波動ラベルを手動で配置することができます。 チャートを1回クリックするだけで、選択した価格と時間の位置に適切な波動ラベルが順番に配置され、エリオット波動構造を視覚的に整理・把握するのに役立ちます。 気に入ったら評価してください! このインジケーターは、MetaTrader 4 および 5 用のインタラクティブなエリオット波動ラベリングツールです。 チャート上のメニューから、ラベルのサイズ、色、波動の種類(ABC修正波、5波のインパルス、またはWXY構造)を選択し、チャート上に直接波動ラベルを手動で配置することができます。 チャートを1回クリックするだけで、選択した価格と時間の位置に適切な波動ラベルが順番に配置され、エリオット波動構造を視覚的に整理・把握するのに役立ちます。 気に入ったら評価してください!
FREE
価格のみに基づいてレベルを計算する、非常に珍しいインジケーターの一つです。このインジケーターは、時間足やトレンド、市場サイクルの影響を受けません。これまでに作られた中で最も論理的なインジケーターの一つです。 FIFTY インジケーターは、現在自動化バージョンとして登場し、レベルを手動で描画する必要がなくなりました。このバージョンでは、日足・週足・月足・年足のレベルが自動でチャートに描画され、正確さと時間の節約を実現します。さらに、各レベルの表示を切り替えるためのボタンも用意されており、完全にカスタマイズが可能です。手動を好む方のために、無料版も引き続き利用可能で、十分に機能します。トレーダーは自分の取引スタイルに応じて、手動と自動のツールを選ぶことができます。 非常に信頼性が高く、強くおすすめします!手動版の FIFTY インジケーターをご希望の方は、お問い合わせください
このインディケータは、選択した期間における強気と弱気の不均衡を測定し、2 点間の直線を示す。 強気派が弱気派より出来高が多ければ、線は緑色に変わる。 ベアの方が出来高が多い場合、線は赤になる。 線は、出来高の差のパーセンテージも示します。 このインジケーターは、同じデータを別ウィンドウで表示します。また、分割された出来高を見ることもできます。 このインジケーターには2つのモードがあります。 そのために、左上にボタンがあります、  - ボタンを押さなければ、市場の任意のポイントと現在の価格との間の不均衡を測定します。 - ボタンを押すと、市場の任意の2点間のバランスを測定できます。 このインディケータは、選択した期間における強気と弱気の不均衡を測定し、2 点間の直線を示す。 強気派が弱気派より出来高が多ければ、線は緑色に変わる。 ベアの方が出来高が多い場合、線は赤になる。 線は、出来高の差のパーセンテージも示します。 このインジケーターは、同じデータを別ウィンドウで表示します。また、分割された出来高を見ることもできます。 このインジケーターには2つのモードがあります
このインディケータは、外為市場のティックボリュームを強気と弱気に効果 的に分けます。  さらに、選択した任意の期間の強気と弱気のティックボリュームの合計を計算し、表示する機能を提供します。  チャート上の2本の青い線を動かすことで簡単に期間を調整でき、お客様の取引ニーズに合わせたカスタマイズ可能で正確な出来高分析が可能です。  もしお役に立つようでしたら、レビューをお寄せください!  それでは、良いお取引を! このインディケータは、外為市場のティックボリュームを強気と弱気に効果 的に分けます。 さらに、選択した任意の期間の強気と弱気のティックボリュームの合計を計算し、表示する機能を提供します。 チャート上の2本の青い線を動かすことで簡単に期間を調整でき、お客様の取引ニーズに合わせたカスタマイズ可能で正確な出来高分析が可能です。 もしお役に立つようでしたら、レビューをお寄せください! それでは、良いお取引を!
FREE
2 SNAKES  is a first class scalping system. As the entries are quite precise, you are likely to become addicted to this system very quickly.  You have 2 snakes. When you see a candle above or below them that does not touch them - that is your scalping signal. Then buy or sell at the green line or close. If you use a larger time frame, scalping can become trend following. The snakes are calculated precisely in relation to the current state of the market. They ARE NOT moving averages.  You decide
Levelss
Ivan Stefanov
5 (1)
LEVELSSインディケータが示す: - 日足の強気ゾーンと弱気ゾーン。毎日00:00から23:59まで表示。 - 週足の強気・弱気ゾーン。毎週月曜日0:00から金曜日23:59まで表示されます。 - 特定のタイムフレームから特別に計算されたチャネルで、他のすべてのタイムフレームに表示されます。デフォルトでは、これは4時間のタイムフレームで、取引したい他のタイムフレームに変更することができます。これはノンストップで計算されます。 画面の左上には、ゾーンとチャネルが強気、弱気、中立のいずれであるかが表示されています。この3つすべてが強気の場合、現在のローソク足に緑の点が表示されます。3つとも弱気の場合、ピンクの点が表示されます。 このインディケータに制限はありません。
GANNの正確な目標は、彼の時代を超えた方法に基づいて計算され、目の前に提示されます。このツールは、取引をよりスムーズで直感的にするために設計されています。白いラインを上に、または緑のラインを下に動かすことで、なぜGANNの技法が取引の世界で今なお影響力を持っているのかがすぐにわかるでしょう。 GANNの戦略は、市場の動きを高精度で予測することに焦点を当てており、このツールはその力をあなたの手元に提供します。経験豊富なトレーダーであっても、初心者であっても、ラインを操作することで、彼の手法がなぜ時の試練に耐えてきたのかを深く理解することができるでしょう。 GANNの正確な目標は、彼の時代を超えた方法に基づいて計算され、目の前に提示されます。このツールは、取引をよりスムーズで直感的にするために設計されています。白いラインを上に、または緑のラインを下に動かすことで、なぜGANNの技法が取引の世界で今なお影響力を持っているのかがすぐにわかるでしょう。 GANNの戦略は、市場の動きを高精度で予測することに焦点を当てており、このツールはその力をあなたの手元に提供します。経験豊富なトレーダーであっ
Sense
Ivan Stefanov
5 (2)
SENSEは、厳選されたGANN手法とフラクタル計算を組み合わせた自動システムです。このシステムは、どこで取引を開始し、どこで決済するかを教えてくれます。もう複雑な計算に時間を費やす必要はありません。インジケータをインストールするだけです。 基本原則: 価格が白い線の上にある時、市場は強気である。 白い線の上で買い、下で止める 緑線は上値目標 白い線より下にあるときは弱気。 白い線より下で売り、上で止める。 赤線は下値目標 緑または赤の線が二重になっている場合は、強いエリアであることを示す。 なぜSENSEなのか? 利益目標 SENSEは自動的に利益確定のターゲットを設定し、取引の成功を最大化するお手伝いをします。 自動適応: このインディケータは、どのような時間枠に対しても自動的に再計算を行い、手動で調整する必要なく、正確で信頼性の高いシグナルを提供します。 スキャルピングにも最適です。 デモをチェック
The indicator displays support and resistance zones defined logically using the MACD. The entire concept is explained in the video, with specific examples shown. The indicator works on any instruments and timeframes. It does not repaint. After placing it on the chart, please go through all the timeframes sequentially, from monthly to 1-minute, so that all lines load correctly. After that, you can start using it. The concept is unique and has not been seen in other systems or indicators.
FIFTYインジケーターは、手動でレベルを描画する必要がない自動バージョンを提供するようになりました。このバージョンでは、日次、週次、月次、年次のレベルが自動的にチャート上に描画され、精度を確保しながら時間を節約できます。さらに、これらのレベルの表示を切り替えるボタンが用意されており、完全なカスタマイズが可能です。手動操作を好む方のために、無料版のインジケーターも引き続き利用可能で、完全な機能を備えています。トレーダーは、自分の取引スタイルに応じて手動ツールと自動ツールを選択できます。 最も論理的なインジケーターの一つ。 高い信頼性。 FIFTYインジケーターは、手動でレベルを描画する必要がない自動バージョンを提供するようになりました。このバージョンでは、日次、週次、月次、年次のレベルが自動的にチャート上に描画され、精度を確保しながら時間を節約できます。さらに、これらのレベルの表示を切り替えるボタンが用意されており、完全なカスタマイズが可能です。手動操作を好む方のために、無料版のインジケーターも引き続き利用可能で、完全な機能を備えています。トレーダーは、自分の取引スタイルに応じて手動ツ
「Naturu(ナチュル)」は自然の対称性をアルゴリズムとして用いる手動インジケーターです。 シンプルな戦略と隠された知恵でマーケットを制覇しましょう! インジケーターを読み込むと、上側(Top)と下側(Bottom)の2本のラインが表示されます。 ラインを一度クリックするとアクティブ化され、移動させたいローソク足をクリックするだけでその位置に移動できます。 高値ポイントと安値ポイントを設定すると、インジケーターが自動的に以下を計算します: マゼンタのゾーン:ブル(買い勢)とベア(売り勢)の関心が最も接近する、サポート/レジスタンスになりやすいエリア グレーのゾーン:次に注目されるエリア アクア色のライン:ブルの価格目標 ゴールド色のライン:ベアの価格目標 手動インジケーターは完全なコントロールと柔軟性を提供し、リアルタイムの相場状況や個人の直感に応じてラインを調整できます。 価格の動きを自ら深く分析することで、サポートやレジスタンス、チャートパターンの形成を本質的に理解できます。 人間の判断を活かすことで、自動システムが誤認しがちなノイズを除去し、誤シグナルを減らします。 また、自
Meravith Autoは、Meravithトレーディングシステムの自動化バージョンです。 このインジケーターは、色が変化するトレンドラインで構成されています。強気のときは緑色、弱気のときは赤色になります。これはトレンドのサポートラインです。強気の出来高と弱気の出来高が等しくなる流動性ライン。三重の強気デビエーションライン。三重の弱気デビエーションライン。大きな出来高を示す紫色と青色のドット。紫色のドットは平均出来高より2つのデビエーション分大きい出来高を示し、青色のドットは2つのデビエーションを示します。 使い方は? 強気のトレンドラインと、トレンドラインの上にある流動性は強気トレンドを示します。市場は上昇すると予想されます。ロングポジションを開きます。 弱気のトレンドラインと、トレンドラインの下にある流動性は弱気トレンドを示します。市場は下落すると予想されます。ショートポジションを開きます。 他のインジケーターと自由に組み合わせて使用できます。 どの通貨ペア、どの時間足でも使用できます。 ブローカーが提示する出来高の違いにより、結果が異なる場合があります。 出来高が多いため、大手
RSI Divergence Pulse — Smart Divergence Scanner with MTF Panel, Zone Fill, Alerts & Dashboard SHORT DESCRIPTION Professional RSI indicator with automatic Regular & Hidden divergence detection, color-coded RSI line, Multi-Timeframe panel, OB/OS zone fills, Buy/Sell arrows, signal labels, real-time dashboard, and multi-channel alerts. Works on any symbol and timeframe. FULL DESCRIPTION
Enigmera MT5
Ivan Stefanov
3.67 (3)
ENIGMERA:市場の核心 (これは手動インジケーターであり、MetaTrader の現在のテスト環境では一部の機能がサポートされない場合があります) イントロダクション このインジケーターおよびトレーディングシステムは、金融市場に対する独自のアプローチを提供します。ENIGMERA はフラクタルサイクルを利用して、サポートおよびレジスタンスレベルを正確に算出します。実際の蓄積フェーズを示し、方向性と目標を明確にします。トレンド相場でも調整局面でも機能するシステムです。 仕組み インジケーターのほとんどの機能は、チャート左側のボタンを通じて操作され、市場の変化に素早く対応できます。 ボタン ON/OFF – インジケーター全体の表示/非表示を切り替えます。 Support – トレンドのメインサポートライン。 Ch – サポートチャネルを有効にし、許容される乖離範囲を示します。 Dev1(第1偏差)– サポート範囲内の価格変動を示し、市場の停滞またはエネルギー蓄積を示唆します。 Dev2(第2偏差)– 偏差間の価格変動を示し、トレンド形成と方向性を示します。 Dev3(第3偏差)–
伝説のウィリアム・ギャン(William Gann)レベルを完全自動で表示するMT5用インジケーター。GANN Masterは日足・週足・月足のデータに基づき、価格が反転またはトレンド継続しやすい重要ゾーンを瞬時にプロットします。 主な機能 ワンクリック期間選択 :Daily/Weekly/Monthlyボタンをクリックするだけで、当日・当週・当月のゾーンを即時表示 自動&手動モード 自動モード :GANN Masterがスイング高値・安値を自動検出し、すべてのギャンレベルを計算 手動モード :チャート上のTopラインとBottomラインをドラッグして任意のスイングポイントを設定、レベルが即座に再計算 強気/弱気レベル :買い/売りそれぞれのレベルを表示。線が接近すると強固なサポート/レジスタンスゾーンを示唆 幅広い銘柄対応 :Forex、貴金属(例:ゴールド)、株価指数、暗号資産など高額商品にも対応。設定でアセットクラスを切り替えるだけでスケールと乗数が自動調整 ユーザーフレンドリーなインターフェース :鮮やかな配色、見やすいラベル、直感的なボタン操作でリアルタイムにレベルを調整 ト
SPEKULATORは、重要なサポートゾーンと市場の方向性を特定するのに役立つ手動取引システムおよびインジケーターです。 シンプルな戦略と隠れた知恵で市場をマスターしましょう。 グラフ上で任意のトップ(TOP)とボトム(BOTTOM)を選択すると、インジケーターは次のように描画します: あなたのトレンドに対するサポートゾーン。 強気トレンドの場合、緑色のゾーンが表示され、弱気トレンドの場合、赤色のゾーンが表示されます。サポートゾーンの感度はインジケーターの設定で調整可能です。このゾーンは、選択したトレンドに基づいてサポートが現れる可能性のある場所を示します。 高い偏差線と低い偏差線 W.D. ガンの9のスクエアに基づいて計算された角度線 取引に入るタイミング: 高い偏差線を上に突破した場合、ロングポジションを取ります。 低い偏差線を下に突破した場合、ショートポジションを取ります。 市場が偏差線の間にある場合、その間で買いと売りを行いながら、サポートゾーンを尊重します。 ガンの角度線は利益確定ゾーンとしてガイドラインとして使用されます。 360度線が重要なレベルです: 価格がその上にある
Naturu
Ivan Stefanov
5 (1)
「Naturu(ナチュル)」は自然の対称性をアルゴリズムとして用いる手動インジケーターです。 シンプルな戦略と隠された知恵でマーケットを制覇しましょう! インジケーターを読み込むと、上側(Top)と下側(Bottom)の2本のラインが表示されます。 ラインを一度クリックするとアクティブ化され、移動させたいローソク足をクリックするだけでその位置に移動できます。 高値ポイントと安値ポイントを設定すると、インジケーターが自動的に以下を計算します: マゼンタのゾーン:ブル(買い勢)とベア(売り勢)の関心が最も接近する、サポート/レジスタンスになりやすいエリア グレーのゾーン:次に注目されるエリア アクア色のライン:ブルの価格目標 ゴールド色のライン:ベアの価格目標 手動インジケーターは完全なコントロールと柔軟性を提供し、リアルタイムの相場状況や個人の直感に応じてラインを調整できます。 価格の動きを自ら深く分析することで、サポートやレジスタンス、チャートパターンの形成を本質的に理解できます。 人間の判断を活かすことで、自動システムが誤認しがちなノイズを除去し、誤シグナルを減らします。 また、自分
フィルタ:
onermentes
19
onermentes 2025.06.17 18:57 
 

Yaklaşık olarak 10 yıldır forex piyasasında işlem yapmaktayım. Pek çok indikatör taradım ve aldım. Neredeyse bir çoğu çöptü diyebilirim. Enigmera indikatörden ziyade bir starteji yapmamı sağlamakta. Girmiş olduğum pozisyonlarda korkumu yenmeme katkı sağladı. Daha önce erken kapatmak zorunda olduğum pozisyonlarda bearish veya bullish hedefler neredeyse tam anlamıyla doğru çalışmakta ve buna bağlı olarak pozisyonlarımı daha uzun tutabilme güvenini sağladı. Özellikle support line çok ciddi olarak destek veya direnç olarak çalışmakta. Para yapmanıza kesinlikle katkı sağlayacaktır. Ivan teşekkür ederim.

TANJU2690
614
TANJU2690 2025.03.05 13:37 
 

I have never and ever seen any system like Enıgmera. What ever you want, you can find on it. İt is incredible system. And Cretor of aenıgmera, Mr.Ivan is more and more helpfull to understant of logıc Enigmera. Fistly, I want sent all thankfull to Ivan because he teach me Enıgmera Logıc and also share this marvelous product with market

smso9466eiou
187
smso9466eiou 2025.02.23 15:38 
 

a very good indicator that composes all in one, entry, exit and reverse. Great!

Ivan Stefanov
7211
開発者からの返信 Ivan Stefanov 2025.02.23 18:12
Thank you! Wishing you profits!
Rutt Tungkiratichai
2900
Rutt Tungkiratichai 2025.02.01 00:11 
 

This is very good and accurate indicator.

Ivan Stefanov
7211
開発者からの返信 Ivan Stefanov 2025.02.01 11:30
Thank you for the good words! Brgds / Ivan
Osazeme Usen
654
Osazeme Usen 2024.12.31 12:38 
 

This is probably the best indicator I have seen in marketplace. Fantastic analysis with phenomenal success rates.

Update: Not great for direction, but fantastic for TP and SL.

Ivan Stefanov
7211
開発者からの返信 Ivan Stefanov 2025.01.02 16:45
Osazeme Usen 2024.12.31 12:38 # EN
This is probably the best indicator I have seen in marketplace. Fantastic analysis with phenomenal success rates. Thank you for the good words! Brgds/Ivan
vincenzo1964
1165
vincenzo1964 2024.07.11 15:59 
 

Assolutamente straordinario a cominciare da chi l'ha ideato Ivan, Sono assolutamete felice dell'affito/prova fatto, Enigmera è sorprendente, ti accompagna sempre sul lato giusto della tendenza sino alla fine del percorso. Se poi parliamo del dott. Ivan e della sua disponbilità, se potessi postare gli screenshot e la guida passo passo che mi ha concesso, è commovente e sorprendente. Se volete fare buon trading con giudizio e responsabilità potete tranquillamente perdere qualche giorno del vostro tempo a capire la logica ed il ragionamento che c'è dietro enigmera, solo così sarete sempre dal lato giusto del trend sino alla fine, sopratutto quando ci sono le news ed enigmera già vi sta indicando i livelli di tp da raggiungere. Proprio oggi ero già lon su eurusd e sell su usdchf ed entrambe dopo le notizie chiuse in tp. Consiglio anche l'indicatore Speed, leggetene l'utilizzo, la forza e ciò che vi può indicare, io ci sto lavorando sodo seguito da ivan perchè l'unione di enigmera e speed è devastante, alla fine dell'affitto acquisterò engmera mentre affitterò mensilmente speed (il costo è di 30.00€ mentre l'acquisto è di 3000€), ma il suo potenziale per il trend followhing e immenso, saluti e buon trading a tutti, grazie Ivan...

Irfan
1582
Irfan 2024.06.21 13:44 
 

ユーザーは評価に対して何もコメントを残しませんでした

Ivan Stefanov
7211
開発者からの返信 Ivan Stefanov 2025.01.02 16:46
Irfan 2024.06.21 13:44 # EN
Enigmera gives you an entirely different way of looking at the market. It does not look into the past, what has happened in the past stays in the past it gives you a picture of what is going on in the market right now and gives you logical understanding for trading. The author is so confident about his product the he gave me a full version of the indicator so that I could try it for a week before I decided to buy it. Ivan spent a lot of time chatting with me, educating me how to use the indicator. He is very quick and replies to your questions. I have already seen good results with this indicator and it has increased my confidence. Thank you for the good words, Irfan!
Sajid Iqubal
184
Sajid Iqubal 2024.06.08 21:59 
 

Enigmera is an exceptional trading indicator that has greatly improved my trading performance. Ivan Stefano offers the best support and guidance, always going above and beyond like an elder brother to me. His guidance and the effectiveness of Enigmera make a winning combination. I highly recommend using Enigmera.

eman11
1555
eman11 2023.11.22 20:29 
 

ユーザーは評価に対して何もコメントを残しませんでした

Ivan Stefanov
7211
開発者からの返信 Ivan Stefanov 2025.01.02 16:47
eman11 2023.11.22 20:29 # EN
I was an institutional trader for a decade and rarely write reviews or spend more then 50 or a 100 on any indicator as my trading is well established, but always open to something interesting and new. The author is an intelligent and real trader , per many chats with him, and this indicator compliments well existing trading as is from a unique perpective. The price is not cheap , but it it is a legit and unique system, is as decribed, which can be put to good use particulalry with experienced traders who may best integrate multiple styles and ideas successfully. Great work Ivan. Thank you for the good words, Eman11 / Brgds / Ivan
ebel
1221
ebel 2023.11.22 14:41 
 

This indicator is undoubtedly expensive but I believe it to be the Ferrari of indicators and the only one you will ever need. The video in the overview is self explanatory, take the time to find the setups as described and the R:R can be extremely good. I have only been using the indicator for a week but have found several very profitable trades and feel confident that I can make back more than sufficient each month to cover my 6 monthly rental. The author is extremely responsive and helpful and is starting a telegram group so that we can share prospective setups. I believe the indicator is difficult to get to work in Strategy Tester but the author is open to free trials which demonstrates his trust in the product. I can't post images here but I will post a trade I made this morning in the comments. I can't promise it is the perfect setup as I am still learning but just this one trade covered my monthly rental cost. IMPORTANT - do not try to change to a lower timeframe while the indicator is loaded. The code is incredibly complex and trying to recalculate everything on a lower tf over a significant period will freeze your MT4 installation. You will need to delete the indicator from your MT4, force a shut down, restart and re-install. Once you understand the complexity it is not a problem, just open another chart on a lower tf or delete the indicator, change the tf and put it back on.

UPDATE 23/11

I have just seen that the author has been debarred from selling! I have just paid for 6 months rental and this is a good indicator that is making me money. What to I do after 6 months if I can't renew? And why has this happened, the author is very courteous and helpful.

レビューに返信