Enigmera
- Indicadores
- Versão: 3.60
- Atualizado: 27 dezembro 2025
- Ativações: 20

ENIGMERA: O núcleo do mercado
Importante: A demonstração do MQL5.com funciona no Strategy Tester e pode não refletir completamente a funcionalidade do Enigmera. Verifique a descrição, as capturas de tela e o vídeo para mais detalhes. Fique à vontade para me enviar uma mensagem com qualquer dúvida!
O código do indicador foi completamente reescrito. A versão 3.0 adiciona novas funcionalidades e corrige erros acumulados desde o início do indicador.
Introdução
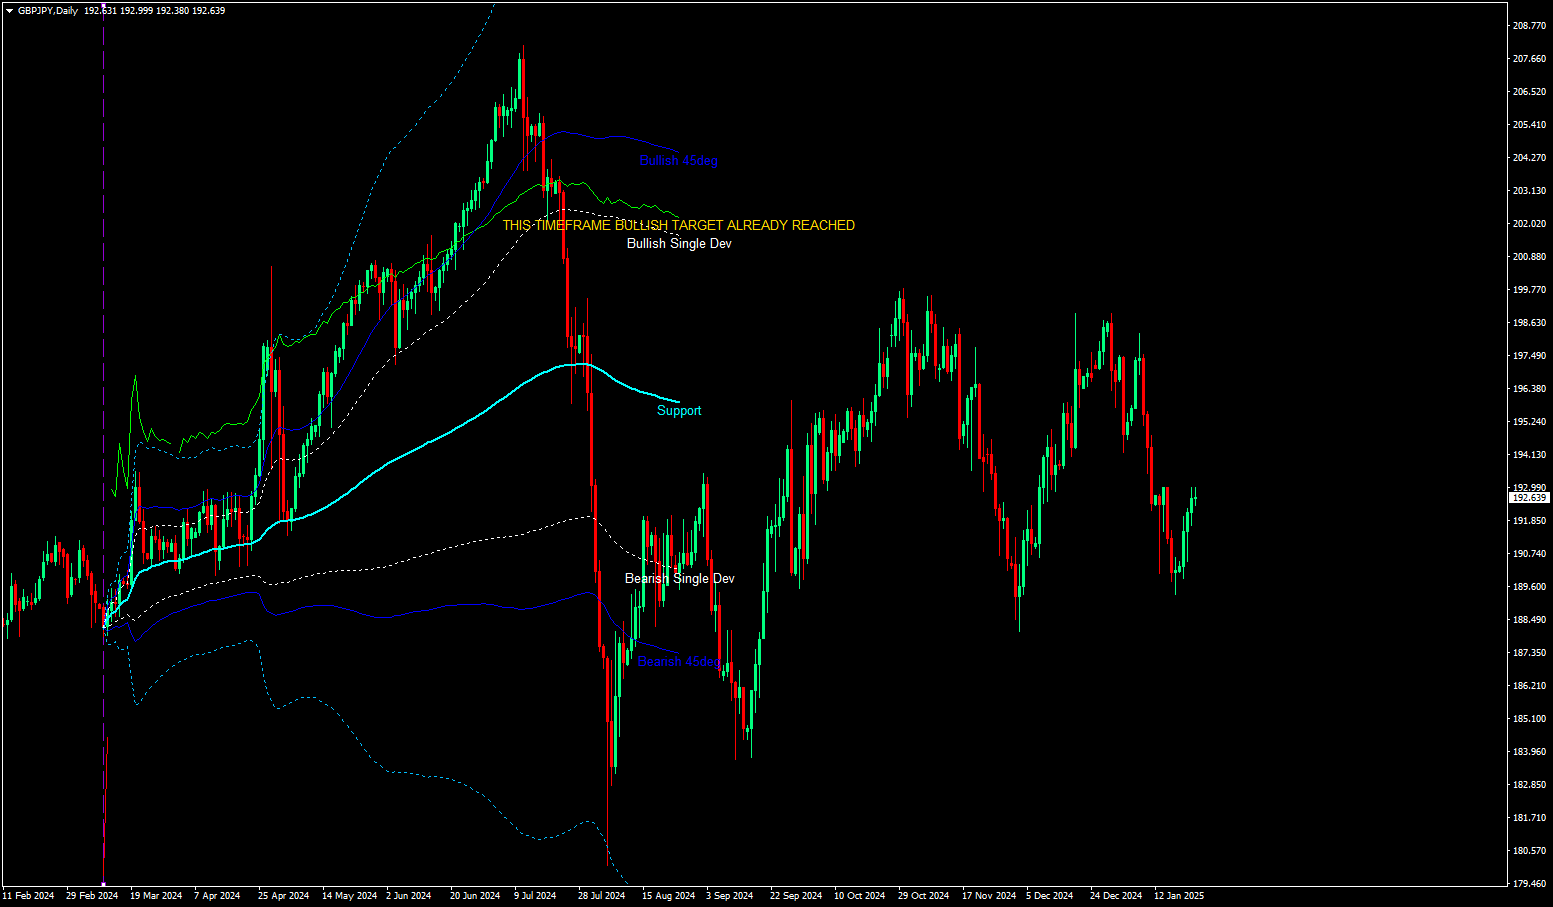
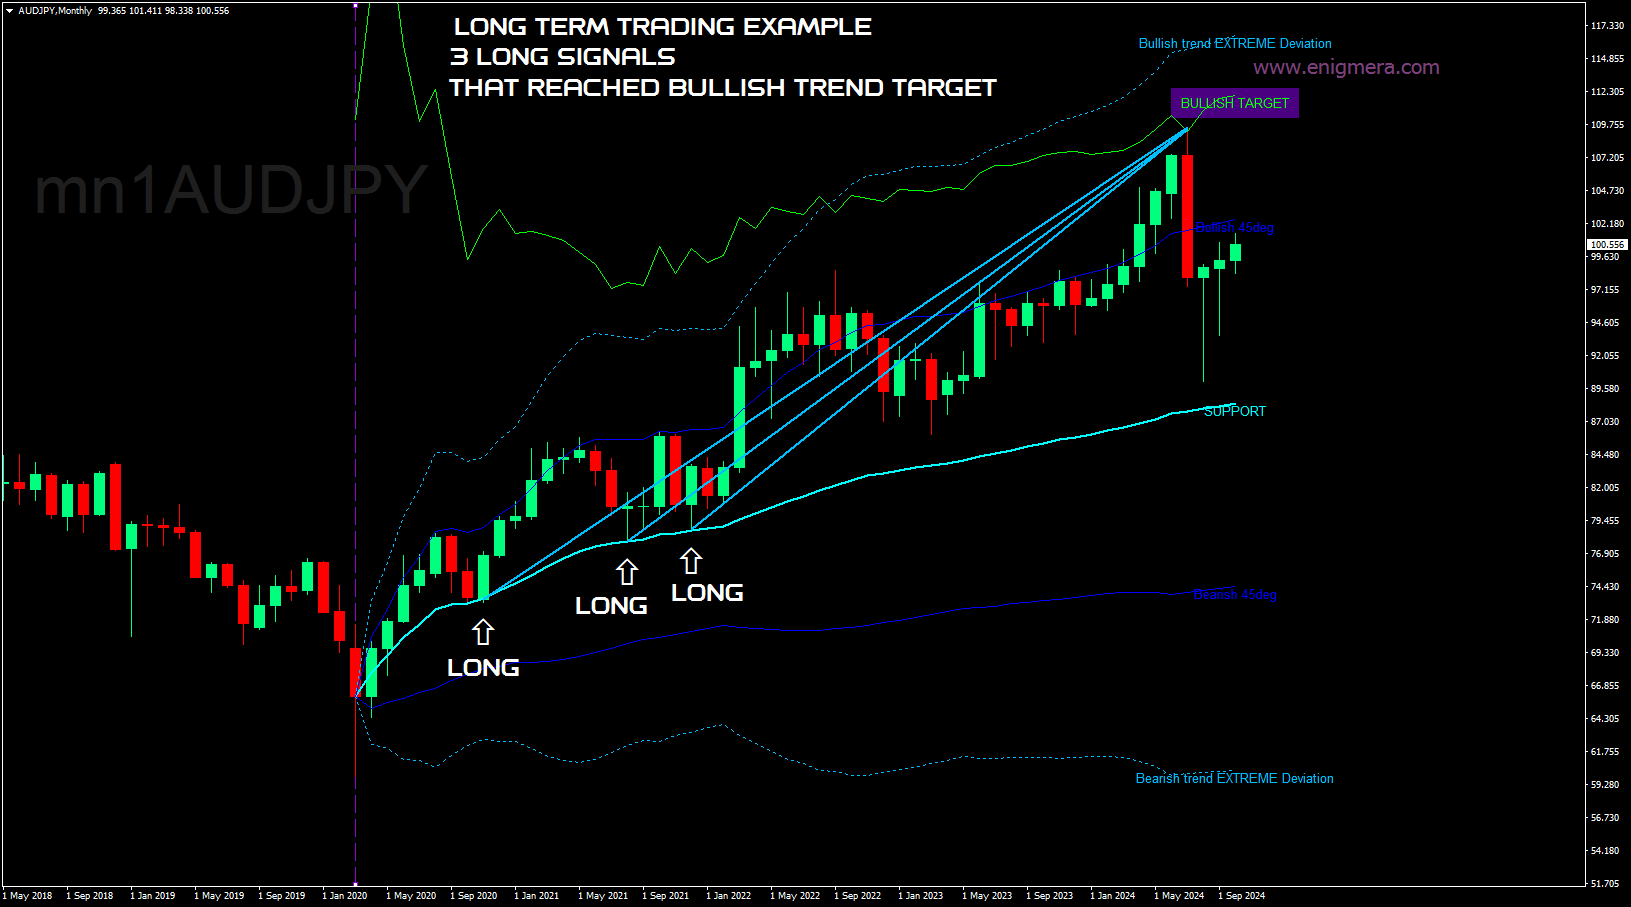
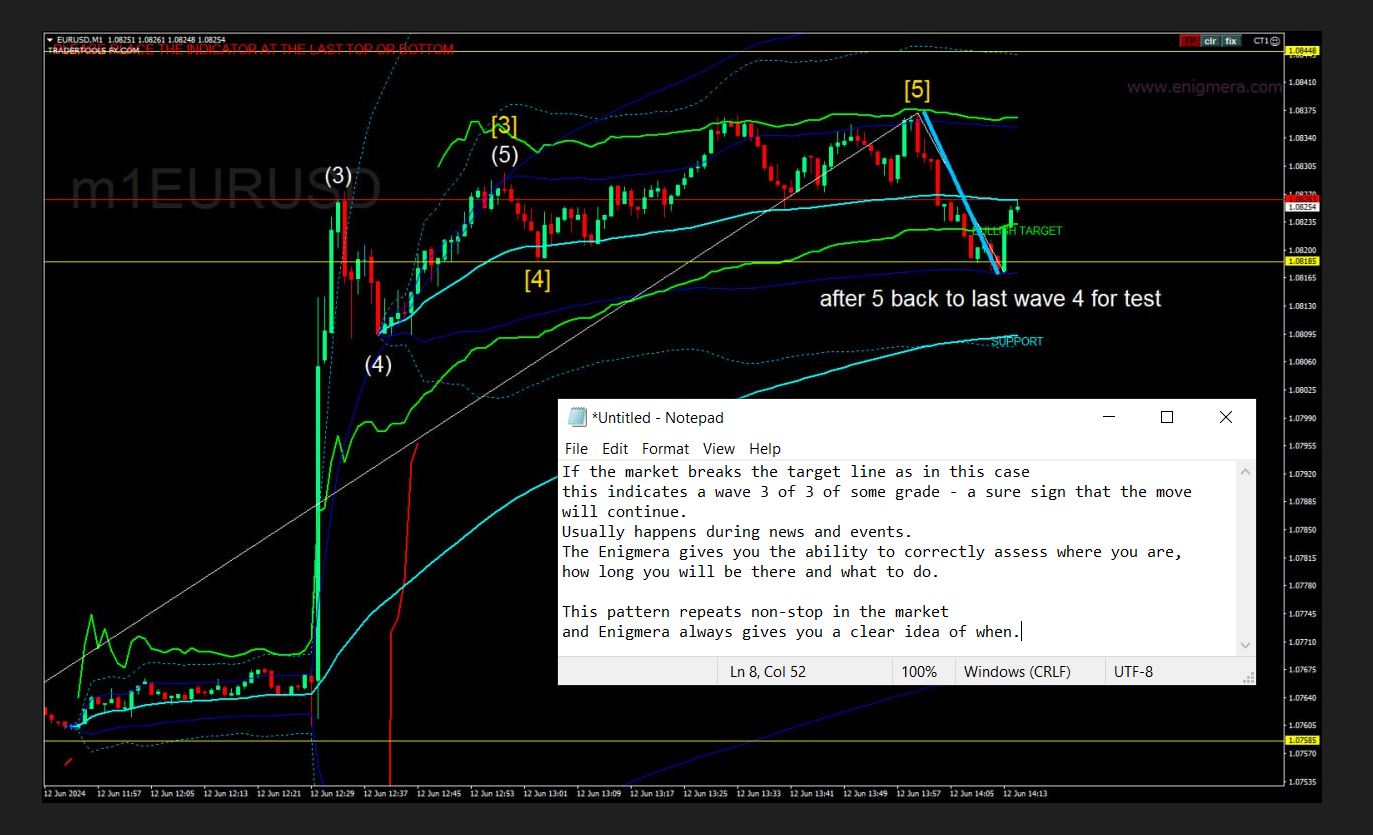
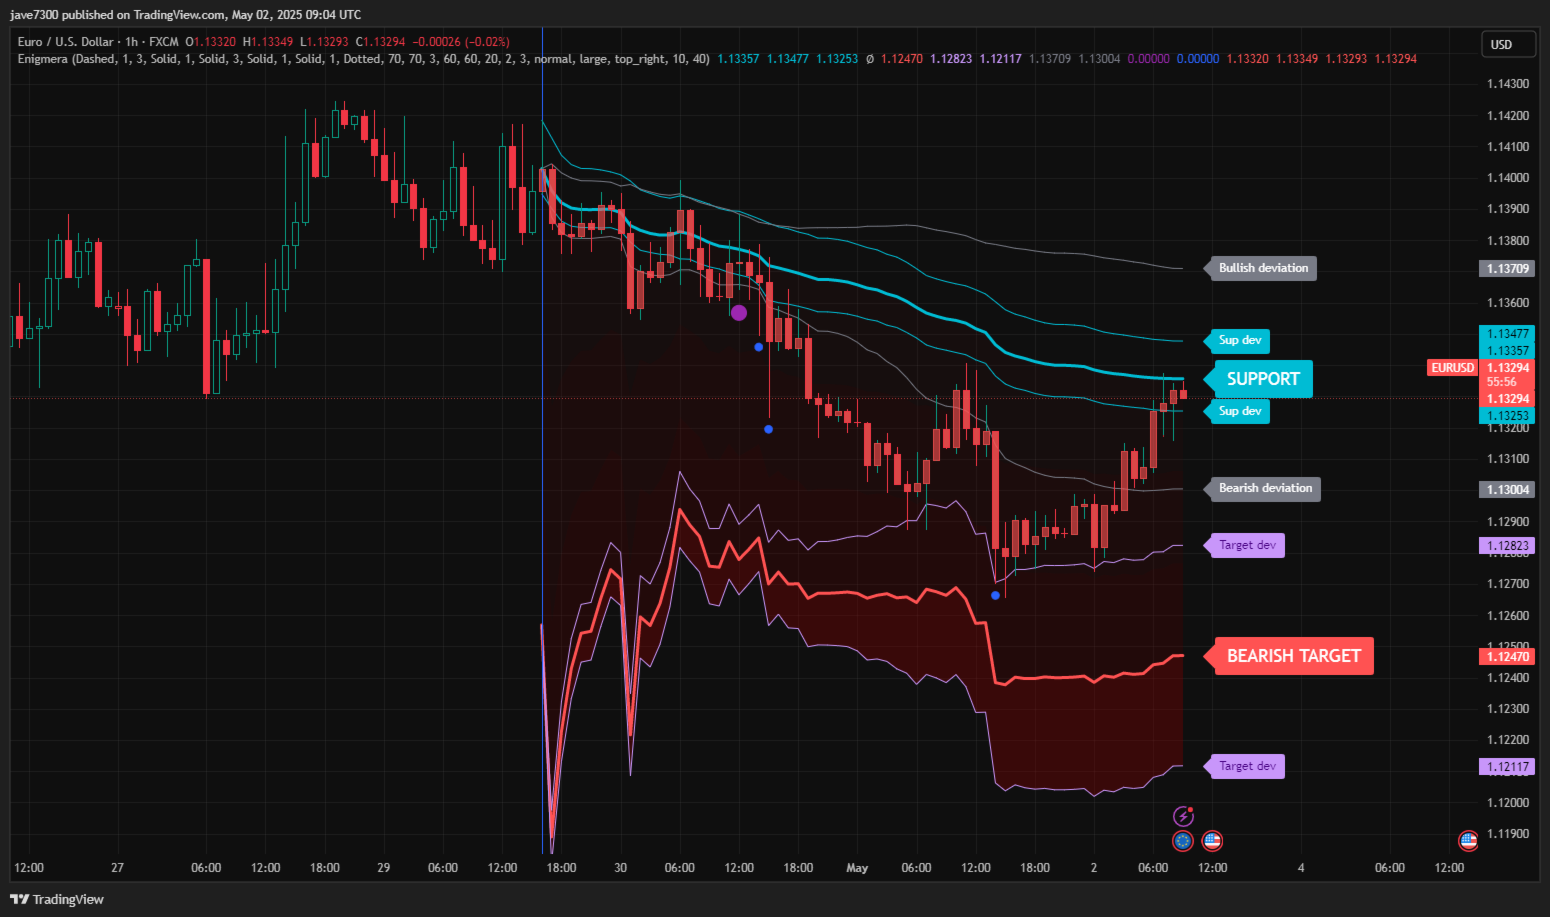
Este indicador e sistema de negociação é uma abordagem notável para os mercados financeiros. O ENIGMERA usa ciclos fractais para calcular com precisão os níveis de suporte e resistência. Ele mostra a fase autêntica de acumulação e fornece direção e metas. Um sistema que funciona tanto em tendência quanto em correção.
Como Funciona
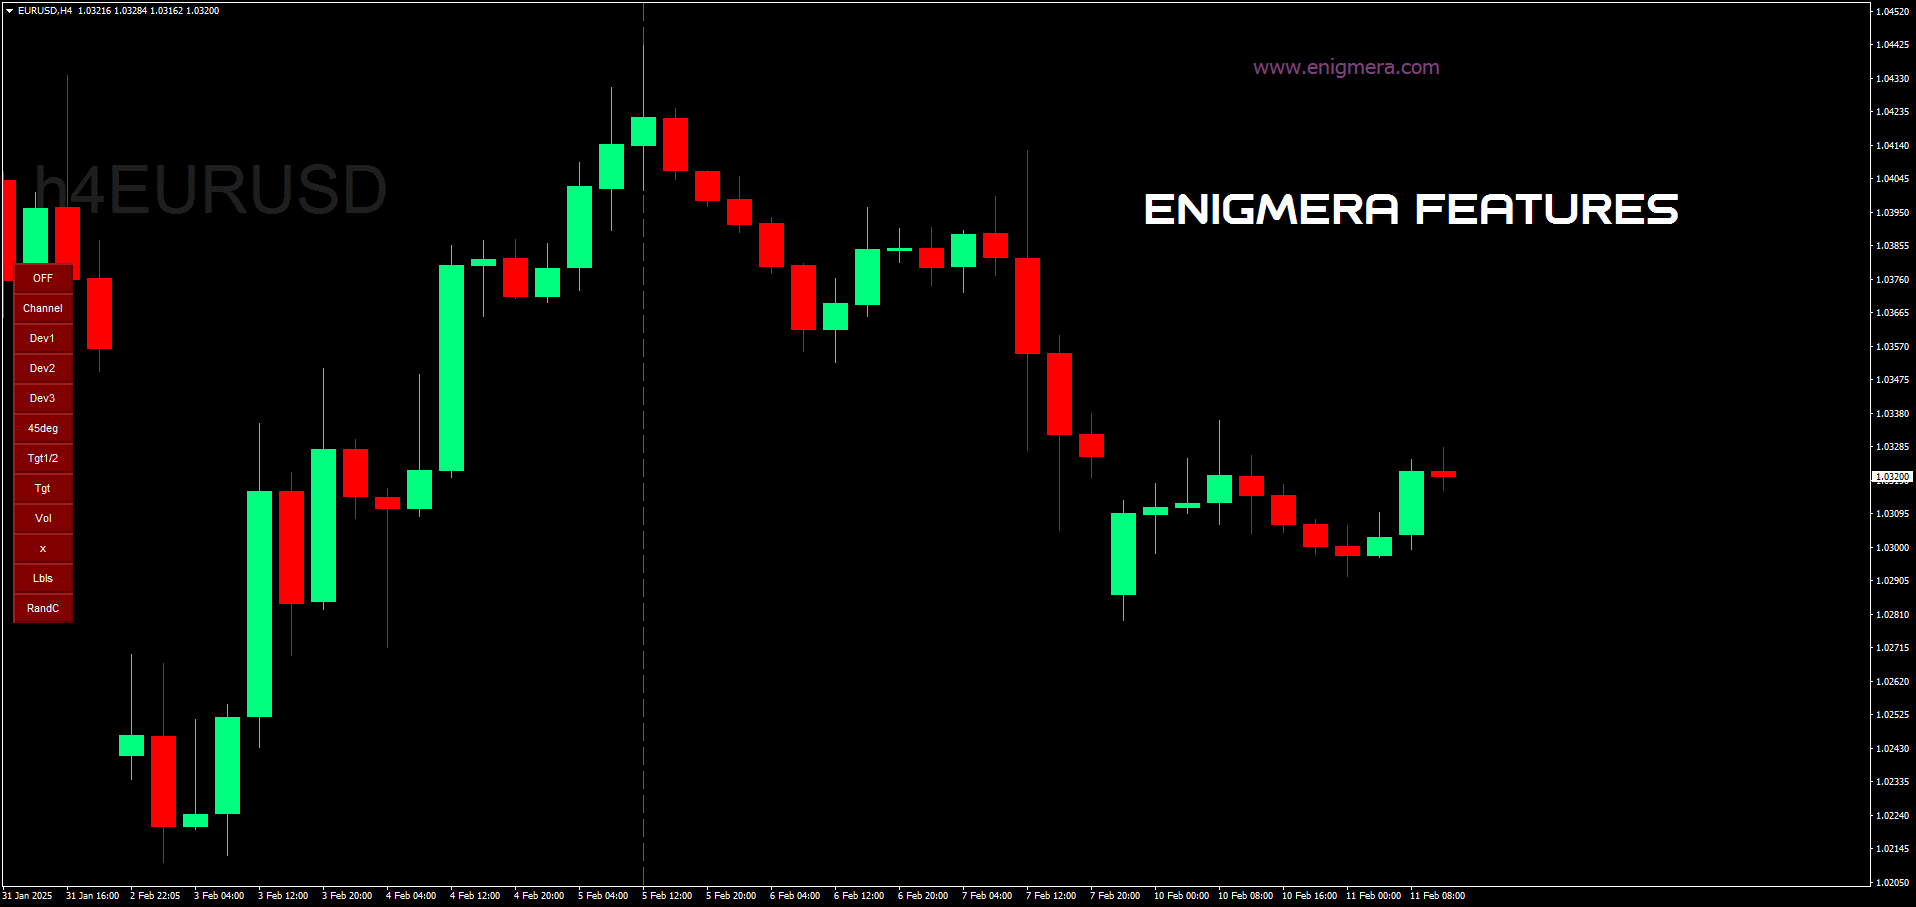
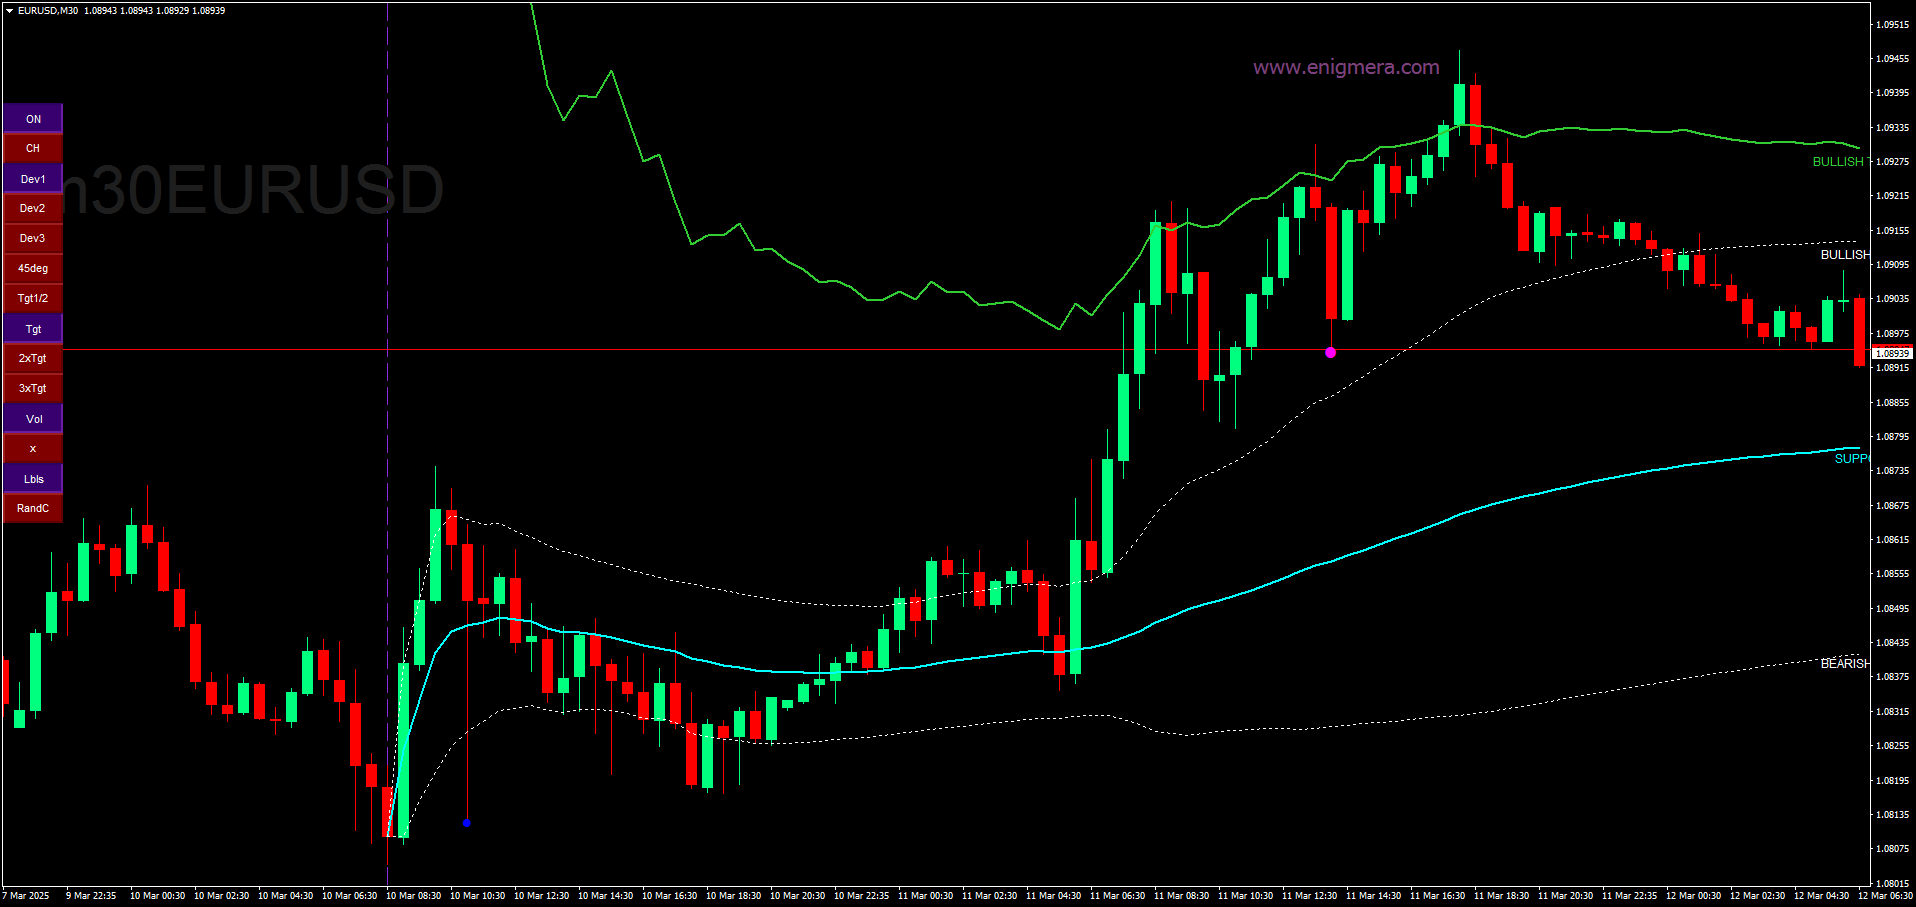
A maior parte da funcionalidade do indicador é controlada por botões no lado esquerdo do gráfico, permitindo uma resposta rápida a diferentes condições de mercado.
Botões
- ON/OFF – Exibe ou oculta o indicador inteiro.
- Channel – Ativa o canal de suporte, indicando um intervalo aceitável de desvio.
- Dev1 (Primeiro Desvio) – Indica o movimento do preço dentro do desvio de suporte, sinalizando consolidação do mercado ou acumulação de força.
- Dev2 (Segundo Desvio) – Mostra o movimento do preço entre os desvios, sinalizando a formação e direção da tendência.
- Dev3 (Terceiro Desvio) – Indica uma aceleração significativa da tendência e alta volatilidade.
- 45deg (45 Graus) – Mostra o ritmo do mercado e a estabilidade do movimento em relação à linha de 45 graus.
- Tgt1/2 (Meta Parcial) – Representa metade da linha de meta da tendência, usada na fase final do mercado.
- Tgt (Meta) – A linha de meta da tendência, indicando os níveis para fechar posições.
- Vol (Volume) – Exibe pontos de volume nas velas, indicando mudanças significativas no volume do mercado.
- X – Exibe um "X" quando o mercado atinge a linha de meta.
- Lbls (Rótulos) – Exibe ou oculta os rótulos nas linhas.
- RandC (Cores Aleatórias) – Altera as cores das linhas e rótulos do indicador para uma melhor visualização.
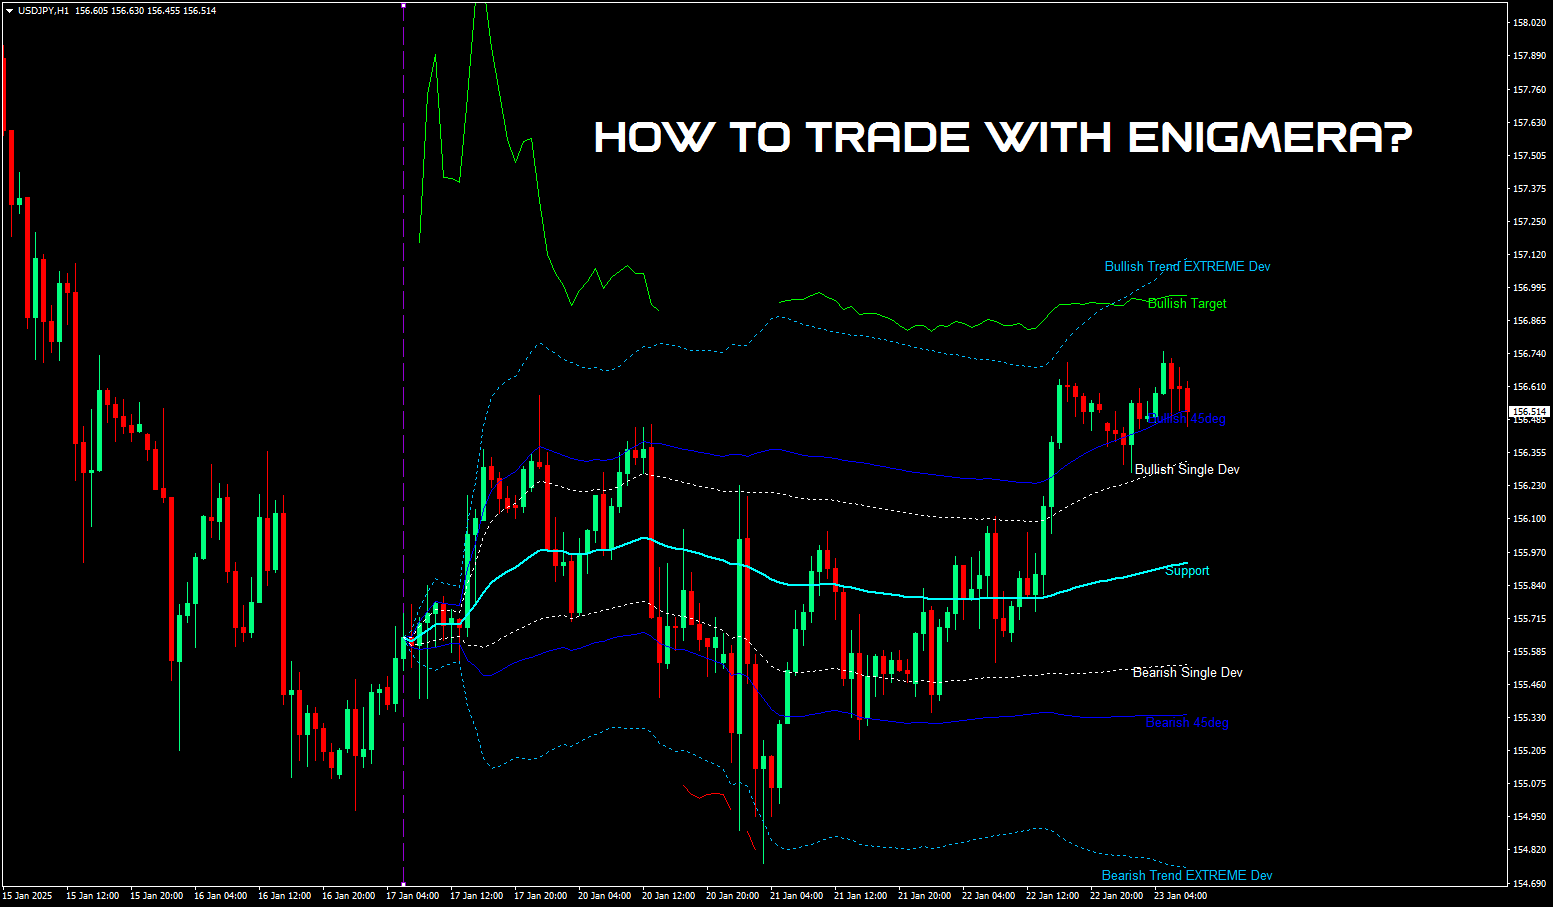
Sistema
O ENIGMERA fornece uma visão completa do presente, ao contrário dos indicadores de mercado típicos que apenas extrapolam dados passados para o presente e futuro. Se você está em suporte, é suporte real; se está em resistência, é resistência real. Uma quebra de nível indica uma mudança de tendência.
O ENIGMERA foi projetado para analistas financeiros e consultores que precisam de informações confiáveis para compartilhar com os clientes, bem como para investidores que exigem a máxima precisão e confiança.
Ele se destaca por sua precisão ótima, permitindo que os traders avaliem suas opções com clareza e confiança.
Combinando 20 anos de experiência em negociação e conhecimento em um pacote completo, o ENIGMERA é tanto intuitivo quanto dependente do usuário. Sua eficácia depende da configuração adequada feita pelo usuário para maximizar o desempenho.
Recomendações:
- Par de moedas: Todos os pares, todos os mercados
- Período: Todos os períodos
- Depósito mínimo: Sem depósito mínimo
- Tipo de conta: Sem limitações
- Corretores: Sem limitações
Este sofisticado indicador é ideal para estratégias eficazes de negociação diária e scalping. Otimize sua negociação discricionária com os algoritmos avançados do Enigmera, adequado para os mercados de Forex, ações, índices e criptomoedas. Projetado para MetaTrader 4, o Enigmera simplifica o gerenciamento de stop-loss e riscos.
Todas as ferramentas que você precisa para se tornar um trader bem-sucedido. O Enigmera funciona em todos os mercados e períodos, sem redesenho.
Você está pronto para levar sua tomada de decisão financeira ao nível mais alto?


i started with this but after looking through Ivan's other indicators i changed to Meravith .. (Ivan gave me a huge discount so i could upgrade) this developer is engaging and helpful have a chat with him and see what tools he can help you with