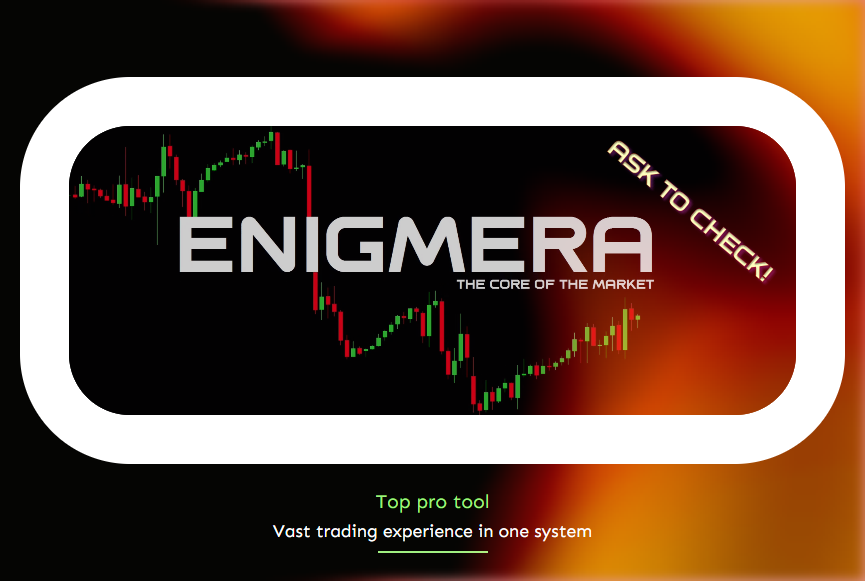
Enigmera

5

ENIGMERA: Il cuore del mercato

Importante: La demo di MQL5.com funziona nel Strategy Tester e potrebbe non riflettere completamente le funzionalità di Enigmera. Consulta la descrizione, gli screenshot e il video per maggiori dettagli. Non esitare a inviarmi un messaggio se hai domande!

Il codice dell'indicatore è stato completamente riscritto. La versione 3.0 aggiunge nuove funzionalità e corregge i bug accumulati dall'inizio dell'indicatore.
Introduzione
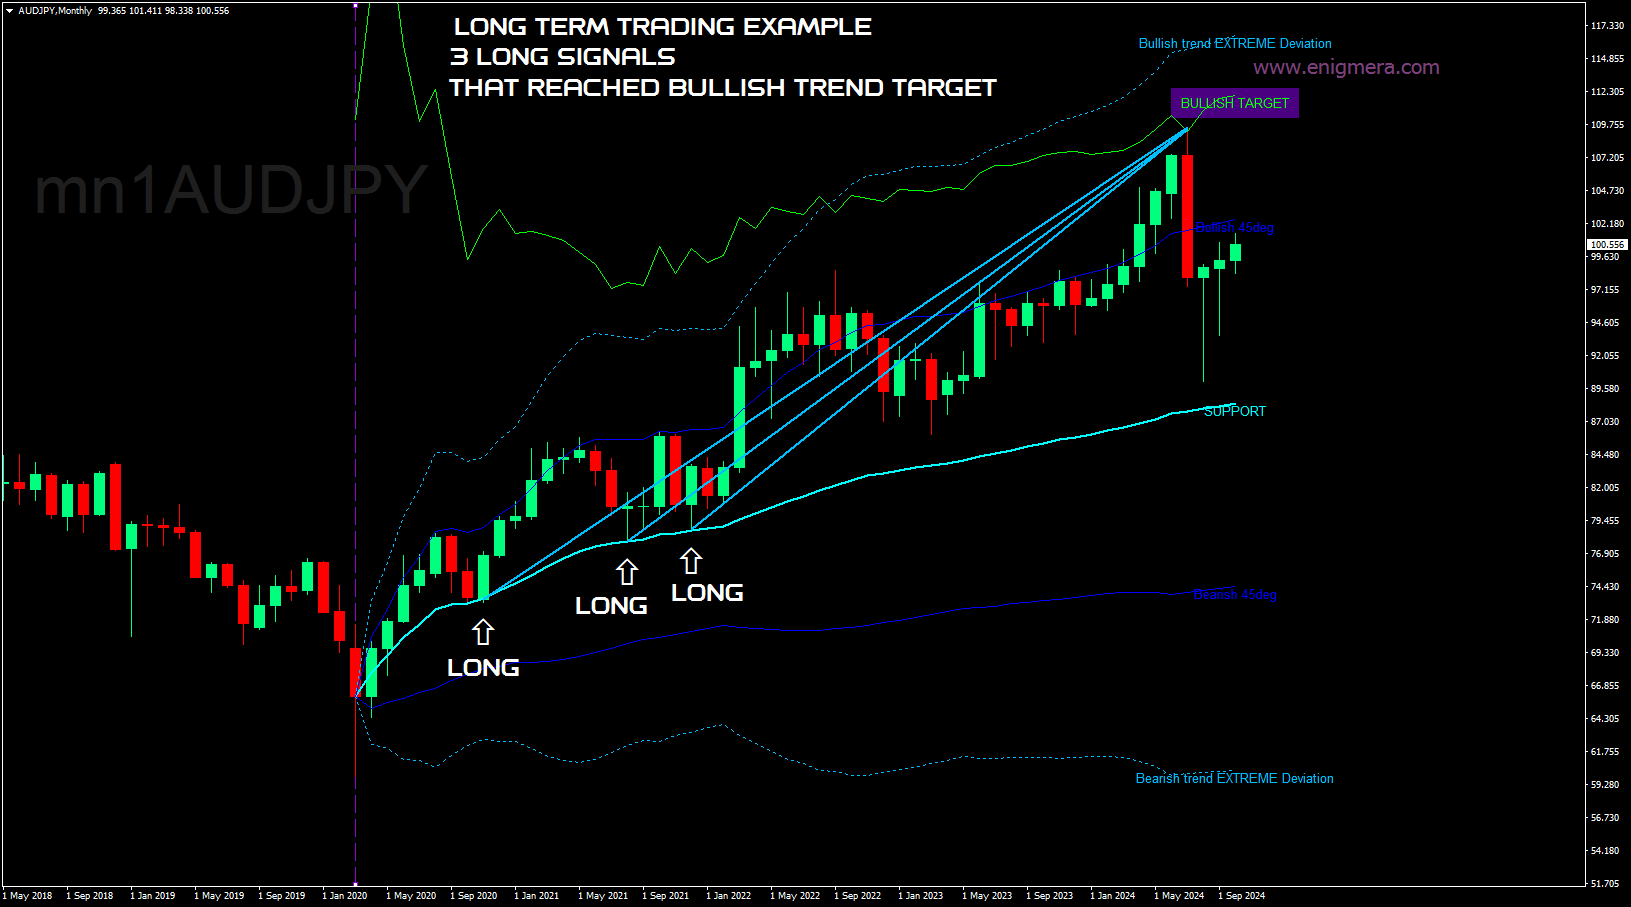
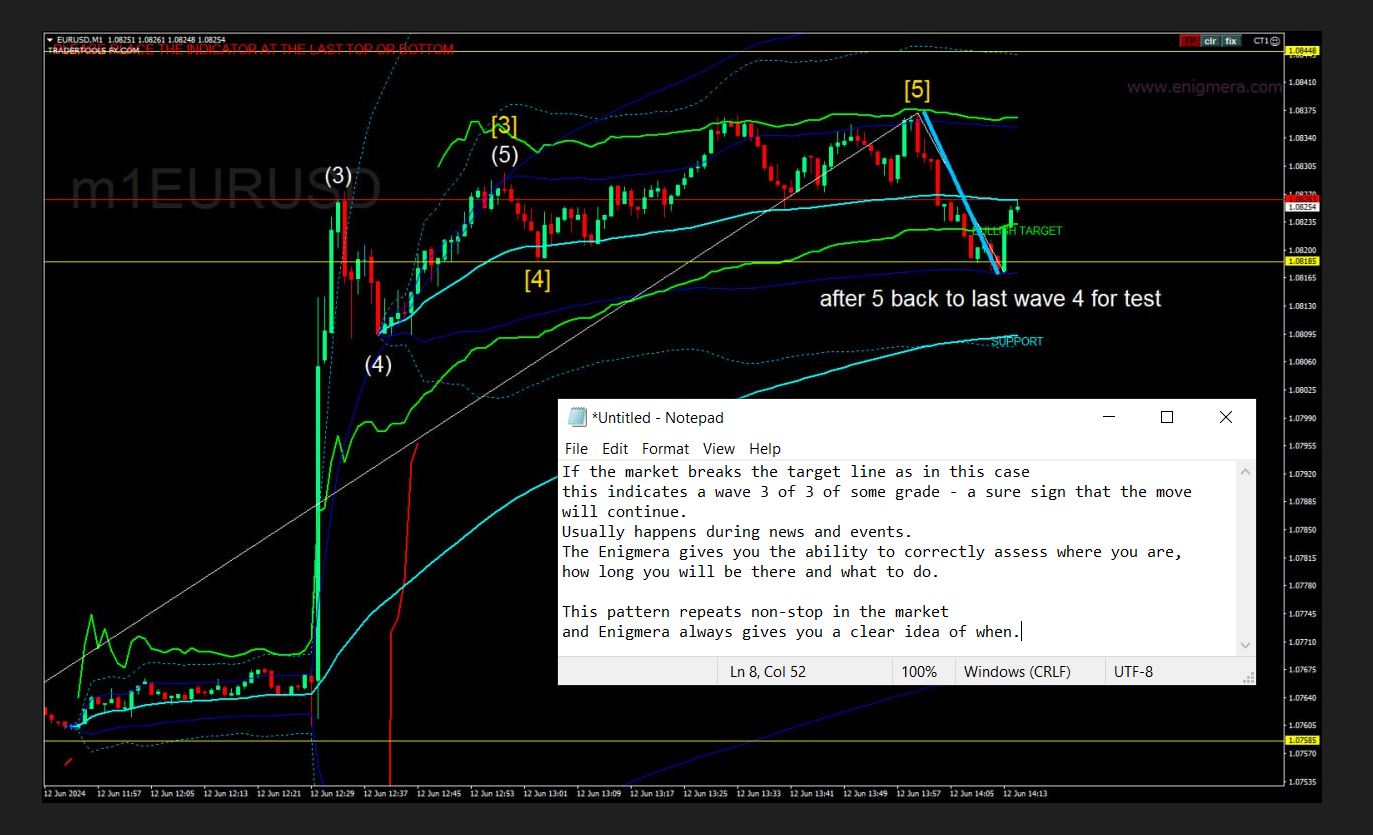
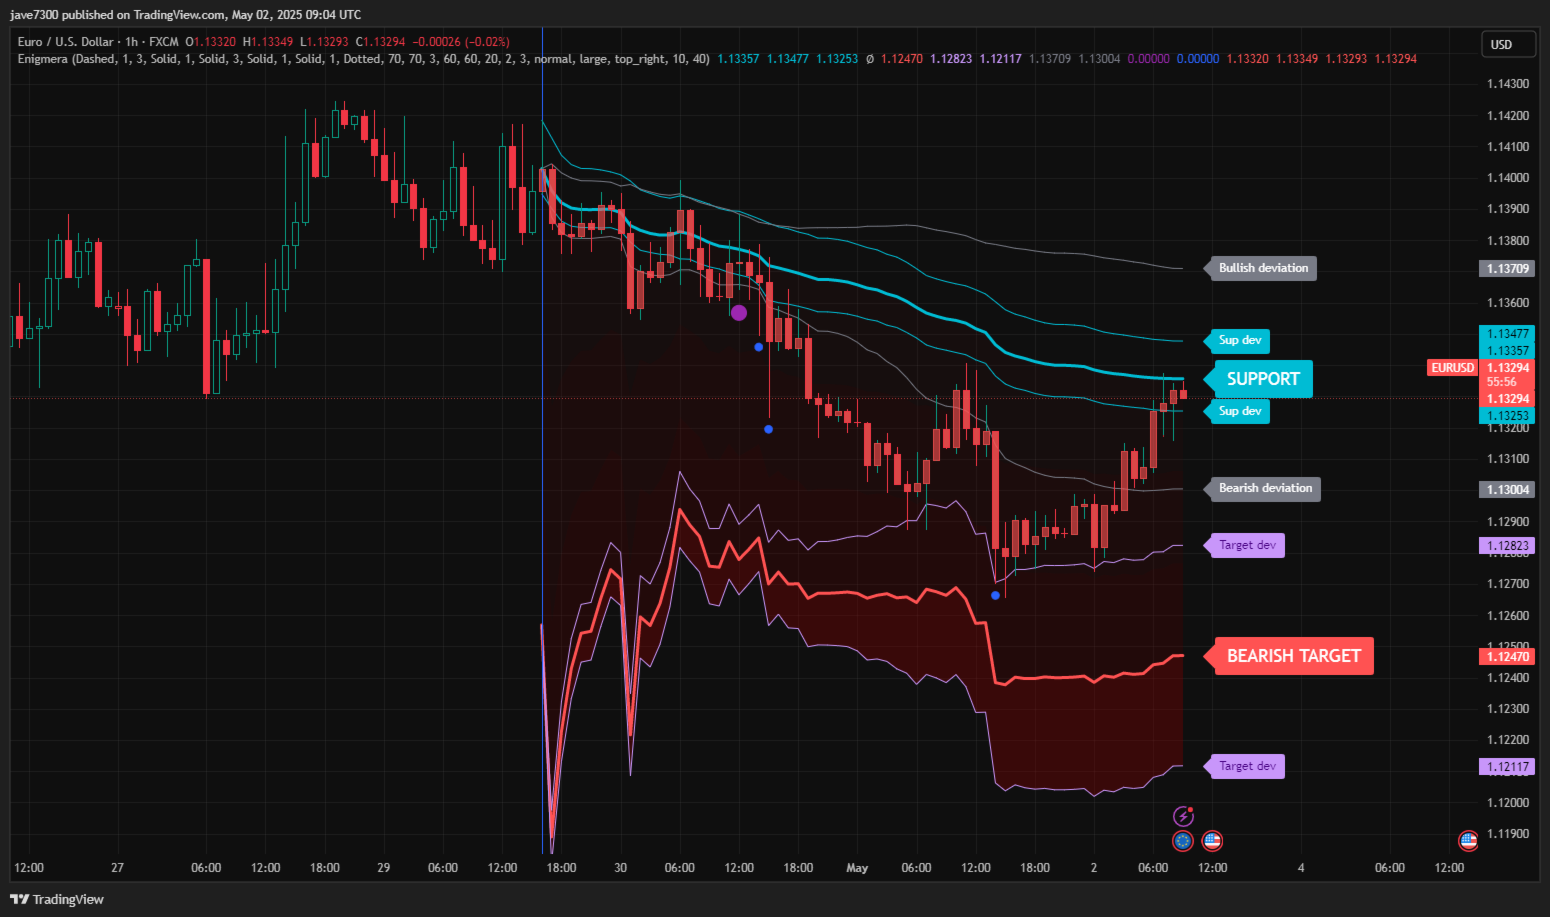
Questo indicatore e sistema di trading è un approccio notevole ai mercati finanziari. ENIGMERA utilizza cicli frattali per calcolare con precisione i livelli di supporto e resistenza. Mostra la vera fase di accumulazione e fornisce direzione e obiettivi. Un sistema che funziona sia in tendenze che in correzioni.

Come funziona
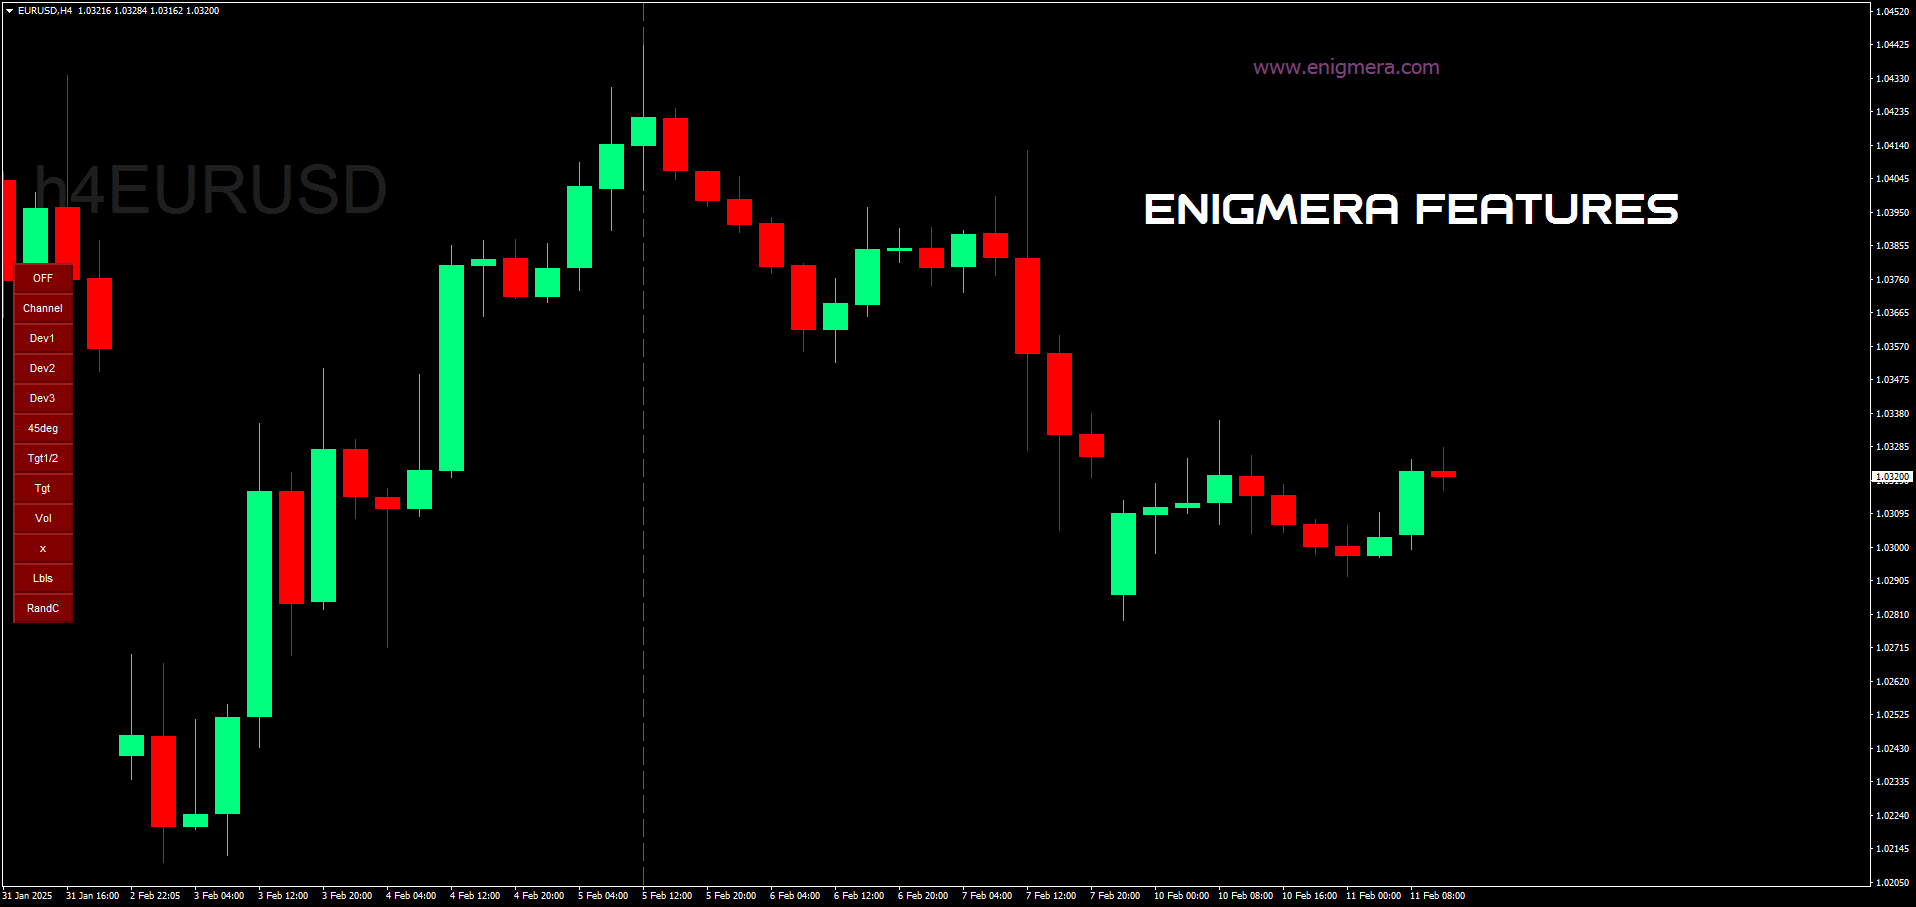
La maggior parte delle funzionalità dell'indicatore è controllata tramite pulsanti sul lato sinistro del grafico, permettendo una risposta rapida a diverse condizioni di mercato.
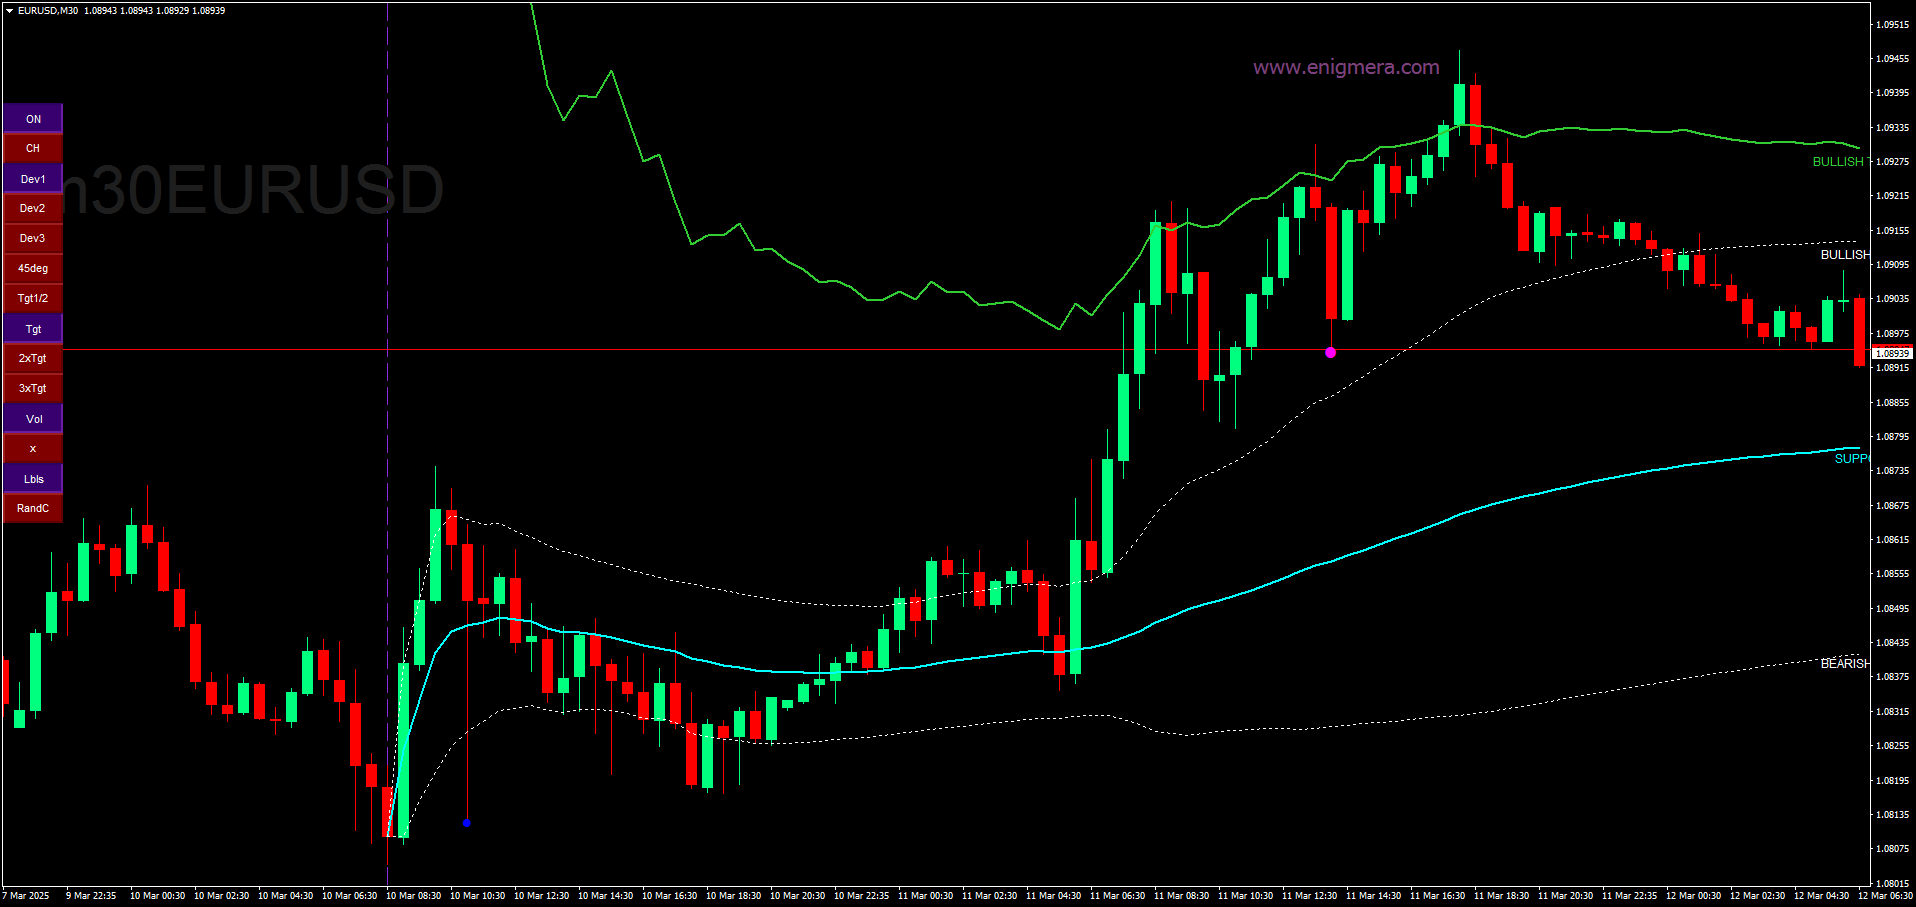
Pulsanti

  1. ON/OFF – Mostra o nasconde l'intero indicatore.
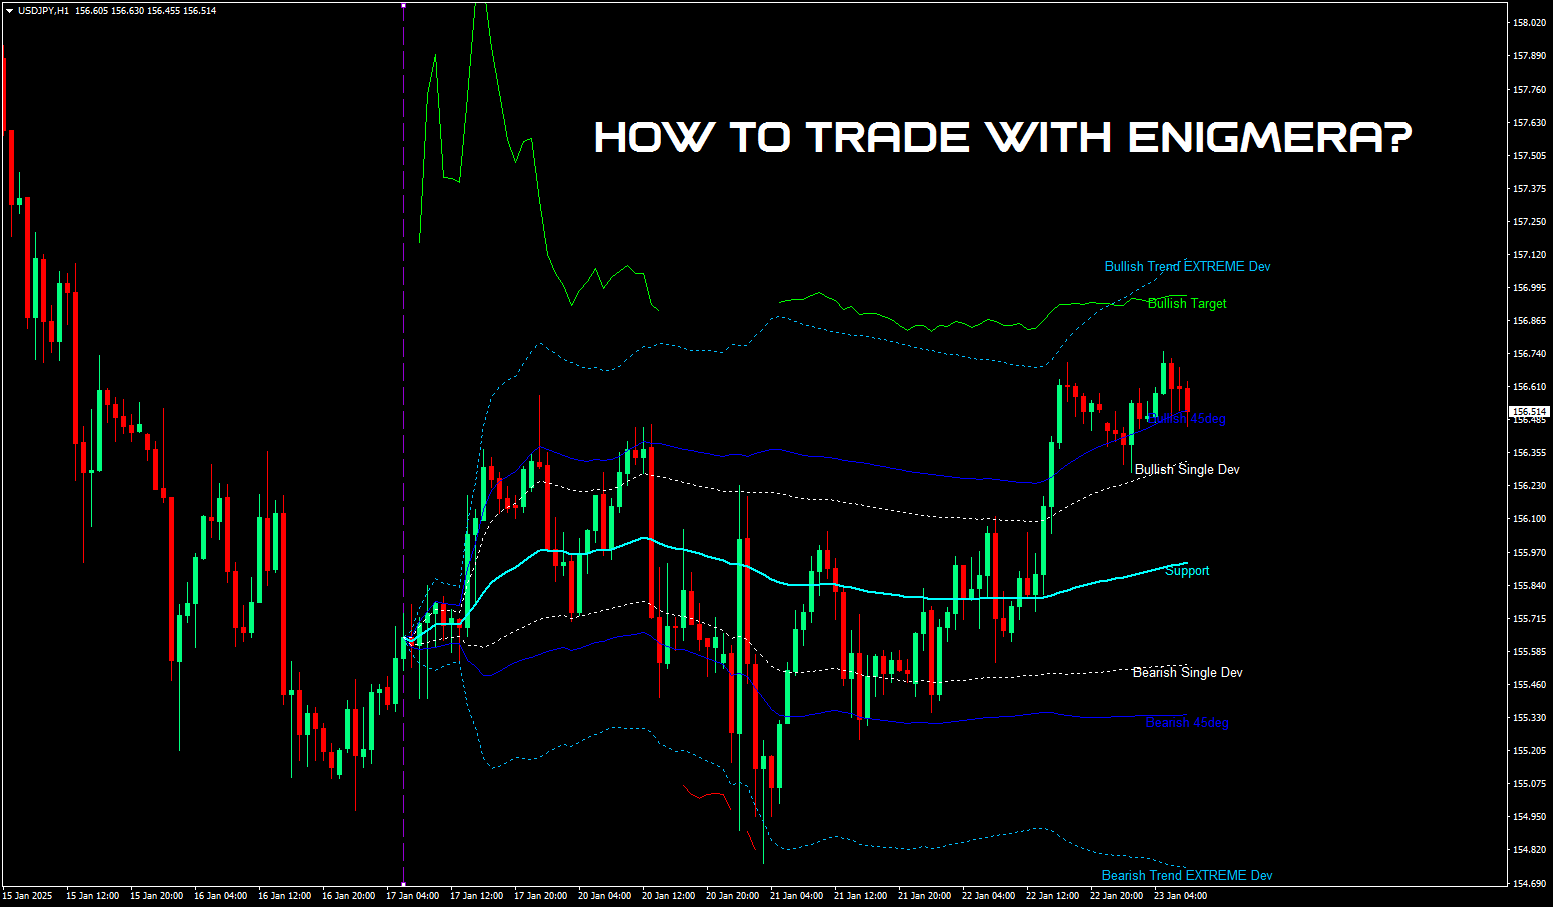
  2. Channel – Attiva il canale di supporto, indicando una gamma accettabile di deviazioni.
  3. Dev1 (Prima deviazione) – Indica i movimenti di prezzo all'interno della deviazione di supporto, segnalando una consolidazione del mercato o un accumulo di forza.
  4. Dev2 (Seconda deviazione) – Mostra i movimenti di prezzo tra le deviazioni, segnalando la formazione e la direzione del trend.
  5. Dev3 (Terza deviazione) – Indica una significativa accelerazione del trend e alta volatilità.
  6. 45deg (45 gradi) – Mostra il ritmo del mercato e la stabilità dei movimenti rispetto alla linea dei 45 gradi.
  7. Tgt1/2 (Obiettivo parziale) – Rappresenta metà della linea dell'obiettivo del trend, utilizzata nella fase finale del mercato.
  8. Tgt (Obiettivo) – La linea dell'obiettivo del trend, che indica i livelli in cui chiudere le posizioni.
  9. Vol (Volume) – Mostra punti di volume sulle candele per indicare cambiamenti significativi nel volume del mercato.
  10. X – Mostra una "X" quando il mercato raggiunge la linea dell'obiettivo.
  11. Lbls (Etichette) – Mostra o nasconde le etichette sulle linee.
  12. RandC (Colori casuali) – Cambia i colori delle linee e delle etichette dell'indicatore per una migliore visualizzazione.

Sistema
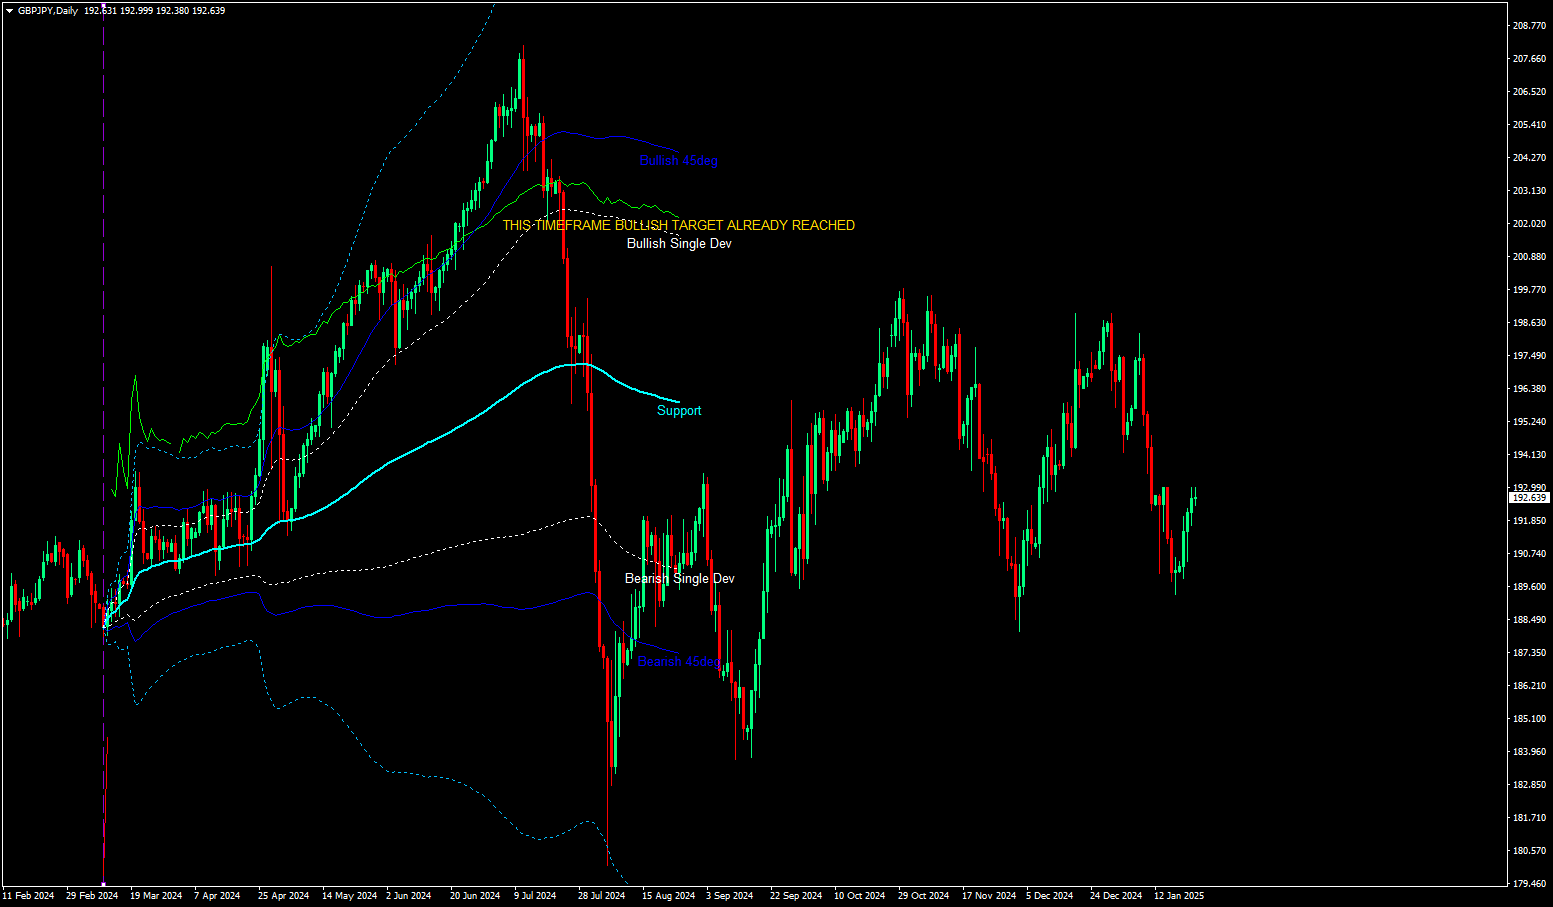
ENIGMERA offre un quadro completo della situazione attuale, a differenza degli indicatori di mercato tipici che semplicemente eseguono l'extrapolazione dei dati passati nel presente e nel futuro. Se sei sul supporto, è supporto reale; se sei sulla resistenza, è resistenza reale. Un livello rotto indica un cambiamento di trend.

ENIGMERA è progettato per analisti finanziari e consulenti che hanno bisogno di condividere informazioni affidabili con i clienti, così come per gli investitori che richiedono la massima precisione e fiducia.

Si distingue per la sua precisione ottimale, consentendo ai trader di valutare le proprie opzioni con chiarezza e fiducia.

Combinando 20 anni di esperienza e conoscenza nel trading in un pacchetto completo, ENIGMERA è sia intuitivo che dipendente dall'utente. La sua efficacia dipende dalla corretta configurazione dell'utente per massimizzare le prestazioni.

Raccomandazioni:

  • Coppie di valute: Tutte le coppie, tutti i mercati
  • Timeframe: Tutti i timeframe
  • Deposito minimo: Nessun deposito minimo
  • Tipo di account: Nessuna limitazione
  • Broker: Nessuna limitazione

Questo sofisticato indicatore è ideale per strategie di day trading e scalping efficaci. Ottimizza il tuo trading discrezionale con gli algoritmi avanzati di Enigmera, adatto per Forex, azioni, indici e mercati di criptovalute. Progettato per MetaTrader 4, Enigmera semplifica la gestione dello stop-loss e dei rischi.

Tutti gli strumenti di cui hai bisogno per diventare un trader di successo. Enigmera funziona su tutti i mercati e timeframe, senza ridisegno.

Sei pronto a portare le tue decisioni finanziarie al livello successivo?


Recensioni 10
onermentes
19
onermentes 2025.06.17 18:57 
 

Yaklaşık olarak 10 yıldır forex piyasasında işlem yapmaktayım. Pek çok indikatör taradım ve aldım. Neredeyse bir çoğu çöptü diyebilirim. Enigmera indikatörden ziyade bir starteji yapmamı sağlamakta. Girmiş olduğum pozisyonlarda korkumu yenmeme katkı sağladı. Daha önce erken kapatmak zorunda olduğum pozisyonlarda bearish veya bullish hedefler neredeyse tam anlamıyla doğru çalışmakta ve buna bağlı olarak pozisyonlarımı daha uzun tutabilme güvenini sağladı. Özellikle support line çok ciddi olarak destek veya direnç olarak çalışmakta. Para yapmanıza kesinlikle katkı sağlayacaktır. Ivan teşekkür ederim.

TANJU2690
569
TANJU2690 2025.03.05 13:37 
 

I have never and ever seen any system like Enıgmera. What ever you want, you can find on it. İt is incredible system. And Cretor of aenıgmera, Mr.Ivan is more and more helpfull to understant of logıc Enigmera. Fistly, I want sent all thankfull to Ivan because he teach me Enıgmera Logıc and also share this marvelous product with market

smso9466eiou
172
smso9466eiou 2025.02.23 15:38 
 

a very good indicator that composes all in one, entry, exit and reverse. Great!

Prodotti consigliati
Overview Harmonic Patterns MT4 is a technical analysis indicator designed for the MetaTrader 5 platform. It identifies and displays harmonic price patterns, such as Butterfly, Cypher, Crab, Bat, Shark, and Gartley, in both bullish and bearish directions. The indicator calculates key price levels, including entry, stop loss, and three take-profit levels, to assist traders in analyzing market movements. Visual elements and customizable alerts enhance usability on the chart. Features Detects six ha
EZZ Zig Zag MT4
Paulo Rocha
5 (1)
EZZ Elite Zig Zag is an indicator for the MetaTrader 4 terminal. This indicator traces the peak of the trend based on the market reversal, thus showing various opportunities in the financial market. EZZ Elite Zig Zag is a visual tool, intuitive, and easy to understand and use.  Test it Yourself by Downloading it for Free. Author Paulo Rocha all rights reserved
This indicator presents an alternative approach to identify Market Structure. The logic used is derived from learning material created by   DaveTeaches (on X) Upgrade v1.10: add option to put protected high/low value to buffer (figure 11, 12) When quantifying Market Structure, it is common to use fractal highs and lows to identify "significant" swing pivots. When price closes through these pivots, we may identify a Market Structure Shift (MSS) for reversals or a Break of Structure (BOS) for co
Alpha Trend sign has been a very popular trading tool in our company for a long time. It can verify our trading system and clearly indicate trading signals, and the signals will not drift. Main functions: Based on the market display of active areas, indicators can be used to intuitively determine whether the current market trend belongs to a trend market or a volatile market. And enter the market according to the indicator arrows, with green arrows indicating buy and red arrows indicating se
Gartley Projection D
Oleksandr Medviediev
3.71 (7)
The indicator identifies the harmonic patterns (XABCD) according to developments of H.M.Gartley ( "Profits in the Stock Market" , 1935г). It projects D-point as a point in the perspective projection (specify ProjectionD_Mode = true in the settings). Does not redraw. When a bar of the working timeframe closes, if the identified pattern point has not moved during Patterns_Fractal_Bars bars, an arrow appears on the chart (in the direction of the expected price movement). From this moment on, the ar
Daily Candle Predictor è un indicatore che prevede il prezzo di chiusura di una candela. L'indicatore è destinato principalmente all'uso sui grafici D1. Questo indicatore è adatto sia per il trading forex tradizionale che per il trading di opzioni binarie. L'indicatore può essere utilizzato come sistema di trading autonomo o può fungere da aggiunta al sistema di trading esistente. Questo indicatore analizza la candela corrente, calcolando alcuni fattori di forza all'interno del corpo della cande
We present you the indicator "Candle closing counter", which will become your indispensable assistant in the world of trading. That’s why knowing when the candle will close can help: If you like to trade using candle patterns, you will know when the candle will be closed. This indicator will allow you to check if a known pattern has formed and if there is a possibility of trading. The indicator will help you to prepare for market opening and market closure. You can set a timer to create a pre
The Super Arrow Indicator provides non-repainting buy and sell signals with exceptional accuracy. Key Features No repainting – confirmed signals remain fixed Clear visual arrows: green for buy, red for sell Real-time alerts via pop-up, sound, and optional email Clean chart view with no unnecessary clutter Works on all markets: Forex, gold, oil, indices, crypto Adjustable Parameters TimeFrame Default: "current time frame" Function: Sets the time frame for indicator calculation Options: Can be set
Owl smart levels
Sergey Ermolov
4.24 (37)
Versione MT5  |  FAQ L' indicatore Owl Smart Levels   è un sistema di trading completo all'interno dell'unico indicatore che include strumenti di analisi di mercato popolari come i   frattali avanzati di Bill Williams , Valable ZigZag che costruisce   la corretta struttura a onde   del mercato, e i   livelli di Fibonacci che segnano i livelli esatti di entrata nel mercato e luoghi per prendere profitti. Descrizione dettagliata della strategia Istruzioni per lavorare con l'indicatore Consulente-
PZ Harmonacci Patterns
PZ TRADING SLU
3.17 (6)
Trade smarter, not harder: Empower your trading with Harmonacci Patterns This is arguably the most complete harmonic price formation auto-recognition indicator you can find for the MetaTrader Platform. It detects 19 different patterns, takes fibonacci projections as seriously as you do, displays the Potential Reversal Zone (PRZ) and finds suitable stop-loss and take-profit levels. [ Installation Guide | Update Guide | Troubleshooting | FAQ | All Products ] It detects 19 different harmonic pric
Happy Scalping Indicator
Leandro Bernardez Camero
Questo indicatore è stato progettato per uno scalping aggressivo e per entrate rapide nelle opzioni binarie , generando segnali su ogni candela in modo da sapere esattamente cosa sta succedendo in ogni momento. Unisciti al canale Happy Scalping: MQL5 Non ripinta : il segnale della candela attuale viene generato in tempo reale , il che significa che può cambiare mentre la candela è ancora in formazione, a seconda che il prezzo salga o scenda rispetto alla chiusura della candela precedente. Tutt
Introduction It is common practice for professional trades to hide their stop loss / take profit from their brokers. Either from keeping their strategy to the themselves or from the fear that their broker works against them. Using this indicator, the stop loss / take profit points will be drawn on the product chart using the bid price. So, you can see exactly when the price is hit and close it manually.  Usage Once attached to the chart, the indicator scans the open orders to attach lines for t
Stochastic Visual MTF for MT4
Naththapach Thanakulchayanan
This MT4 indicator, Stochastic Visual MTF, summarize the oscillator values in color graphic for both  Main and Signal in current market emotion stage which will show you in multi timeframes (9) and sum of the total Main and Signal oscillator values which is an important information for traders especially you can see all oscillator values in visualized graphic easily, You can add more by Shift, Hope it will be helpful tool for you for making a good decision in trading.
Are you tired of guessing market direction? Upgrade your trading desk with Trinity Suite v3.0 , the all-in-one institutional dashboard that combines Market Structure, Trend Intelligence, and Momentum validation into a single, non-repainting tool. Trinity Suite is not just an indicator; it is a complete trading system designed for Scalpers, Day Traders, and Swing Traders who demand precision.  KEY FEATURES (The 3 Pillars): 1. Market Architect (Structure): Automatically identifies critical turning
Introduction One of the patterns in "RTM" is the "QM" pattern, also known as "Quasimodo". Its name is derived from the appearance of "Hunchback of Notre-Dame" from Victor Hugo's novel. It is a type of "Head and Shoulders" pattern.   Formation Method   Upward Trend In an upward trend, the left shoulder is formed, and the price creates a new peak higher than the left shoulder peak . After a decline, it manages to break the previous low and move upward again. We expect the price to
Monster Harmonic Indicator
Paul Geirnaerdt
4.59 (29)
Monster Harmonics Indicator is a harmonic pattern indicator. It recognizes Gartley, Bat, Crab, Butterfly, Cypher, White Swan, Black Swan, Shark and several other patterns. Projected patterns that are not yet completed are recognized, too. Monster even shows the PRZ (Potential Reversal Zone). Users can add their own user defined patterns to Monster. Besides the current pattern, Monster also shows all patterns in the symbols history. Monster will provide alerts for developing patterns. Introduced
Infinity Trend Pro
Yaroslav Varankin
1 (1)
This is a trend indicator without redrawing Developed instead of the binary options strategy (by the color of the Martingale candlestick) Also works well in forex trading When to open trades (binary options) A signal will appear in the place with a candle signaling the current candle It is recommended to open a deal for one candle of the current timeframe M1 and M5 When a blue dot appears, open a deal up When a red dot appears, open a trade down. How to open trades on Forex. When a signal is rec
The Th3Eng PipFinite indicator is based on a very excellent analysis of the right trend direction with perfect custom algorithms. It show the true direction and the best point to start trading. With StopLoss point and Three Take Profit points. Also it show the right pivot of the price and small points to order to replace the dynamic support and resistance channel, Which surrounds the price. And Finally it draws a very helpful Box on the left side on the chart includes (take profits and Stop loss
This is an arrow indicator without a future function,developed based on the most advanced profit trading algorithms.It has the most innovative and advanced dual trend analysis module, as well as the latest and highly effective market trend prediction algorithm.Trends are your friends, and following larger trends can earn the maximum profit in foreign exchange. This indicator helps traders identify current trends and track them. Someone once made a profit of 10 times in a week by relying on it.No
Trend Bilio - an arrow indicator without redrawing shows potential market entry points in the form of arrows of the corresponding color: upward red arrows suggest opening a buy, green down arrows - selling. The entrance is supposed to be at the next bar after the pointer. The arrow indicator Trend Bilio visually "unloads" the price chart and saves time for analysis: no signal - no deal, if an opposite signal appears, then the current deal should be closed. It is Trend Bilio that is considered
RTrends
Nikolay Likhovid
The RTrends indicator does two things: first, it automatically draws the layout of the price chart by plotting trend lines and, secondly, it produces bearish and bullish signals. The layout reflects the fractal nature of the market. Trends from different time horizons are applied simultaneously on the chart. Thus, from a single chart a trader can see trend lines of higher timeframes. The lines, depending on the horizon, differ in color and width: the older the horizon, the thicker the line is. T
This system is very useful for trading because it solves several classic problems: 1. Objectivity & Precision Benefit: It eliminates the trader's personal bias. Every trader might draw a trendline slightly differently, but this indicator uses a precise mathematical logic (Fractals) to find the pivot points. The resulting lines are objective and consistent every time. 2. ️ Dynamic Updates Benefit: Your chart is always current. As soon as a new pivot is confirmed, the new trendline is drawn
Chart Patterns Detect 15 patterns (Ascending Triangle, Descending Triangle, Rising Wedge, Falling Wedge, Bullish Flag, Bearish Flag, Bullish Rectangle, Bearish Rectangle Symmetrical triangle, Head and Shoulders, Inverted Head and Shoulders, Triple top, Triple Bottom, Double Top, Double Bottom) Use historical data to calculate the probability of each pattern to succeed (possibility to filter notification according to the chance of success) gives graphic indication about the invalidation level and
Octave Fractal Channel — Dynamic Gann-Based Support/Resistance Levels with Auto-Scaling. This indicator plots a dynamic channel based on the fractal structure of price movement. Channel levels adapt to the current symbol and timeframe, making it suitable for use across various financial instruments — from currency pairs to cryptocurrencies and indices. The indicator can be used in combination with other technical tools, such as the RSI oscillator, to provide additional signal filtering. How to
Trade with Gann on your side!! MASTER CIRCLE 360 CIRCLE CHART, originally created by Gann admitted that this is “The Mother of all charts”. It is one of the last studies that this great trader left for us. The numeric tab le is apparently quite simple like all the tables and is based on square numbers, the SQUARE OF 12 and is by evolution, one of the most important square numbers. Here we can find CYCLE, PRICE AND TIME thanks to angles and grades, to show past and future support and resistance.
Noize Absorption Index MT4
Ekaterina Saltykova
5 (1)
Noize Absorption Index - is the manual trading system that measures the difference of pressure between bears forces and bulls forces. Green line - is a noize free index that showing curent situation. Zero value of index shows totally choppy/flat market.Values above zero level shows how powerfull bullish wave is and values below zero measures bearish forces.Up arrow appears on bearish market when it's ready to reverse, dn arrow appears on weak bullish market, as a result of reverse expectation. S
The   RSI Divergence + FVG Signal   indicator combines   Relative Strength Index (RSI) Divergence   with   Fair Value Gap (FVG)   detection to generate high-probability buy and sell signals based on both momentum shifts and institutional imbalance zones. Core Features: RSI Divergence Detection : Identifies both regular and hidden bullish/bearish divergences between price and RSI. Divergences indicate potential trend reversals or continuation. FVG Zone Recognition : Detects Fair Value Gaps (imbal
Magic Filter MTF
Yaroslav Varankin
Magic Filter MTF is perfect for any strategy. you do not need to load the chart with extra indicators like this one indicator will replace all additional filters for you it can also be a great strategy. it combines well with trading at local minima and maximums (resistance levels) multi-timeframe-multi-currency indicator 4 screen system is used 4 rows of arrows UTB indicators adjusted for different periods when two arrows pointing in the same direction on the same timeframe coincide,I t c
Heiken Ashi candle chart is an improved version of The Japanese candle chart, which can effectively filter the market "noise" of the Japanese candle chart. It is favored by many traders for its simplicity and intuition. For trend traders, the HA candle chart is a magic tool. Unlike the traditional Japanese candle chart, Heikenashi does not reflect the opening price, high price, low price and closing price of the market. Instead, Heikenashi calculates the value of a single K line in the dominant
Questo è un indicatore MTF dei livelli di supporto e resistenza basato sugli   estremi dell'indicatore Advanced ZigZag Dynamic   e/o   Extended Fractals   con etichette dei prezzi (può essere disabilitato). È possibile selezionare TF più alti per la modalità MTF. Per impostazione predefinita, i livelli vengono generati in base ai punti indicatori ZigZag. I punti indicatori frattali possono essere utilizzati anche insieme a ZigZag o al suo posto. Per semplificare l'uso e risparmiare tempo di CPU,
Gli utenti di questo prodotto hanno anche acquistato
Pulse Scalping Line - an indicator for identifying potential pivot points. Based on this indicator, you can build an effective Martingale system. According to our statistics, the indicator gives a maximum of 4 erroneous pivot points in a series. On average, these are 2 pivot points. That is, the indicator shows a reversal, it is erroneous. This means that the second signal of the indicator will be highly accurate. Based on this information, you can build a trading system based on the Martingale
Meravith
Ivan Stefanov
5 (1)
L'indicatore analizza il volume da ogni punto e calcola i livelli di esaurimento del mercato per quel volume. È composto da tre linee: Linea di esaurimento del volume rialzista Linea di esaurimento del volume ribassista Una linea che indica la tendenza del mercato. Questa linea cambia colore per riflettere se il mercato è rialzista o ribassista. Puoi analizzare il mercato da qualsiasi punto di partenza tu scelga. Una volta che una linea di esaurimento del volume è raggiunta, identifica un nuovo
Bomb Bank Signal
Igor Pereira Calil
5 (1)
Segnale bancario bomba: il tuo indicatore di fiducia in MetaTrader 4 Bomb Bank Signal è un potente indicatore per MetaTrader 4, progettato per identificare le tendenze più rilevanti nel mercato finanziario. Se cerchi uno strumento che anticipi con precisione i movimenti, la Bomb Bank è l'alleato di cui hai bisogno. Come funziona: Questo indicatore combina tre metodi distinti – analisi del volume, chiusura delle candele e trend simmetrico – per rilevare e segnalare opportunità di acquisto e v
Product Name:   Quantum Regime Indicator Short Description:   A multi-engine structural regime and volatility filter. Description: Quantum Regime Indicator (QRI) is a sophisticated technical analysis algorithm designed to identify market structure shifts and volatility regimes. Unlike standard indicators that rely on immediate price action, QRI utilizes a hierarchical logic architecture to filter market noise and identify statistical extremes. The indicator is built on the philosophy of "Market
Indicatore Miraculous – Strumento Forex e Binario 100% Non-Repaint Basato sul Quadrato di Nove di Gann Questo video presenta l' Indicatore Miraculous , uno strumento di trading altamente accurato e potente, sviluppato specificamente per i trader di Forex e Opzioni Binarie . Ciò che rende unico questo indicatore è la sua base sul leggendario Quadrato di Nove di Gann e sulla Legge della Vibrazione di Gann , rendendolo uno degli strumenti di previsione più precisi disponibili nel trading moderno. L
L'indicatore " Dynamic Scalper System " è progettato per il metodo di scalping, ovvero per il trading all'interno di onde di trend. Testato sulle principali coppie di valute e sull'oro, è compatibile con altri strumenti di trading. Fornisce segnali per l'apertura di posizioni a breve termine lungo il trend, con ulteriore supporto al movimento dei prezzi. Il principio dell'indicatore. Le frecce grandi determinano la direzione del trend. Un algoritmo per generare segnali per lo scalping sotto fo
ConfluencePro v2.0 – Ultimate Confluence Indicator for Binary Options & Forex Professional Multi-Filter Signal System with Dashboard, News Filter & Real-Time Statistics ConfluencePro v2.0 is the most advanced confluence-based indicator ever released on the MQL5 Market. It combines 17+ professional filters (Trend, Smart Money Concepts, Market Structure, Divergence, MTF Confirmation, News Events, Volume, Regime Detection and more) into a single, easy-to-read confluence score (0–100%). Only the hi
Presentiamo l'Indicatore F-16 Plane, uno strumento all'avanguardia per MT4 progettato per rivoluzionare la tua esperienza di trading. Ispirato alla velocità e alla precisione imbattibili dell'aereo da combattimento F-16, questo indicatore combina algoritmi avanzati e tecnologia all'avanguardia per offrire prestazioni senza precedenti sui mercati finanziari. Con l'Indicatore F-16 Plane, volerai al di sopra della concorrenza poiché fornisce analisi in tempo reale e genera segnali di trading estrem
The Nihilist 5.0 Indicator includes Forexalien and Nihilist Easy Trend trading strategies and systems. It is composed of an MTF Dashboard where you can analyze the different input possibilities of each strategy at a glance. It has an alert system with different types of configurable filters. You can also configure which TF you want to be notified on your Metatrader 4 platform and Mobile application The indicator has the option to view how could be a TP and SL by using ATR or fixed points, even w
Everyone who purchases the Scalping signals M1 indicator receives a FREE BONUS — a fully automated Expert Advisor that trades based on the indicator’s signals. The indicator shows the arrows — the robot can execute the trades for you, following all signals and risk-management rules. Scalping signals M1 – a ready-made trend-following entry system for M1 Scalping signals M1 is an indicator that turns your chart into a clear action map: a colored trend channel shows the direction of the market, and
OrderFlow Absorption – Indicatore professionale di Delta e Segnali di Assorbimento per MT4 Sblocca la potenza della vera analisi del flusso degli ordini con OrderFlow Absorption – l’indicatore definitivo di istogramma delta e segnali di assorbimento per MetaTrader 4. Progettato per i trader che vogliono vedere cosa succede davvero dietro ogni movimento di prezzo, questo strumento rivela la pressione nascosta di acquisto/vendita e gli eventi di assorbimento che muovono il mercato. Caratteristiche
BinaryIndicator
Andrey Spiridonov
BinaryIndicator is a highly accurate indicator for trading binary options. It shows excellent results in scalping. This indicator is based in multifactor analysis of trend indicators, as well as confirmation oscillators, which in the end gives an increased accuracy of signals. Advantages of the indicator Increased accuracy of signals. Excellent results when trading binary options with a short expiration time from M30 to M1 . It works on any timeframes. Works with any trade symbols. Parameters
Gold Channel is a volatility-based indicator, developed with a specific timing algorithm for the XAUUSD pair, which consists of finding possible corrections in the market. This indicator shows two outer lines, an inner line (retracement line) and an arrow sign, where the theory of the channel is to help identify overbought and oversold conditions in the market. The market price will generally fall between the boundaries of the channel. If prices touch or move outside the channel it is a tradi
Il sistema di trading tecnico delle frecce BB è stato sviluppato per prevedere punti inversi per prendere decisioni al dettaglio. L'attuale situazione di mercato è analizzata dall'indicatore e strutturata per diversi criteri: l'aspettativa di momenti di inversione, potenziali punti di svolta, segnali di acquisto e vendita. L'indicatore non contiene informazioni in eccesso, ha un'interfaccia comprensibile visiva, che consente ai trader di prendere decisioni ragionevoli. Tutte le frecce sembrano
Algo Trading Indicaor  With this indicator , you’ll have zones and trends that hight probability the price will reverse from it. so will gives you all the help that you need  Why should you join us !?  1-This indicator is logical since it’s working in previous days movement , to predict the future movements. 2-Algo trading indicator will help you to draw trends which is special and are too strong than the basics trend , trends will change with the frame time that you work on . 3-We can use
ECM Elite Channel is a volatility-based indicator, developed with a specific time algorithm, which consists of finding possible corrections in the market. This indicator shows two outer lines, an inner line (retracement line) and an arrow sign, where the channel theory is to help identify overbought and oversold conditions in the market. The market price will generally fall between the boundaries of the channel. If prices touch or move outside the channel, it's a trading opportunity. The ind
Rabby MT4
Jannie Barwise
RABBY: The "Momentum Dislocation" Indicator for Nasdaq  (Nas100, Us100) Nasdaq M1 (Nas100, Us100) Stop Getting Trapped by M1 Noise. The Ultimate Nasdaq Scalping Tool. Start Trading the Dislocation. The first indicator that visualizes "Price Detachment" for high-precision entries. You don't need another arrow. You need to see the   Structure   of the move. If you trade Nasdaq (Nas100, Us100) on the 1-minute, you know the feeling: An indicator prints a "Buy" signal. You enter. Two minutes lat
Rtc ML Ai Predictor MT4
Muhammad Faisal Sagala
Rtc ML Ai | Predictor CORE MACHINE LEARNING ENGINE Adaptive ML Market Predictor – Multi-Bar Trend & Candle Forecast What This Indicator Does This indicator is a  real-time market prediction engine  designed to analyze price behavior and estimate  future market tendencies . Unlike conventional indicators, this system  does not rely on static parameters or historical curve-fitting , but adapts its internal state dynamically during live market operation. Instead of using static rules, the indic
How to use Pair Trading Station Pair Trading Station is recommended for H1 time frame and you can use it for any currency pairs. To generate buy and sell signal, follow few steps below to apply Pair Trading Station to your MetaTrader terminal. When you load Pair Trading Station on your chart, Pair Trading station will assess available historical data in your MetaTrader platforms for each currency pair. On your chart, the amount of historical data available will be displayed for each currency pai
The Hurricane Indicator
Paul Nicholas Clevett
5 (1)
Currently switched to the 4 hour chart - but use other time frames for confirmation. :-)  I change my main time frame based on the market movement at the time. The Hurricane Forex Indicator is a multi time frame indicator that includes such things as Trade Notifications, Trade Calculator, Momentum Indicator, risk reward and much more. We have a free Trade room for our users as well. Please check out the video for full details of how this indicator works as it has over 15 years worth of developme
FFx Engulfing Setup Alerter gives trade suggestions with Entry, Target 1, Target 2 and StopLoss. Below are the different options available: Entry suggestion - pips to be added over the break for the entry 3 different options to calculate the SL - by pips, by ATR multiplier or at the pattern High/Low 3 different options to calculate the 2 TPs - by pips, by ATR multiplier or at Risk/Reward Offset the dashboard - any place on the chart Remove the suggestion once the price reached the SL line Lines
FFx InsideBar Setup Alerter gives trade suggestions with Entry, Target 1, Target 2 and StopLoss. Below are the different options available: Entry suggestion - pips to be added over the break for the entry Minimum candle size - to avoid too close buy/sell entry suggestions 3 different options to calculate the SL - by pips, by ATR multiplier or at the pattern High/Low 3 different options to calculate the 2 TPs - by pips, by ATR multiplier or at Risk/Reward Offset the dashboard - any place on the c
FFx OutsideBar Setup Alerter gives trade suggestions with Entry, Target 1, Target 2 and StopLoss. Below are the different options available: Entry suggestion - pips to be added over the break for the entry. 3 different options to calculate the SL - by pips, by ATR multiplier or at the pattern High/Low. 3 different options to calculate the 2 TPs - by pips, by ATR multiplier or at Risk/Reward. Offset the dashboard - any place on the chart. Remove the suggestion once the price reached the SL line.
FFx PinBar Setup Alerter gives trade suggestions with Entry, Target 1, Target 2 and StopLoss. Below are the different options available: Entry suggestion - pips to be added over the break for the entry Minimum candle size - to avoid too small candles 3 different options to calculate the SL - by pips, by ATR multiplier or at the pattern High/Low 3 different options to calculate the 2 TPs - by pips, by ATR multiplier or at Risk/Reward Offset the dashboard - any place on the chart Remove the sugges
Automatic, live & interactive picture of all trendlines. Assign push, email and sound alerts to the lines of your choice and be informed about price rollback, breakout, rollback after breakout, number of rollbacks, line expiration by double breakout. Correct, drag or delete the lines and interactively tune the line system. https://youtu.be/EJUo9pYiHFA . Chart examples https: //www.mql5.com/en/users/efficientforex Price Interaction Events All events are effective immediately and only after one
Adaptive Stochastic
Rasoul Mojtahedzadeh
Stochastic Oscillator is one of the most popular and accurate oscillators widely used by traders to capture overbought and oversold areas of price action. Although the Stochastic indicator works fine for an interval of the market, it fails to generate profitable signals when the market conditions change, and hence it produces wrong signals resulting in big losses. Have you ever thought about an adaptive Stochastic indicator that adapts its period of calculation based on the market conditions? Th
The purpose of this new version of the MT4 standard indicator provided in your platform is to display in a sub-window multiple timeframes of the same indicator with its divergences. See the example shown in the picture below. But the display isn't like a simple MTF indicator. This is the real display of the indicator on its timeframe. Here's the options available in the FFx divergences indicator: Select the timeframes to be displayed (M1 to Monthly) Define the width (number of bars) for each tim
The purpose of this new version of the MT4 standard indicator provided in your platform is to display in a sub-window multiple timeframes of the same indicator with its divergences. See the example shown in the picture below. But the display isn't like a simple MTF indicator. This is the real display of the indicator on its timeframe. Here's the options available in the FFx divergences indicator: Select the timeframes to be displayed (M1 to Monthly). Define the width (number of bars) for each ti
Altri dall’autore
Meravith
Ivan Stefanov
5 (1)
L'indicatore analizza il volume da ogni punto e calcola i livelli di esaurimento del mercato per quel volume. È composto da tre linee: Linea di esaurimento del volume rialzista Linea di esaurimento del volume ribassista Una linea che indica la tendenza del mercato. Questa linea cambia colore per riflettere se il mercato è rialzista o ribassista. Puoi analizzare il mercato da qualsiasi punto di partenza tu scelga. Una volta che una linea di esaurimento del volume è raggiunta, identifica un nuovo
L’indicatore evidenzia le zone in cui viene dichiarato interesse sul mercato , per poi mostrare la zona di accumulo degli ordini . Funziona come un book degli ordini su larga scala . Questo è l’indicatore per i grandi capitali . Le sue prestazioni sono eccezionali. Qualsiasi interesse ci sia nel mercato, lo vedrai chiaramente . (Questa è una versione completamente riscritta e automatizzata – non è più necessaria un’analisi manuale.) La velocità di transazione è un indicatore concettualmente nuo
MACD divergency
Ivan Stefanov
5 (4)
Questo indicatore identifica con precisione le divergenze rialziste e ribassiste tra i movimenti di prezzo e l’istogramma MACD, utilizzando medie mobili esponenziali (EMA) con periodi di 5 (veloce) e 34 (lenta) e una linea di segnale con periodo 5. L’indicatore mette in evidenza i punti in cui il momentum si indebolisce, segnalando possibili inversioni di trend. Regole per la corretta identificazione delle divergenze La divergenza rialzista è valida quando il prezzo forma massimi crescenti e l’i
FREE
Horizont
Ivan Stefanov
Horizont è un sistema di trading che fornisce una configurazione completa di operazione: punto di ingresso, target 1, target 2 e stop loss, tutti calcolati automaticamente. Il sistema identifica automaticamente i massimi e i minimi del mercato e li collega per definire il trend attuale. Lei seleziona quale trend tradare e Horizont genera i relativi livelli di ingresso, target e stop. Il sistema include una gestione automatica del rischio. Controlla il saldo del conto, calcola il rischio e sugge
Meravith AUTO
Ivan Stefanov
5 (1)
Meravith Auto è una versione automatizzata del sistema di trading Meravith. L'indicatore è composto da una linea di tendenza che cambia colore. Quando è rialzista è verde, quando è ribassista è rossa. Questa è la linea di supporto del trend. Una linea di liquidità, dove il volume rialzista è uguale al volume ribassista. Una linea di deviazione rialzista tripla. Una linea di deviazione ribassista tripla. Punti viola e blu che indicano un volume elevato. Il punto viola indica un volume maggiore di
L’indicatore analizza il volume da qualsiasi punto e calcola i livelli di esaurimento del mercato per quel volume. Linee principali di Meravith: Linea di esaurimento del volume rialzista – funge da obiettivo. Linea di esaurimento del volume ribassista – funge da obiettivo. Linea di tendenza – indica la tendenza del mercato. Cambia colore a seconda che il mercato sia rialzista o ribassista e funge da supporto di tendenza. Come utilizzarlo: fai doppio clic sulla linea verticale viola e spostala ne
Uno dei pochi indicatori che calcola i livelli esclusivamente in base al prezzo. L’indicatore non è influenzato dai timeframe, dai trend o dai cicli di mercato. Uno degli indicatori più logici mai creati. L’indicatore FIFTY è ora disponibile in una versione automatica, che elimina la necessità di tracciare manualmente i livelli. Questa versione disegna automaticamente sul grafico i livelli giornalieri, settimanali, mensili e annuali, garantendo precisione e risparmio di tempo. Inoltre, sono pres
Questo indicatore è uno strumento interattivo di etichettatura delle Onde di Elliott per MetaTrader 4 e 5. Consente all’utente di posizionare manualmente le etichette delle onde direttamente sul grafico, selezionando la dimensione dell’etichetta, il colore e il tipo di onda (correzioni ABC, impulsi a 5 onde o strutture WXY) da un menu sul grafico. Con un solo clic sul grafico, l’indicatore posiziona in modo sequenziale le etichette delle onde appropriate nel prezzo e nel tempo scelti, aiutando i
FREE
Oscillatore di momentum avanzato che regola automaticamente il suo periodo in base alla volatilità del mercato per segnali di ipercomprato e ipervenduto più accurati. Come Funziona: L'indicatore utilizza un calcolo del periodo adattivo che si riduce durante l'alta volatilità e si allunga durante la bassa volatilità. Questa regolazione dinamica fornisce segnali più rapidi quando il mercato è in trend e riduce i falsi segnali durante le fasi di lateralità. Il valore RSI viene calcolato sulla base
FREE
Meravith Auto è una versione automatizzata del sistema di trading Meravith. L'indicatore è composto da una linea di tendenza che cambia colore. Quando è rialzista è verde, quando è ribassista è rossa. Questa è la linea di supporto del trend. Una linea di liquidità, dove il volume rialzista è uguale al volume ribassista. Una linea di deviazione rialzista tripla. Una linea di deviazione ribassista tripla. Punti viola e blu che indicano un volume elevato. Il punto viola indica un volume maggiore di
Questo indicatore è uno strumento interattivo di etichettatura delle Onde di Elliott per MetaTrader 4 e 5. Consente all’utente di posizionare manualmente le etichette delle onde direttamente sul grafico, selezionando la dimensione dell’etichetta, il colore e il tipo di onda (correzioni ABC, impulsi a 5 onde o strutture WXY) da un menu sul grafico. Con un solo clic sul grafico, l’indicatore posiziona in modo sequenziale le etichette delle onde appropriate nel prezzo e nel tempo scelti, aiutando i
FREE
Naturu
Ivan Stefanov
5 (1)
“Naturu” è un indicatore manuale che utilizza la simmetria della natura come algoritmo. Conquista il mercato con una strategia semplice e saggezza nascosta! Quando carichi l’indicatore, vedrai due linee: Top e Bottom. Clicca una volta su una linea per attivarla. Per spostarla, basta cliccare sulla candela dove vuoi posizionarla. Definisci un punto alto e un punto basso, e l’indicatore calcola automaticamente: Una zona magenta che mostra dove gli interessi di tori e orsi sono più vicini, ossia l
Sense
Ivan Stefanov
5 (2)
SENSE è un sistema automatizzato che combina metodi GANN selezionati con calcoli frattali. Il sistema ci dice dove aprire e chiudere le operazioni. Non è più necessario perdere tempo in calcoli complessi: SENSE fa tutto per voi. Basta installare l'indicatore. Principi di base: Il mercato è rialzista quando il prezzo è al di sopra delle linee bianche. Comprate sopra le linee bianche, fermatevi sotto Le linee verdi sono obiettivi al rialzo Il mercato è ribassista quando il prezzo è al di sott
Imbalance Pro
Ivan Stefanov
5 (4)
L'indicatore misura lo squilibrio tra tori e orsi in un periodo scelto e mostra una linea retta tra i due punti. Se i tori hanno più volume degli orsi, la linea diventa verde.  Se gli orsi hanno più volume, la linea diventa rossa. La linea mostra anche la differenza percentuale di volume. L'indicatore mostra gli stessi dati in una finestra separata. È possibile vedere anche il volume diviso. L'indicatore ha due modalità. A tale scopo, in alto a sinistra è presente un pulsante che,  - se n
Separated Volume
Ivan Stefanov
5 (1)
Questo indicatore separa efficacemente il volume dei tick nel mercato forex in categorie rialziste e ribassiste. Inoltre, fornisce la funzionalità di calcolare e visualizzare la somma dei volumi dei tick rialzisti e ribassisti per qualsiasi periodo selezionato a scelta. È possibile regolare facilmente il periodo spostando le due linee blu sul grafico, consentendo un'analisi dei volumi personalizzabile e precisa, adatta alle proprie esigenze di trading. Se lo trovate utile, le vostre recensio
FREE
Two Snakes
Ivan Stefanov
5 (1)
2 SNAKES è un sistema di scalping di prima classe. Poiché gli inserimenti sono piuttosto precisi, è probabile che diventiate dipendenti da questo sistema molto rapidamente.  Avete 2 serpenti. Quando vedete una candela al di sopra o al di sotto di esse che non le tocca, questo è il vostro segnale di scalping. Se si utilizza un time frame più ampio, lo scalping può diventare trend following. Le serpentine sono calcolate con precisione in relazione allo stato attuale del mercato. NON SONO me
Questo indicatore si basa sull'esperienza pratica.  Inserite la data/ora del vostro top/bottom. Calcola il livello più visitato dal top/bottom fino al momento attuale. Si aggiorna automaticamente a ogni nuova candela. È possibile utilizzare contemporaneamente più indicatori per diversi trend e timeframe. La lunghezza è sempre tracciata dall'inizio del periodo fino al presente. Utile strumento PRO.
FREE
Levelss
Ivan Stefanov
5 (1)
L'indicatore LEVELSS mostra: - Zona rialzista e ribassista giornaliera. È visibile tutti i giorni dalle 00:00 alle 23:59.  - La zona rialzista e ribassista settimanale. È visibile da lunedì 0:00 a venerdì 23:59 ogni settimana. - Canale appositamente calcolato da un timeframe specifico che viene visualizzato su tutti gli altri timeframe. Per impostazione predefinita, si tratta del timeframe a 4 ore, che può essere modificato in qualsiasi altro timeframe si desideri operare. Viene calcolato senz
GANN Master
Ivan Stefanov
5 (1)
Gli obiettivi precisi di GANN sono calcolati secondo i suoi metodi collaudati e presentati chiaramente davanti a te. Questo strumento è progettato per rendere il trading più fluido e intuitivo. Spostando la linea bianca verso l'alto o quella verde verso il basso, capirai subito perché le tecniche di GANN rimangono influenti nel mondo del trading. Le strategie di GANN si concentrano sulla previsione dei movimenti di mercato con grande precisione, e questo strumento porta quel potere a portata di
Stefanov
Ivan Stefanov
The indicator displays support and resistance zones defined logically using the MACD. The entire concept is explained in the video, with specific examples shown. The indicator works on any instruments and timeframes. It does not repaint. After placing it on the chart, please go through all the timeframes sequentially, from monthly to 1-minute, so that all lines load correctly. After that, you can start using it. The concept is unique and has not been seen in other systems or indicators.
Fifty Pro
Ivan Stefanov
5 (1)
L'indicatore FIFTY è ora disponibile in una versione automatizzata, eliminando la necessità di tracciare manualmente i livelli. Questa versione disegna automaticamente i livelli giornalieri, settimanali, mensili e annuali sul grafico, garantendo precisione e risparmiando tempo. Inoltre, sono presenti pulsanti per attivare o disattivare la visibilità di questi livelli, offrendo una personalizzazione completa. Per chi lo preferisce, la versione gratuita dell'indicatore rimane disponibile e complet
Naturu MT4
Ivan Stefanov
“Naturu” è un indicatore manuale che utilizza la simmetria della natura come algoritmo. Conquista il mercato con una strategia semplice e saggezza nascosta! Quando carichi l’indicatore, vedrai due linee: Top e Bottom. Clicca una volta su una linea per attivarla. Per spostarla, basta cliccare sulla candela dove vuoi posizionarla. Definisci un punto alto e un punto basso, e l’indicatore calcola automaticamente: Una zona magenta che mostra dove gli interessi di tori e orsi sono più vicini, ossia l’
Balance Levels è un indicatore di trading facile da usare che fornisce chiari segnali di acquisto e vendita insieme a livelli di prezzo dinamici, aiutando i trader a pianificare ingressi e uscite con maggiore sicurezza. Lo strumento è molto flessibile – può essere utilizzato come strategia autonoma oppure integrato in qualsiasi sistema di trading esistente. Funziona su tutti i timeframe e su tutti i mercati : Forex, Oro, Indici, Criptovalute o Azioni. Balance Levels si adatta a ogni stile di tra
Enigmera MT5
Ivan Stefanov
3.67 (3)
ENIGMERA: Il nucleo del mercato (Questo è un indicatore manuale e contiene funzioni che potrebbero non essere supportate dall’attuale ambiente di test di MetaTrader) Introduzione Questo indicatore e sistema di trading rappresentano un approccio unico ai mercati finanziari. ENIGMERA utilizza cicli frattali per calcolare con precisione i livelli di supporto e resistenza. Mostra la fase autentica di accumulazione e fornisce direzione e obiettivi. È un sistema che funziona sia in tendenza che in fas
Livelli leggendari di William Gann in un indicatore MT5 completamente automatizzato. GANN Master individua le zone chiave in cui il prezzo è più probabile che si inverta o continui il trend, basandosi sui dati Daily, Weekly e Monthly. Funzionalità principali Pulsanti a clic singolo per il periodo: clicca Daily, Weekly o Monthly per tracciare istantaneamente le zone relative al giorno, alla settimana o al mese correnti Modalità Automatica e Manuale • Automatica: GANN Master calcola tutti i livell
SPEKULATOR è un sistema di trading manuale e un indicatore che ti aiuta a identificare le zone di supporto chiave e la direzione del mercato. Padroneggia il mercato con una strategia semplice e una saggezza nascosta. Selezioni un qualsiasi TOP e BOTTOM nel grafico, e l'indicatore disegna: Una zona di supporto per il tuo trend. Per una tendenza rialzista, appare una zona verde; per una tendenza ribassista, una zona rossa. La sensibilità della zona di supporto può essere regolata nelle impostazion
Time Zones Fifty L’indicatore risolve un problema fondamentale: Come dobbiamo contare il tempo? Quali zone usare, come e perché? È basato interamente sulla logica. Applicazione delle zone temporali Per applicare le zone temporali serve un punto di partenza. Questo punto deve essere definito logicamente, non scelto a caso. Alcuni scelgono di iniziare da: il primo giorno dell’anno, il primo giorno del mese, l’inizio di un trimestre o di una settimana. Ma ciò presuppone che l’attività del mercato s
Balance Levels is an easy-to-use trading indicator that provides clear buy and sell signals along with dynamic price levels, helping traders plan their entries and exits with more confidence. The tool is highly flexible – it can be used as a standalone strategy or integrated into any existing trading system. It works on all timeframes and across all markets: Forex, Gold, Indices, Crypto, or Stocks. Balance Levels suits every trading style – from scalping and intraday, to swing trading and even l
L’indicatore Volume Equilibrium mostra i livelli in cui il volume rialzista è uguale al volume ribassista. Può calcolare questi livelli per ogni giorno, settimana, mese e anno. Quando il prezzo si trova sopra la linea, significa che il volume è dalla parte dei compratori e il mercato è rialzista. Quando il prezzo si trova sotto la linea, significa che il volume è dalla parte dei venditori e il mercato è ribassista. L’indicatore utilizza l’algoritmo dell’indicatore “Meravith” per calcolare i live
Filtro:
onermentes
19
onermentes 2025.06.17 18:57 
 

Yaklaşık olarak 10 yıldır forex piyasasında işlem yapmaktayım. Pek çok indikatör taradım ve aldım. Neredeyse bir çoğu çöptü diyebilirim. Enigmera indikatörden ziyade bir starteji yapmamı sağlamakta. Girmiş olduğum pozisyonlarda korkumu yenmeme katkı sağladı. Daha önce erken kapatmak zorunda olduğum pozisyonlarda bearish veya bullish hedefler neredeyse tam anlamıyla doğru çalışmakta ve buna bağlı olarak pozisyonlarımı daha uzun tutabilme güvenini sağladı. Özellikle support line çok ciddi olarak destek veya direnç olarak çalışmakta. Para yapmanıza kesinlikle katkı sağlayacaktır. Ivan teşekkür ederim.

TANJU2690
569
TANJU2690 2025.03.05 13:37 
 

I have never and ever seen any system like Enıgmera. What ever you want, you can find on it. İt is incredible system. And Cretor of aenıgmera, Mr.Ivan is more and more helpfull to understant of logıc Enigmera. Fistly, I want sent all thankfull to Ivan because he teach me Enıgmera Logıc and also share this marvelous product with market

smso9466eiou
172
smso9466eiou 2025.02.23 15:38 
 

a very good indicator that composes all in one, entry, exit and reverse. Great!

Ivan Stefanov
5999
Risposta dello sviluppatore Ivan Stefanov 2025.02.23 18:12
Thank you! Wishing you profits!
Rutt Tungkiratichai
2725
Rutt Tungkiratichai 2025.02.01 00:11 
 

This is very good and accurate indicator.

Ivan Stefanov
5999
Risposta dello sviluppatore Ivan Stefanov 2025.02.01 11:30
Thank you for the good words! Brgds / Ivan
Osazeme Usen
634
Osazeme Usen 2024.12.31 12:38 
 

This is probably the best indicator I have seen in marketplace. Fantastic analysis with phenomenal success rates.

Update: Not great for direction, but fantastic for TP and SL.

Ivan Stefanov
5999
Risposta dello sviluppatore Ivan Stefanov 2025.01.02 16:45
Osazeme Usen 2024.12.31 12:38 # EN
This is probably the best indicator I have seen in marketplace. Fantastic analysis with phenomenal success rates. Thank you for the good words! Brgds/Ivan
vincenzo1964
1130
vincenzo1964 2024.07.11 15:59 
 

Assolutamente straordinario a cominciare da chi l'ha ideato Ivan, Sono assolutamete felice dell'affito/prova fatto, Enigmera è sorprendente, ti accompagna sempre sul lato giusto della tendenza sino alla fine del percorso. Se poi parliamo del dott. Ivan e della sua disponbilità, se potessi postare gli screenshot e la guida passo passo che mi ha concesso, è commovente e sorprendente. Se volete fare buon trading con giudizio e responsabilità potete tranquillamente perdere qualche giorno del vostro tempo a capire la logica ed il ragionamento che c'è dietro enigmera, solo così sarete sempre dal lato giusto del trend sino alla fine, sopratutto quando ci sono le news ed enigmera già vi sta indicando i livelli di tp da raggiungere. Proprio oggi ero già lon su eurusd e sell su usdchf ed entrambe dopo le notizie chiuse in tp. Consiglio anche l'indicatore Speed, leggetene l'utilizzo, la forza e ciò che vi può indicare, io ci sto lavorando sodo seguito da ivan perchè l'unione di enigmera e speed è devastante, alla fine dell'affitto acquisterò engmera mentre affitterò mensilmente speed (il costo è di 30.00€ mentre l'acquisto è di 3000€), ma il suo potenziale per il trend followhing e immenso, saluti e buon trading a tutti, grazie Ivan...

Irfan
1492
Irfan 2024.06.21 13:44 
 

L'utente non ha lasciato alcun commento sulla valutazione.

Ivan Stefanov
5999
Risposta dello sviluppatore Ivan Stefanov 2025.01.02 16:46
Irfan 2024.06.21 13:44 # EN
Enigmera gives you an entirely different way of looking at the market. It does not look into the past, what has happened in the past stays in the past it gives you a picture of what is going on in the market right now and gives you logical understanding for trading. The author is so confident about his product the he gave me a full version of the indicator so that I could try it for a week before I decided to buy it. Ivan spent a lot of time chatting with me, educating me how to use the indicator. He is very quick and replies to your questions. I have already seen good results with this indicator and it has increased my confidence. Thank you for the good words, Irfan!
Sajid Iqubal
184
Sajid Iqubal 2024.06.08 21:59 
 

Enigmera is an exceptional trading indicator that has greatly improved my trading performance. Ivan Stefano offers the best support and guidance, always going above and beyond like an elder brother to me. His guidance and the effectiveness of Enigmera make a winning combination. I highly recommend using Enigmera.

eman11
1455
eman11 2023.11.22 20:29 
 

L'utente non ha lasciato alcun commento sulla valutazione.

Ivan Stefanov
5999
Risposta dello sviluppatore Ivan Stefanov 2025.01.02 16:47
eman11 2023.11.22 20:29 # EN
I was an institutional trader for a decade and rarely write reviews or spend more then 50 or a 100 on any indicator as my trading is well established, but always open to something interesting and new. The author is an intelligent and real trader , per many chats with him, and this indicator compliments well existing trading as is from a unique perpective. The price is not cheap , but it it is a legit and unique system, is as decribed, which can be put to good use particulalry with experienced traders who may best integrate multiple styles and ideas successfully. Great work Ivan. Thank you for the good words, Eman11 / Brgds / Ivan
ebel
1221
ebel 2023.11.22 14:41 
 

This indicator is undoubtedly expensive but I believe it to be the Ferrari of indicators and the only one you will ever need. The video in the overview is self explanatory, take the time to find the setups as described and the R:R can be extremely good. I have only been using the indicator for a week but have found several very profitable trades and feel confident that I can make back more than sufficient each month to cover my 6 monthly rental. The author is extremely responsive and helpful and is starting a telegram group so that we can share prospective setups. I believe the indicator is difficult to get to work in Strategy Tester but the author is open to free trials which demonstrates his trust in the product. I can't post images here but I will post a trade I made this morning in the comments. I can't promise it is the perfect setup as I am still learning but just this one trade covered my monthly rental cost. IMPORTANT - do not try to change to a lower timeframe while the indicator is loaded. The code is incredibly complex and trying to recalculate everything on a lower tf over a significant period will freeze your MT4 installation. You will need to delete the indicator from your MT4, force a shut down, restart and re-install. Once you understand the complexity it is not a problem, just open another chart on a lower tf or delete the indicator, change the tf and put it back on.

UPDATE 23/11

I have just seen that the author has been debarred from selling! I have just paid for 6 months rental and this is a good indicator that is making me money. What to I do after 6 months if I can't renew? And why has this happened, the author is very courteous and helpful.

Rispondi alla recensione