Enigmera

5

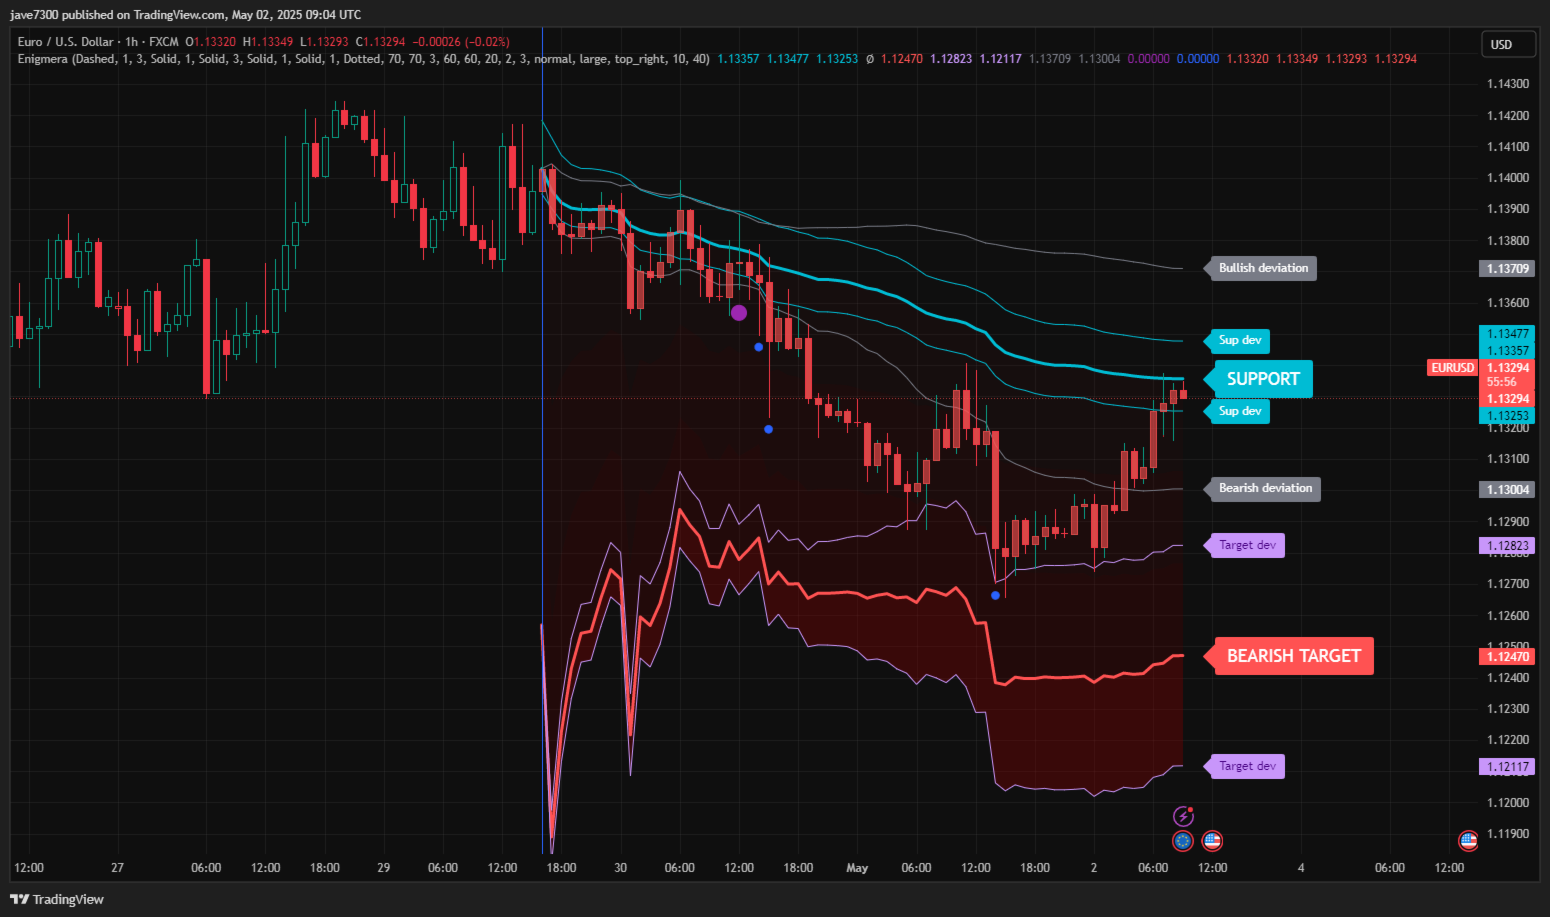
ENIGMERA : Le cœur du marché

Important : La démo de MQL5.com fonctionne dans le Strategy Tester et peut ne pas refléter pleinement les fonctionnalités d'Enigmera. Consultez la description, les captures d'écran et la vidéo pour plus de détails. N'hésitez pas à m'envoyer un message si vous avez des questions !

Le code de l'indicateur a été entièrement réécrit. La version 3.0 ajoute de nouvelles fonctionnalités et corrige les bugs accumulés depuis le lancement de l'indicateur.
Introduction
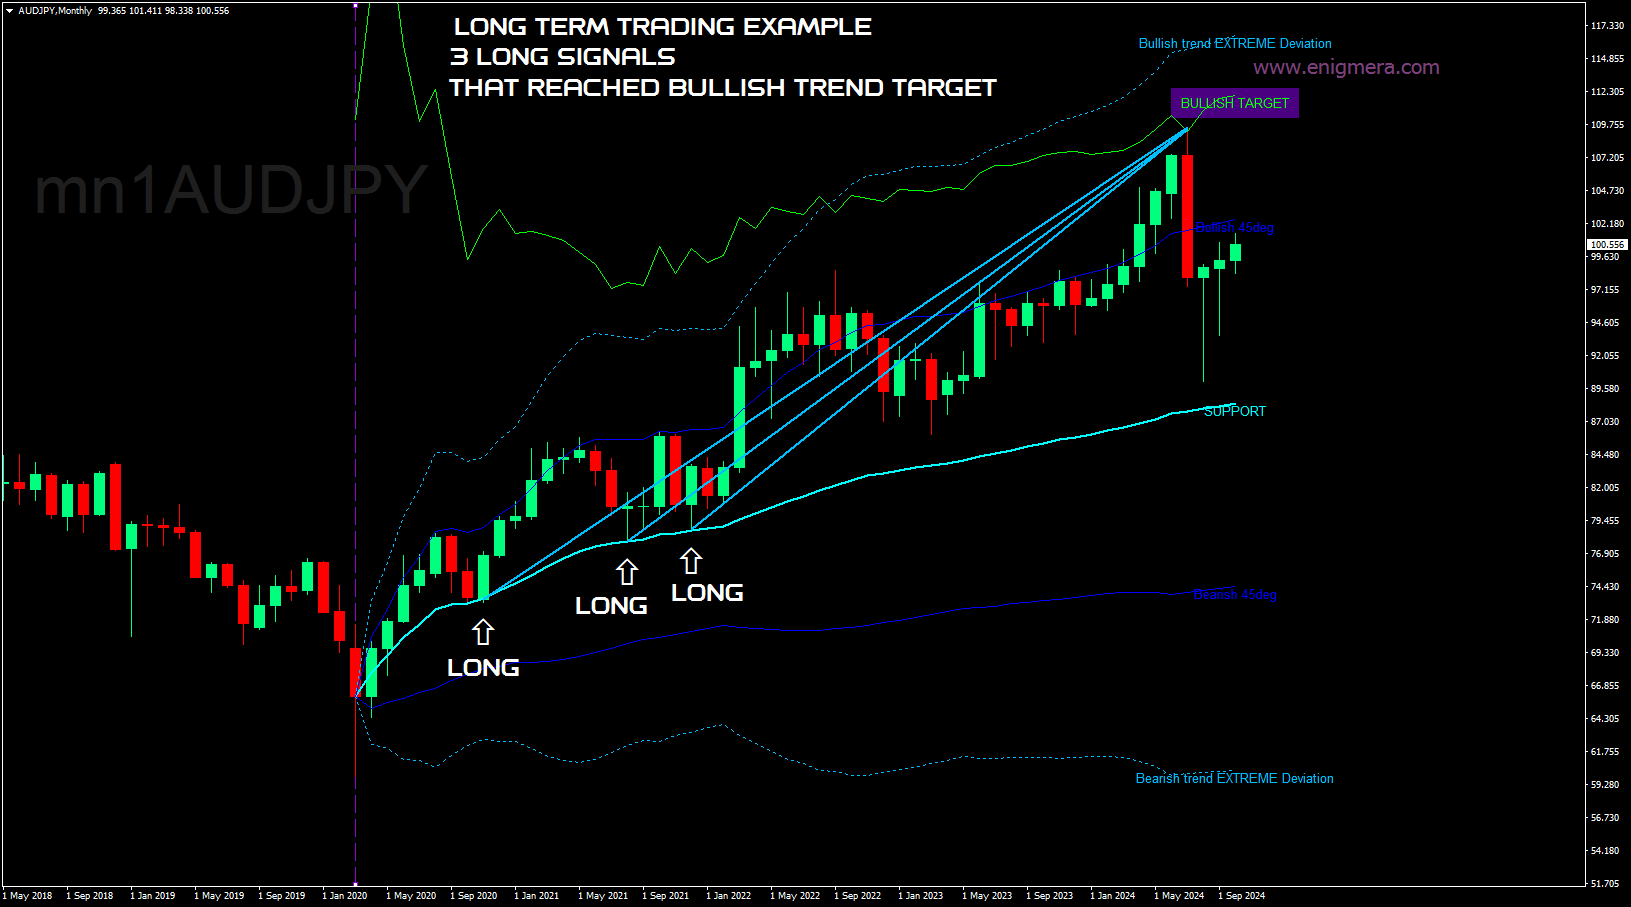
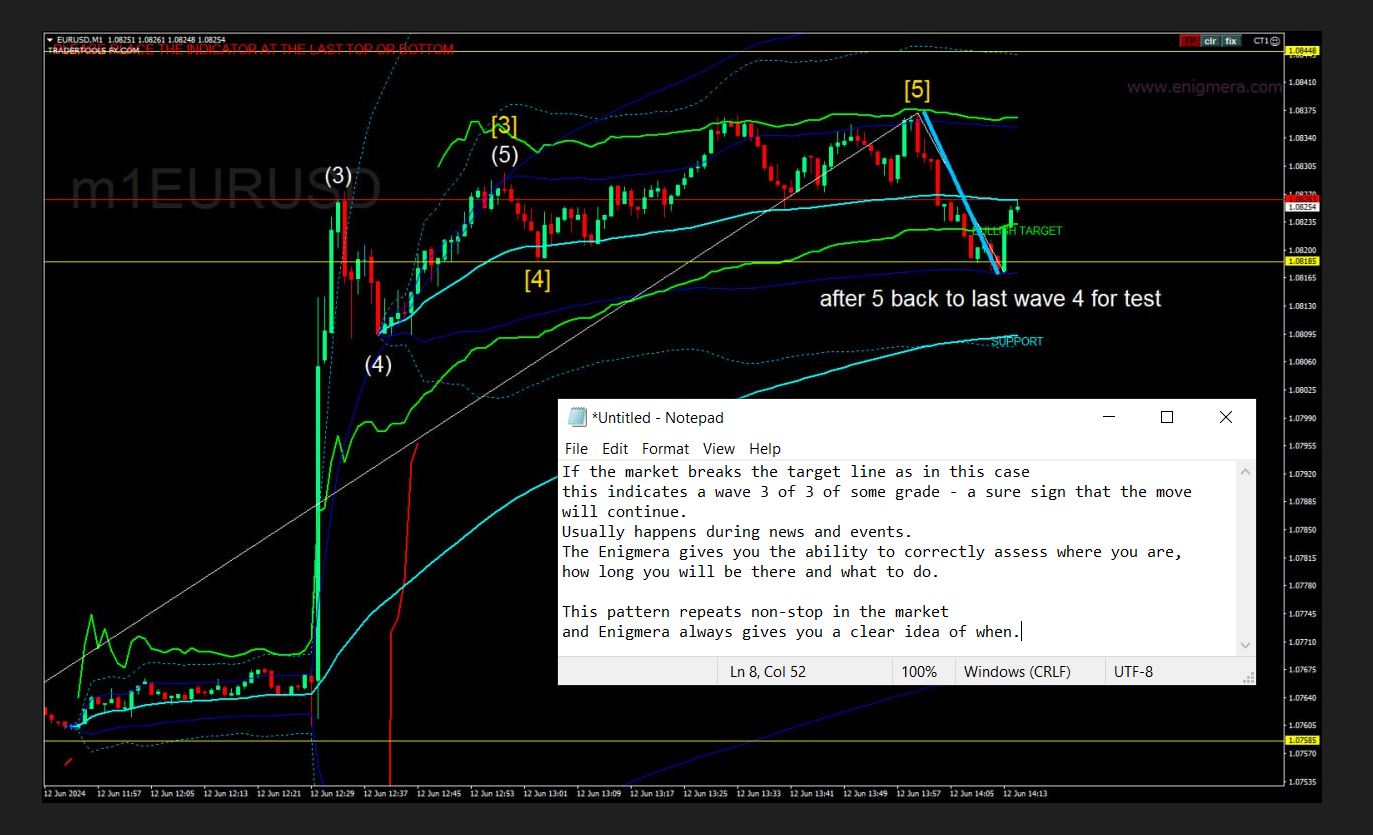
Cet indicateur et système de trading est une approche remarquable des marchés financiers. ENIGMERA utilise des cycles fractals pour calculer avec précision les niveaux de support et de résistance. Il montre la véritable phase d'accumulation et fournit des directions et des objectifs. Un système qui fonctionne aussi bien dans une tendance que dans une correction.

Comment ça fonctionne
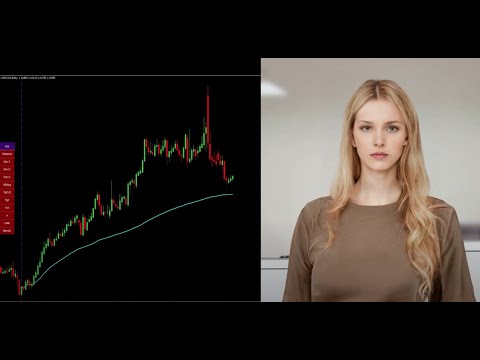
La plupart des fonctionnalités de l'indicateur sont contrôlées via des boutons situés à gauche du graphique, permettant une réponse rapide à différentes conditions du marché.

Boutons

  1. ON/OFF – Affiche ou cache l'indicateur entier.
  2. Channel – Active le canal de support, indiquant une plage acceptable de déviation.
  3. Dev1 (Première déviation) – Indique les mouvements de prix à l'intérieur de la déviation de support, signalant une consolidation du marché ou une accumulation de force.
  4. Dev2 (Deuxième déviation) – Montre les mouvements de prix entre les déviations, signalant la formation et la direction de la tendance.
  5. Dev3 (Troisième déviation) – Indique une accélération significative de la tendance et une forte volatilité.
  6. 45deg (45 degrés) – Montre la vitesse du marché et la stabilité des mouvements par rapport à la ligne des 45 degrés.
  7. Tgt1/2 (Objectif partiel) – Représente la moitié de la ligne d'objectif de la tendance, utilisée dans la phase finale du marché.
  8. Tgt (Objectif) – La ligne d'objectif de la tendance, indiquant les niveaux où fermer des positions.
  9. Vol (Volume) – Affiche des points de volume sur les bougies pour indiquer des changements significatifs dans le volume du marché.
  10. X – Affiche un "X" lorsque le marché atteint la ligne d'objectif.
  11. Lbls (Étiquettes) – Affiche ou cache les étiquettes sur les lignes.
  12. RandC (Couleurs aléatoires) – Change les couleurs des lignes et des étiquettes de l'indicateur pour une meilleure visualisation.

Système
ENIGMERA offre une image complète de la situation actuelle, contrairement aux indicateurs de marché typiques qui extrapolent simplement les données passées dans le présent et l'avenir. Si vous êtes sur le support, c'est un vrai support ; si vous êtes sur la résistance, c'est une vraie résistance. Un niveau cassé indique un changement de tendance.

ENIGMERA est conçu pour les analystes financiers et les consultants qui ont besoin de partager des informations fiables avec leurs clients, ainsi que pour les investisseurs qui exigent une précision et une confiance maximales.

Il se distingue par sa précision optimale, permettant aux traders d'évaluer leurs options avec clarté et confiance.

En combinant 20 ans d'expérience en trading et de connaissances dans un package complet, ENIGMERA est à la fois intuitif et dépendant de l'utilisateur. Son efficacité dépend d'une configuration correcte par l'utilisateur pour maximiser la performance.

Recommandations :

  • Paires de devises : Toutes les paires, tous les marchés
  • Cadre temporel : Tous les cadres temporels
  • Dépôt minimum : Aucun dépôt minimum
  • Type de compte : Aucune limitation
  • Courtiers : Aucune limitation

Cet indicateur sophistiqué est idéal pour des stratégies de trading journalier et de scalping efficaces. Optimisez votre trading discrétionnaire avec les algorithmes avancés d'Enigmera, adaptés aux marchés Forex, actions, indices et crypto-monnaies. Conçu pour MetaTrader 4, Enigmera simplifie la gestion des stop-loss et des risques.

Tous les outils dont vous avez besoin pour devenir un trader performant. Enigmera fonctionne sur tous les marchés et tous les cadres temporels, sans redessiner.

Êtes-vous prêt à porter vos décisions financières au niveau ultime ?


Avis 10
onermentes
19
onermentes 2025.06.17 18:57 
 

Yaklaşık olarak 10 yıldır forex piyasasında işlem yapmaktayım. Pek çok indikatör taradım ve aldım. Neredeyse bir çoğu çöptü diyebilirim. Enigmera indikatörden ziyade bir starteji yapmamı sağlamakta. Girmiş olduğum pozisyonlarda korkumu yenmeme katkı sağladı. Daha önce erken kapatmak zorunda olduğum pozisyonlarda bearish veya bullish hedefler neredeyse tam anlamıyla doğru çalışmakta ve buna bağlı olarak pozisyonlarımı daha uzun tutabilme güvenini sağladı. Özellikle support line çok ciddi olarak destek veya direnç olarak çalışmakta. Para yapmanıza kesinlikle katkı sağlayacaktır. Ivan teşekkür ederim.

TANJU2690
529
TANJU2690 2025.03.05 13:37 
 

I have never and ever seen any system like Enıgmera. What ever you want, you can find on it. İt is incredible system. And Cretor of aenıgmera, Mr.Ivan is more and more helpfull to understant of logıc Enigmera. Fistly, I want sent all thankfull to Ivan because he teach me Enıgmera Logıc and also share this marvelous product with market

smso9466eiou
152
smso9466eiou 2025.02.23 15:38 
 

a very good indicator that composes all in one, entry, exit and reverse. Great!

Produits recommandés
This is an arrow indicator without a future function,developed based on the most advanced profit trading algorithms.It has the most innovative and advanced dual trend analysis module, as well as the latest and highly effective market trend prediction algorithm.Trends are your friends, and following larger trends can earn the maximum profit in foreign exchange. This indicator helps traders identify current trends and track them. Someone once made a profit of 10 times in a week by relying on it.No
Gartley Projection D
Oleksandr Medviediev
3.71 (7)
The indicator identifies the harmonic patterns (XABCD) according to developments of H.M.Gartley ( "Profits in the Stock Market" , 1935г). It projects D-point as a point in the perspective projection (specify ProjectionD_Mode = true in the settings). Does not redraw. When a bar of the working timeframe closes, if the identified pattern point has not moved during Patterns_Fractal_Bars bars, an arrow appears on the chart (in the direction of the expected price movement). From this moment on, the ar
Alpha Trend sign est notre outil de Trading très populaire depuis longtemps, il valide notre système de Trading et invite clairement les signaux de Trading sans dérive. Fonctions principales: • En fonction de la zone active du marché, selon les indicateurs, il est intuitif de déterminer si le cours actuel appartient à la tendance ou à la tendance. Et coupez le marché selon les flèches d'indication de l'indicateur, les flèches vertes suggèrent d'acheter et les flèches rouges suggèrent de vend
Robot scalpeur pour la période M5. Négocie sur la paire de devises GBPUSD. Ce robot a été spécialement développé par une société de traders professionnels pour le trading de la livre sterling. Le robot ouvre environ 5 à 15 transactions par jour. Il est préférable de négocier avec des courtiers qui ont un faible écart sur GBPUSD jusqu'à 10 pips. Le dépôt minimum recommandé pour commencer est de 500 $ ou plus. Avantages : n'utilise pas de martingale. pas un filet. chaque transaction a un stop lo
PZ Harmonacci Patterns
PZ TRADING SLU
3.17 (6)
Trade smarter, not harder: Empower your trading with Harmonacci Patterns This is arguably the most complete harmonic price formation auto-recognition indicator you can find for the MetaTrader Platform. It detects 19 different patterns, takes fibonacci projections as seriously as you do, displays the Potential Reversal Zone (PRZ) and finds suitable stop-loss and take-profit levels. [ Installation Guide | Update Guide | Troubleshooting | FAQ | All Products ] It detects 19 different harmonic pric
EARLY REMINDER: The Starting price is 65 price will rise soon up to 365$ and then 750$ after first 10 copies of sales. Grab this offer now! Introduction Hello, traders! Welcome to the demonstration of the Forex Beast Indicator , a comprehensive tool designed to assist aspiring traders in navigating the complexities of the forex market. This indicator incorporates seven essential components to provide a well-rounded trading experience: Moving Averages Colored Zones Support and Resistance Levels
Owl smart levels
Sergey Ermolov
4.24 (37)
Version MT5  |  FAQ L' indicateur Owl Smart Levels   est un système de trading complet au sein d'un seul indicateur qui comprend des outils d'analyse de marché populaires tels que   les fractales avancées de Bill Williams , Valable ZigZag qui construit   la structure d'onde correcte   du marché et   les niveaux de Fibonacci   qui marquent les niveaux exacts d'entrée. sur le marché et les endroits où prendre des bénéfices. Description détaillée de la stratégie Mode d'emploi de l'indicateur Conse
OFFER! OFFER! NEXT Price Will be 650$ and the rental option will be removed after this. Don't miss the current price offer before it is too late. Dear Traders I am so glad to introduce my Super Powers Indicator.  The purpose of this trading tool is to help serious traders who want to make trading one of their main source of income.  I know trading is not an easy task but if you have the right tools, knowledge and motivation to trade then you are ready to go in this industry. My role is to help y
Trend Flasher Trend is your friend is the age old saying quote in trading arena, there are though many ways to gauge the trend and its direction, more scientific measure and logically meaningful will be an ATR break outs to identify and spot the trend and its acceleration, so we created this easy to use trend identification panel and optimized super trend based multi time frame panel entry system to aid and help the traders to make their trading decision. Unique Features of Trend Flasher 1. H
Overview Harmonic Patterns MT4 is a technical analysis indicator designed for the MetaTrader 5 platform. It identifies and displays harmonic price patterns, such as Butterfly, Cypher, Crab, Bat, Shark, and Gartley, in both bullish and bearish directions. The indicator calculates key price levels, including entry, stop loss, and three take-profit levels, to assist traders in analyzing market movements. Visual elements and customizable alerts enhance usability on the chart. Features Detects six ha
El indicador "MR BEAST ALERTAS DE LIQUIDEZ" es una herramienta avanzada diseñada para proporcionar señales y alertas sobre la liquidez del mercado basándose en una serie de indicadores técnicos y análisis de tendencias. Ideal para traders que buscan oportunidades de trading en función de la dinámica de precios y los niveles de volatilidad, este indicador ofrece una visualización clara y detallada en la ventana del gráfico de MetaTrader. Características Principales: Canal ATR Adaptativo: Calcula
Happy Scalping Indicator
Leandro Bernardez Camero
Ce indicateur a été conçu pour un scalping agressif et des entrées rapides dans les options binaires , générant des signaux sur chaque bougie afin que vous puissiez savoir exactement ce qui se passe à tout moment. Rejoignez le canal Happy Scalping : MQL5 Ne repince pas : le signal de la bougie actuelle est généré en temps réel , ce qui signifie qu'il peut changer pendant que la bougie est encore en formation, selon que le prix monte ou descend par rapport à la clôture de la bougie précédente.
Stochastic Visual MTF for MT4
Naththapach Thanakulchayanan
This MT4 indicator, Stochastic Visual MTF, summarize the oscillator values in color graphic for both  Main and Signal in current market emotion stage which will show you in multi timeframes (9) and sum of the total Main and Signal oscillator values which is an important information for traders especially you can see all oscillator values in visualized graphic easily, You can add more by Shift, Hope it will be helpful tool for you for making a good decision in trading.
Chart Patterns Detect 15 patterns (Ascending Triangle, Descending Triangle, Rising Wedge, Falling Wedge, Bullish Flag, Bearish Flag, Bullish Rectangle, Bearish Rectangle Symmetrical triangle, Head and Shoulders, Inverted Head and Shoulders, Triple top, Triple Bottom, Double Top, Double Bottom) Use historical data to calculate the probability of each pattern to succeed (possibility to filter notification according to the chance of success) gives graphic indication about the invalidation level and
Voenix
Lorentzos Roussos
4.58 (12)
Motifs harmoniques , scanner et commerçant  Patrons inclus : Modèle ABCD Motif Gartley Motif chauve-souris Modèle de chiffrement Modèle 3Drives Motif cygne noir Motif cygne blanc Motif Quasimodo ou motif Over Under Modèle de chauve-souris alternative Motif papillon Motif de crabe profond Motif crabe Motif requin Motif FiveO Motif tête et épaules Motif triangle ascendant Modèle un deux trois Et 8 motifs personnalisés Voenix est un scanner de modèles harmoniques multi-périodes et multi-paires, pr
FTMO Smart Trader EA
Tshivhidzo Moss Mbedzi
4 (3)
FTMO Smart Trader EA – The Ultimate MT4 Expert Advisor for Prop Firm Challenge Success Achieve funded trader status with confidence. The FTMO Smart Trader EA is a professional MetaTrader 4 Expert Advisor designed to help traders pass and manage proprietary firm challenges such as FTMO , Funded Next , and My Forex Funds (MFF) . This fully automated Forex robot is engineered for consistency, stability, and compliance — built to meet strict prop firm rules and risk parameters with precision. Adva
"Auto FIBO Pro" Crypto_Forex indicator - est un excellent outil auxiliaire dans le trading ! - L'indicateur calcule et place automatiquement sur le graphique les niveaux de Fibo et les lignes de tendance locales (couleur rouge). - Les niveaux de Fibonacci indiquent les zones clés où le prix peut s'inverser. - Les niveaux les plus importants sont 23,6 %, 38,2 %, 50 % et 61,8 %. - Vous pouvez l'utiliser pour le scalping inversé ou pour le trading en grille de zones. - Il existe également de nomb
Forex Gump
Andrey Kozak
2.4 (5)
Forex Gump is a fully finished semi-automatic trading system. In the form of arrows, signals are displayed on the screen for opening and closing deals. All you need is to follow the instructions of the indicator. When the indicator shows a blue arrow, you need to open a buy order. When the indicator shows a red arrow, you need to open a sell order. Close orders when the indicator draws a yellow cross. In order to get the most effective result, we recommend using the timeframes H1, H4, D1. There
The Th3Eng PipFinite indicator is based on a very excellent analysis of the right trend direction with perfect custom algorithms. It show the true direction and the best point to start trading. With StopLoss point and Three Take Profit points. Also it show the right pivot of the price and small points to order to replace the dynamic support and resistance channel, Which surrounds the price. And Finally it draws a very helpful Box on the left side on the chart includes (take profits and Stop loss
Cet indicateur détectera les motifs harmoniques tracés sur le graphique à l'aide de méthodes manuelles et automatiques. Ajoutez votre avis, s'il vous plaît. Notes: Cet indicateur dispose d'un panneau de contrôle et il enregistrera chaque réglage (graphique et unité de temps). Vous pouvez le réduire pour avoir plus d'espace sur le graphique et vous pouvez appuyer sur le bouton de fermeture pour masquer toutes les données de l'indicateur sur le graphique si vous préférez travailler avec d'autres o
Embark on the pinnacle of Binary Options evolution. Our indicator isn't just adaptive—it's relentless. Picture a ninja riding a serpent, shadowing its every move; that's how this tool trails the market trend, unwavering till the end. Built upon the foundational prowess of the Ichimoku indicator and honed with an array of fine-tuned oscillators, it epitomizes accuracy and precision. Dive deep without getting lost in the Ichimoku's intricacies—our indicator simplifies the process for you. Perhaps
Gold Titan King Scalper
Dodong Christian Arnon
Indicator Description GOLD TITAN KING SIGNAL INDICATOR High-Precision Gold Scalping Buy/Sell Signals – Manual Trading Assistant Overview The Gold Titan King Signal Indicator is a manual trading assistant tool designed for high-frequency scalping on Gold (XAUUSD) and other major pairs. It generates clear BUY/SELL signals with precise entry levels, along with adjustable Stop Loss and Take Profit levels displayed directly on the chart. ️ This tool is NOT an EA. It does not execute trades
Mac-Binary option Signals is unique mathematical concept to trade iqoptions,binary,rocketoptions specter or any other binary options company 1 min 5 expiry run robot 30min everyday and fill profit and loss ratios inside mt2iq/mt2binary and run or 1min to 5min expiry ...go to setting in mt2iq robot allow otc and digital options. and select risk 500and profit 300$ per day it can stop automatically after profit or loss... If it can close after loss restart and Reset profit and loss button run again
Reversal Pattern Pro
Boonyapagorn Rodvattanajinda
Reversal Patterns Pro Reversal Patterns Pro is a Price Action (PA) analytical tool that scans the reversal patterns.  - Finds and marks the most dependable Japanese candlestick patterns in real-time. - Supports all time frames (Best for Scalping) - Doesn't repaint making it an exceptional indicator for Expert Advisors. Input parameters : - Support & Resistance Mode ( true or false ) for enabling advanced filtering - Donchian Period - RSI Period - RSI Oversold Level - RSI Overbought Level - Al
Night ghost
Dmitriy Kashevich
Night Ghost - Indicateur de flèche pour les options binaires. Ceci est un assistant fiable pour vous à l'avenir! - Pas de redessin sur le graphique -Fonctionne très bien sur toutes les paires de devises ! -Précision de l'indicateur jusqu'à 90% (surtout la nuit) -Pas besoin de configurer pendant une longue période (configurer parfaitement pour les options binaires) - Pas de signaux en retard - L'apparition d'un signal sur la bougie en cours -Parfait pour la période M1 (Pas Plus !) - Cou
The indicator detects and displays М. Gartley's Butterfly pattern. The pattern is plotted by the extreme values of the ZigZag indicator (included in the resources, no need to install). After detecting the pattern, the indicator notifies of that by the pop-up window, a mobile notification and an email. The pattern and wave parameters are displayed on the screenshots. The default parameters are used for demonstration purposes only in order to increase the amount of detected patterns. Parameters z
L'indicateur SMC Venom Model BPR est un outil professionnel pour les traders travaillant dans le concept Smart Money (SMC). Il identifie automatiquement deux modèles clés sur le graphique des prix: FVG   (Fair Value Gap) est une combinaison de trois bougies, dans laquelle il y a un écart entre la première et la troisième bougie. Forme une zone entre les niveaux où il n'y a pas de support de volume, ce qui conduit souvent à une correction des prix. BPR   (Balanced Price Range) est une combinaiso
Trend PA
Mikhail Nazarenko
5 (3)
The Trend PA indicator uses   Price Action   and its own filtering algorithm to determine the trend. This approach helps to accurately determine entry points and the current trend on any timeframe. The indicator uses its own algorithm for analyzing price changes and Price Action. Which gives you the advantage of recognizing, without delay, a new nascent trend with fewer false positives. Trend filtering conditions can be selected in the settings individually for your trading style. The indicator
Le Capteur de Tendance (The Trend Catcher) : La stratégie Trend Catcher avec indicateur d’alerte est un outil d’analyse technique polyvalent qui aide les traders à identifier les tendances du marché ainsi que les points d’entrée et de sortie potentiels. Elle dispose d’une stratégie Trend Catcher dynamique, s’adaptant aux conditions du marché pour offrir une représentation visuelle claire de la direction de la tendance. Les traders peuvent personnaliser les paramètres selon leurs préférences et l
FREE
This system is very useful for trading because it solves several classic problems: 1. Objectivity & Precision Benefit: It eliminates the trader's personal bias. Every trader might draw a trendline slightly differently, but this indicator uses a precise mathematical logic (Fractals) to find the pivot points. The resulting lines are objective and consistent every time. 2. ️ Dynamic Updates Benefit: Your chart is always current. As soon as a new pivot is confirmed, the new trendline is drawn
Les acheteurs de ce produit ont également acheté
BinaryUniversal
Andrey Spiridonov
BinaryUniversal is a signal indicator for binary options and Forex. In its work, the indicator uses a complex algorithm for generating signals. Before forming a signal, the indicator analyzes volatility, candlestick patterns, important support and resistance levels. The indicator has the ability to adjust the accuracy of the signals, which makes it possible to apply this indicator for both aggressive and conservative trading. The indicator is set in the usual way, it works on any time period and
Predictive Levels
Satya Prakash Mishra
Market predictive price levels are key technical analysis tools is my finest invention through mathematics to predict automatically next price is where to reach after break any levels. A unique name quality it automatically calculate price range its my own invention according price value to predict what's is next price came than after it not fixed levels like Fibonacci or pivots Its Naveen's Predictive Levels .used to forecast where an asset's price might find support (stop falling) or resistanc
Hit Rate Top Bottom Signal
Martin Alejandro Bamonte
Hit Rate Top Bottom Signal Hit Rate Top Bottom Signal Hit Rate Top Bottom Signal offre une approche totalement innovante. Il est idéal pour ceux qui souhaitent évaluer à l’avance comment le signal fonctionne avec un TP-SL spécifique et dans quels PAIRES/TF il est le plus performant. La stratégie Hit Rate Top Bottom Signal est un outil essentiel pour tout trader et type de trading car elle émet non seulement des signaux précis sans redessiner , indiquant clairement quand trader et dans quelle dir
This indicator is a multifunctional technical analysis tool based on the combination of an adaptive exponential moving average and volatility filters calculated through the Average True Range (ATR). It is designed to accurately identify the current price direction, highlight key trend reversal areas, and visualize potential turning zones. The algorithm is built upon the dynamic construction of a trend ribbon using two levels of volatility — outer and inner ranges. The outer boundaries serve as i
#EasyWayTradePanel indicator for #MetaTrader4 , is trade assistants for manual trading in any #currency in #FOREX , #CRYPTOCURRENCY as #Bitcoin , #Ethereum , #Lightcoin and more. Also is EasyWay to use for #COMMODITY as #Gold , #Silver , #Oil , #Gas ...... and #CFDs . When installed on the chart in your chosen time frame and trading tool, the indicator automatically draws the following custom indicators used in the EasyWayTradePanel trading strategy. 1) Zigzag_Extreme_Indicator, 2) Regression_C
This is a mini One pair version of Advanced Detector of Trend Reversal and Continuance known as TrueTrendStarM(TTSm25). It is a sensitive and Predictive indicator of Price Trends for Professional traders.  ( ATTENTION BUYERS:-Now the indicator is available for UNLIMITED TIME ONE TIME buy of just $500 ). Avail the Opportunity.    It detects high odds changes in Price Trend direction long before other indicator detects it. I have been working on it since 2019.    This is possible due to fractal
Dual Momentum
Adolfina Denysenko
Dual Momentum is a modern arrow indicator for MetaTrader 4, created specifically for the accurate detection of market reversals and strong impulse movements. The indicator is based on a combination of two powerful oscillators – Williams %R and RSI, which allows you to filter noise and generate more reliable signals. Thanks to this, Dual Momentum indicates only key entry points when the probability of a successful trade is highest. Key advantages: No redrawing – signals remain on the cha
FFx Engulfing Setup Alerter gives trade suggestions with Entry, Target 1, Target 2 and StopLoss. Below are the different options available: Entry suggestion - pips to be added over the break for the entry 3 different options to calculate the SL - by pips, by ATR multiplier or at the pattern High/Low 3 different options to calculate the 2 TPs - by pips, by ATR multiplier or at Risk/Reward Offset the dashboard - any place on the chart Remove the suggestion once the price reached the SL line Lines
FFx InsideBar Setup Alerter gives trade suggestions with Entry, Target 1, Target 2 and StopLoss. Below are the different options available: Entry suggestion - pips to be added over the break for the entry Minimum candle size - to avoid too close buy/sell entry suggestions 3 different options to calculate the SL - by pips, by ATR multiplier or at the pattern High/Low 3 different options to calculate the 2 TPs - by pips, by ATR multiplier or at Risk/Reward Offset the dashboard - any place on the c
FFx OutsideBar Setup Alerter gives trade suggestions with Entry, Target 1, Target 2 and StopLoss. Below are the different options available: Entry suggestion - pips to be added over the break for the entry. 3 different options to calculate the SL - by pips, by ATR multiplier or at the pattern High/Low. 3 different options to calculate the 2 TPs - by pips, by ATR multiplier or at Risk/Reward. Offset the dashboard - any place on the chart. Remove the suggestion once the price reached the SL line.
FFx PinBar Setup Alerter gives trade suggestions with Entry, Target 1, Target 2 and StopLoss. Below are the different options available: Entry suggestion - pips to be added over the break for the entry Minimum candle size - to avoid too small candles 3 different options to calculate the SL - by pips, by ATR multiplier or at the pattern High/Low 3 different options to calculate the 2 TPs - by pips, by ATR multiplier or at Risk/Reward Offset the dashboard - any place on the chart Remove the sugges
Automatic, live & interactive picture of all trendlines. Assign push, email and sound alerts to the lines of your choice and be informed about price rollback, breakout, rollback after breakout, number of rollbacks, line expiration by double breakout. Correct, drag or delete the lines and interactively tune the line system. https://youtu.be/EJUo9pYiHFA . Chart examples https: //www.mql5.com/en/users/efficientforex Price Interaction Events All events are effective immediately and only after one
The purpose of this new version of the MT4 standard indicator provided in your platform is to display in a sub-window multiple timeframes of the same indicator with its divergences. See the example shown in the picture below. But the display isn't like a simple MTF indicator. This is the real display of the indicator on its timeframe. Here's the options available in the FFx divergences indicator: Select the timeframes to be displayed (M1 to Monthly) Define the width (number of bars) for each tim
The purpose of this new version of the MT4 standard indicator provided in your platform is to display in a sub-window multiple timeframes of the same indicator with its divergences. See the example shown in the picture below. But the display isn't like a simple MTF indicator. This is the real display of the indicator on its timeframe. Here's the options available in the FFx divergences indicator: Select the timeframes to be displayed (M1 to Monthly). Define the width (number of bars) for each ti
The FFx Dashboard MTF alerter will show you on a single chart all the timeframes (M1 to Monthly) with their own status for the indicator. 2 Alert Options: Single timeframe: each selected timeframe alert separately when a signal occurs Multi timeframes: all selected timeframes must agree for an alert to be triggered Both options have an input to select the timeframes to be used for the alert(s). How to Understand the Status: Green/Red square: histogram above/below 0 line Green square + Red bord
The FFx Dashboard MTF alerter will show you on a single chart all the timeframes (M1 to Monthly) with their own status for the indicator. 2 Alert Options: Single timeframe: each selected timeframe alert separately when a signal occurs Multi timeframes: all selected timeframes must agree for an alert to be triggered Both options have an input to select the timeframes to be used for the alert(s). How to understand the status: Green/Red square: RSI above/below 50 line Green square + Red border: R
The FFx Dashboard MTF alerter will show you on a single chart all the timeframes (M1 to Monthly) with their own status for the indicator. 2 Alert Options: Single timeframe: each selected timeframe alert separately when a signal occurs Multi timeframes: all selected timeframes must agree for an alert to be triggered Both options have an input to select the timeframes to be used for the alert(s). How to understand the status: Green/Red square: Stoch above/below 50 line Green square + Red border:
The FFx Dashboard MTF alerter will show you on a single chart all the timeframes (M1 to Monthly) with their own status for the indicator. 2 Alert Options: Single timeframe: each selected timeframe alert separately when a signal occurs Multi timeframes: all selected timeframes must agree for an alert to be triggered Both options have an input to select the timeframes to be used for the alert(s). How to understand the status: Green/Red square: Price above/below Cloud (Kumo) Green square + Red bo
The FFx Dashboard MTF alerter will show you on a single chart all the timeframes (M1 to Monthly) with their own status for the indicator. 2 Alert Options: Single timeframe: each selected timeframe alert separately when a signal occurs Multi timeframes: all selected timeframes must agree for an alert to be triggered Both options have an input to select the timeframes to be used for the alert(s). How to understand the status: Green/Red square: MA pointing Up/Down Green square + Red border: MA po
The FFx Dashboard MTF alerter will show you on a single chart all the timeframes (M1 to Monthly) with their own status for the indicator. 2 Alert Options: Single timeframe: each selected timeframe alert separately when a signal occurs. Multi timeframes: all selected timeframes must agree for an alert to be triggered. Both options have an input to select the timeframes to be used for the alert(s). How to understand the status: Green square: Price above PSAR Red square: Price below PSAR Options
The FFx Dashboard MTF alerter will show you on a single chart all the timeframes (M1 to Monthly) with their own status for the indicator. 2 Alert Options: Single timeframe: each selected timeframe alert separately when a signal occurs Multi timeframes: all selected timeframes must agree for an alert to be triggered Both options have an input to select the timeframes to be used for the alert(s). How to understand the status: Green/Red square: CCI above/below levels (ie. 100/-100) Grey square: C
The FFx Dashboard MTF alerter will show you on a single chart all the timeframes (M1 to Monthly) with their own status for the indicator. 2 Alert Options: Single timeframe: each selected timeframe alert separately when a signal occurs Multi timeframes: all selected timeframes must agree for an alert to be triggered Both options have an input to select the timeframes to be used for the alert(s). How to understand the status: Green/Red square: ADX above level Grey square: ADX below level Red bor
The FFx Dashboard MTF alerter will show you on a single chart all the timeframes (M1 to Monthly) with their own status. 2 Alert Options: Single timeframe: each selected timeframe alert separately when a signal occurs Multi timeframes: all selected timeframes must agree for an alert to be triggered Both options have an input to select the timeframes to be used for the alert(s). How to understand the status: Green/Red square: bullish/bearish candle Options available in the FFx Dashboard Alerter
The indicator of a Professional Trader is an arrow indicator for predicting the direction of price movement. I have been working on this indicator since 2014. You can use this indicator as your main indicator, use its entry signals, and use it as your only indicator to find entry points. About the product: Recommended TF [H4-D1-W1]   . The indicator predicts the direction of the next candle. Fits a variety of tools; Flexibility in settings for different instruments and intervals through the MO
The [GRAFF] III manual trading system is based on multiple MetaTrader (MT4) indicators. Together, the entire PACK of GRAFF III indicators makes an advanced trading tool. The system consists of over 20 different custom-built indicators which have been carefully selected and tested in the long term to produce strong and efficient trading signals. The particular indicators are based on different mathematical formulas, so the entire system is calibrated to remove false signals from its own indicator
This indicator allows you to see the strength of the trend on all timeframes. It can be used for all currency pairs. The indicator can be displayed in the form of a column (from left to right): status buy / sell / strong buy / strong sell, strength of the trend in percentage, pips last candle, body candle now, remaining time, and the timeframe of M1 to MN. Information contained below (from left to right): total trend percent, sell percent, buy percent.
FFx Universal Strength Meter PRO is more than a basic strength meter. Instead of limiting the calculation to price, it can be based on any of the 19 integrated strength modes + 9 timeframes. With the FFx USM, you are able to define any period for any combination of timeframes. For example, you can set the dashboard for the last 10 candles for M15-H1-H4… Full flexibility! Very easy to interpret... It gives a great idea about which currency is weak and which is strong, so you can find the best pai
Plus de l'auteur
MACD divergency
Ivan Stefanov
5 (1)
Cet indicateur identifie avec précision les divergences haussières et baissières entre les mouvements de prix et l’histogramme MACD, en utilisant des moyennes mobiles exponentielles (EMA) de périodes 5 (rapide) et 34 (lente), ainsi qu’une ligne de signal de période 5. Il met en évidence les points où le momentum faiblit, signalant de possibles renversements de tendance. Règles pour une identification correcte des divergences La divergence haussière est valide lorsque le prix forme des creux plus
FREE
Meravith
Ivan Stefanov
5 (1)
L'indicateur analyse le volume à partir de chaque point et calcule les niveaux d'épuisement du marché pour ce volume. Il se compose de trois lignes : Ligne d'épuisement du volume haussier Ligne d'épuisement du volume baissier Une ligne indiquant la tendance du marché. Cette ligne change de couleur pour refléter si le marché est haussier ou baissier. Vous pouvez analyser le marché à partir de n'importe quel point de départ que vous choisissez. Une fois qu'une ligne d'épuisement du volume est atte
Imbalance Pro
Ivan Stefanov
5 (4)
L'indicateur mesure le déséquilibre entre les haussiers et les baissiers sur une période donnée et affiche une ligne droite entre les deux points. Si les haussiers ont plus de volume que les baissiers, la ligne devient verte.  Si les baissiers ont plus de volume, elle est rouge. La ligne indique également le pourcentage de différence de volume. L'indicateur affiche les mêmes données dans une fenêtre séparée. Vous pouvez également voir le volume divisé. L'indicateur a deux modes. À cet effe
Levelss
Ivan Stefanov
5 (1)
L'indicateur LEVELSS montre : - Les zones haussières et baissières quotidiennes. Elle est visible tous les jours de 00h00 à 23h59.  - La zone haussière et baissière hebdomadaire. Elle est visible du lundi 0:00 au vendredi 23:59 chaque semaine. - Canal spécialement calculé à partir d'un timeframe spécifique qui est affiché sur tous les autres timeframes. Par défaut, il s'agit de l'échelle de temps de 4 heures que vous pouvez changer pour l'échelle de temps de votre choix. Il est calculé en cont
Naturu
Ivan Stefanov
5 (1)
« “Naturu” est un indicateur manuel qui utilise la symétrie de la nature comme algorithme. Dominez le marché grâce à une stratégie simple et à une sagesse cachée ! Lorsque vous chargez l’indicateur, deux lignes apparaissent — Haut (Top) et Bas (Bottom). Cliquez une fois sur une ligne pour l’activer. Pour la déplacer, cliquez simplement sur la bougie où vous souhaitez la placer. Vous définissez un point haut et un point bas, et l’indicateur calcule automatiquement : une zone magenta montrant l’en
L’indicateur analyse le volume à partir de n’importe quel point et calcule les niveaux d’épuisement du marché pour ce volume. Lignes principales de Meravith : Ligne d’épuisement du volume haussier – sert d’objectif. Ligne d’épuisement du volume baissier – sert d’objectif. Ligne de tendance – indique la tendance du marché. Sa couleur change selon que le marché est haussier ou baissier et elle sert de support de tendance. Comment l’utiliser : double-cliquez sur la ligne verticale violette et dépla
Les niveaux légendaires de William Gann dans un indicateur MT5 entièrement automatisé. GANN Master identifie les zones clés où le prix est le plus susceptible de se retourner ou de poursuivre sa tendance, en se basant sur des données Daily, Weekly et Monthly. Fonctionnalités clés : Boutons de période en un clic : cliquez sur Daily, Weekly ou Monthly pour tracer instantanément les zones du jour, de la semaine ou du mois Modes automatique et manuel • Automatique : GANN Master calcule tous les nive
Sense
Ivan Stefanov
5 (2)
SENSE est un système automatisé qui combine des méthodes GANN sélectionnées avec des calculs fractals. Le système nous indique où ouvrir et fermer les transactions. Plus besoin de perdre du temps avec des calculs complexes - SENSE fait tout pour vous. Il suffit d'installer l'indicateur. Principes de base : Le marché est haussier lorsque le prix se situe au-dessus des lignes blanches. Acheter au-dessus des lignes blanches, s'arrêter en dessous Les lignes vertes sont des objectifs de hausse L
Balance Levels is an easy-to-use trading indicator that provides clear buy and sell signals along with dynamic price levels, helping traders plan their entries and exits with more confidence. The tool is highly flexible – it can be used as a standalone strategy or integrated into any existing trading system. It works on all timeframes and across all markets: Forex, Gold, Indices, Crypto, or Stocks. Balance Levels suits every trading style – from scalping and intraday, to swing trading and even l
Separated Volume
Ivan Stefanov
5 (1)
Cet indicateur sépare efficacement le volume de tic-tac sur le marché des changes en catégories haussières et baissières. En outre, il permet de calculer et d'afficher la somme des volumes haussiers et baissiers pour la période de votre choix. Vous pouvez facilement ajuster la période en déplaçant les deux lignes bleues sur le graphique, ce qui permet de personnaliser et de préciser l'analyse des volumes en fonction de vos besoins de trading. Si vous le trouvez utile, vos commentaires seront
FREE
Balance Levels est un indicateur de trading facile à utiliser qui fournit des signaux clairs d’achat et de vente ainsi que des niveaux de prix dynamiques, aidant les traders à planifier leurs entrées et sorties avec plus de confiance. L’outil est très flexible – il peut être utilisé comme stratégie autonome ou intégré dans n’importe quel système de trading existant. Il fonctionne sur toutes les unités de temps et sur tous les marchés : Forex, Or, Indices, Cryptomonnaies ou Actions. Balance Level
Cet indicateur est basé sur l'expérience pratique.  Insérez la date/heure de votre top/bottom. Il calcule le niveau le plus visité depuis le haut/bas jusqu'au moment présent. Il se met à jour automatiquement à chaque nouvelle bougie. Vous pouvez utiliser simultanément plusieurs indicateurs pour différentes tendances et différents délais. La longueur est toujours tracée depuis le début de la période jusqu'à aujourd'hui. Un outil PRO utile.
FREE
Two Snakes
Ivan Stefanov
5 (1)
2 SNAKES est un système de scalping de première classe. Comme les entrées sont très précises, il est probable que vous deviendrez rapidement accro à ce système.  Vous avez 2 serpents. Lorsque vous voyez une bougie au-dessus ou au-dessous d'eux qui ne les touche pas - c'est votre signal de scalping. Si vous utilisez un cadre temporel plus large, le scalping peut devenir un suivi de tendance. Les serpents sont calculés précisément en fonction de l'état actuel du marché. Ils NE SONT PAS des
GANN Master
Ivan Stefanov
5 (1)
Les objectifs précis de GANN sont calculés selon ses méthodes éprouvées et présentés devant vous. Cet outil est conçu pour rendre le trading plus fluide et intuitif. En déplaçant la ligne blanche vers le haut ou la ligne verte vers le bas, vous comprendrez immédiatement pourquoi les techniques de GANN restent influentes dans le monde du trading. Les stratégies de GANN se concentrent sur la prévision des mouvements de marché avec une grande précision, et cet outil met ce pouvoir à votre portée. Q
Stefanov
Ivan Stefanov
The indicator displays support and resistance zones defined logically using the MACD. The entire concept is explained in the video, with specific examples shown. The indicator works on any instruments and timeframes. It does not repaint. After placing it on the chart, please go through all the timeframes sequentially, from monthly to 1-minute, so that all lines load correctly. After that, you can start using it. The concept is unique and has not been seen in other systems or indicators.
Fifty Pro
Ivan Stefanov
5 (1)
L'indicateur FIFTY est désormais disponible en version automatisée, éliminant le besoin de tracer manuellement les niveaux. Cette version affiche automatiquement les niveaux quotidiens, hebdomadaires, mensuels et annuels sur le graphique, garantissant une grande précision et un gain de temps. De plus, des boutons permettent d’activer ou de désactiver la visibilité de ces niveaux, offrant une personnalisation complète. Pour ceux qui le souhaitent, la version gratuite de l’indicateur reste disponi
« “Naturu” est un indicateur manuel qui utilise la symétrie de la nature comme algorithme. Dominez le marché grâce à une stratégie simple et à une sagesse cachée ! Lorsque vous chargez l’indicateur, deux lignes apparaissent — Haut (Top) et Bas (Bottom). Cliquez une fois sur une ligne pour l’activer. Pour la déplacer, cliquez simplement sur la bougie où vous souhaitez la placer. Vous définissez un point haut et un point bas, et l’indicateur calcule automatiquement : une zone magenta montrant l’en
Enigmera MT5
Ivan Stefanov
3.67 (3)
ENIGMERA : Le noyau du marché (Ceci est un indicateur manuel et contient des fonctions qui peuvent ne pas être prises en charge par l’environnement de test actuel de MetaTrader) Introduction Cet indicateur et ce système de trading représentent une approche unique des marchés financiers. ENIGMERA utilise des cycles fractals pour calculer avec précision les niveaux de support et de résistance. Il montre la véritable phase d’accumulation et fournit la direction ainsi que les objectifs. C’est un sys
L’indicateur met en évidence les zones où un intérêt est déclaré sur le marché , puis montre la zone d’accumulation des ordres . Il fonctionne comme un carnet d’ordres à grande échelle . C’est l’indicateur destiné aux grands capitaux . Ses performances sont exceptionnelles. Quel que soit l’intérêt présent sur le marché, vous le verrez clairement . (Il s’agit d’une version entièrement réécrite et automatisée – l’analyse manuelle n’est plus nécessaire.) La vitesse de transaction est un indicateur
L’un des rares indicateurs qui calcule les niveaux uniquement en fonction du prix. Il n’est pas affecté par les unités de temps, les tendances ou les cycles de marché. L’un des indicateurs les plus logiques jamais créés. L’indicateur FIFTY est désormais disponible en version automatisée, supprimant le besoin de tracer manuellement les niveaux. Cette version affiche automatiquement les niveaux journaliers, hebdomadaires, mensuels et annuels sur le graphique, garantissant précision et gain de temp
SPEKULATOR est un système de trading manuel et un indicateur qui vous aide à identifier les zones clés de support et la direction du marché. Maîtrisez le marché avec une stratégie simple et une sagesse cachée. Vous choisissez n'importe quel sommet (TOP) et bas (BOTTOM) sur le graphique, et l'indicateur trace : Une zone de support pour votre tendance. Pour une tendance haussière, une zone verte apparaît ; pour une tendance baissière, une zone rouge. La sensibilité de la zone de support peut être
Time Zones Fifty L’indicateur résout un problème fondamental : Comment devons-nous compter le temps ? Quelles zones utiliser, comment et pourquoi ? Il est entièrement basé sur la logique. Application des zones de temps Pour appliquer des zones de temps, il faut un point de départ. Ce point doit être défini logiquement, et non choisi au hasard. Certains choisissent par exemple : le premier jour de l’année, le premier jour du mois, le début d’un trimestre ou d’une semaine. Mais cela suppose que l’
L’indicateur Volume Equilibrium montre les niveaux où le volume acheteur est égal au volume vendeur. Il peut calculer ces niveaux pour chaque jour, semaine, mois et année. Lorsque le prix est au-dessus de la ligne, cela signifie que le volume est du côté des acheteurs et que le marché est haussier. Lorsque le prix est en dessous de la ligne, cela signifie que le volume est du côté des vendeurs et que le marché est baissier. L’indicateur utilise l’algorithme de l’indicateur « Meravith » pour calc
Filtrer:
onermentes
19
onermentes 2025.06.17 18:57 
 

Yaklaşık olarak 10 yıldır forex piyasasında işlem yapmaktayım. Pek çok indikatör taradım ve aldım. Neredeyse bir çoğu çöptü diyebilirim. Enigmera indikatörden ziyade bir starteji yapmamı sağlamakta. Girmiş olduğum pozisyonlarda korkumu yenmeme katkı sağladı. Daha önce erken kapatmak zorunda olduğum pozisyonlarda bearish veya bullish hedefler neredeyse tam anlamıyla doğru çalışmakta ve buna bağlı olarak pozisyonlarımı daha uzun tutabilme güvenini sağladı. Özellikle support line çok ciddi olarak destek veya direnç olarak çalışmakta. Para yapmanıza kesinlikle katkı sağlayacaktır. Ivan teşekkür ederim.

TANJU2690
529
TANJU2690 2025.03.05 13:37 
 

I have never and ever seen any system like Enıgmera. What ever you want, you can find on it. İt is incredible system. And Cretor of aenıgmera, Mr.Ivan is more and more helpfull to understant of logıc Enigmera. Fistly, I want sent all thankfull to Ivan because he teach me Enıgmera Logıc and also share this marvelous product with market

smso9466eiou
152
smso9466eiou 2025.02.23 15:38 
 

a very good indicator that composes all in one, entry, exit and reverse. Great!

Ivan Stefanov
4453
Réponse du développeur Ivan Stefanov 2025.02.23 18:12
Thank you! Wishing you profits!
Rutt Tungkiratichai
2685
Rutt Tungkiratichai 2025.02.01 00:11 
 

This is very good and accurate indicator.

Ivan Stefanov
4453
Réponse du développeur Ivan Stefanov 2025.02.01 11:30
Thank you for the good words! Brgds / Ivan
Osazeme Usen
521
Osazeme Usen 2024.12.31 12:38 
 

This is probably the best indicator I have seen in marketplace. Fantastic analysis with phenomenal success rates.

Update: Not great for direction, but fantastic for TP and SL.

Ivan Stefanov
4453
Réponse du développeur Ivan Stefanov 2025.01.02 16:45
Osazeme Usen 2024.12.31 12:38 # EN
This is probably the best indicator I have seen in marketplace. Fantastic analysis with phenomenal success rates. Thank you for the good words! Brgds/Ivan
vincenzo1964
1079
vincenzo1964 2024.07.11 15:59 
 

Assolutamente straordinario a cominciare da chi l'ha ideato Ivan, Sono assolutamete felice dell'affito/prova fatto, Enigmera è sorprendente, ti accompagna sempre sul lato giusto della tendenza sino alla fine del percorso. Se poi parliamo del dott. Ivan e della sua disponbilità, se potessi postare gli screenshot e la guida passo passo che mi ha concesso, è commovente e sorprendente. Se volete fare buon trading con giudizio e responsabilità potete tranquillamente perdere qualche giorno del vostro tempo a capire la logica ed il ragionamento che c'è dietro enigmera, solo così sarete sempre dal lato giusto del trend sino alla fine, sopratutto quando ci sono le news ed enigmera già vi sta indicando i livelli di tp da raggiungere. Proprio oggi ero già lon su eurusd e sell su usdchf ed entrambe dopo le notizie chiuse in tp. Consiglio anche l'indicatore Speed, leggetene l'utilizzo, la forza e ciò che vi può indicare, io ci sto lavorando sodo seguito da ivan perchè l'unione di enigmera e speed è devastante, alla fine dell'affitto acquisterò engmera mentre affitterò mensilmente speed (il costo è di 30.00€ mentre l'acquisto è di 3000€), ma il suo potenziale per il trend followhing e immenso, saluti e buon trading a tutti, grazie Ivan...

Irfan
1392
Irfan 2024.06.21 13:44 
 

L'utilisateur n'a laissé aucun commentaire sur la note

Ivan Stefanov
4453
Réponse du développeur Ivan Stefanov 2025.01.02 16:46
Irfan 2024.06.21 13:44 # EN
Enigmera gives you an entirely different way of looking at the market. It does not look into the past, what has happened in the past stays in the past it gives you a picture of what is going on in the market right now and gives you logical understanding for trading. The author is so confident about his product the he gave me a full version of the indicator so that I could try it for a week before I decided to buy it. Ivan spent a lot of time chatting with me, educating me how to use the indicator. He is very quick and replies to your questions. I have already seen good results with this indicator and it has increased my confidence. Thank you for the good words, Irfan!
Sajid Iqubal
183
Sajid Iqubal 2024.06.08 21:59 
 

Enigmera is an exceptional trading indicator that has greatly improved my trading performance. Ivan Stefano offers the best support and guidance, always going above and beyond like an elder brother to me. His guidance and the effectiveness of Enigmera make a winning combination. I highly recommend using Enigmera.

eman11
1295
eman11 2023.11.22 20:29 
 

L'utilisateur n'a laissé aucun commentaire sur la note

Ivan Stefanov
4453
Réponse du développeur Ivan Stefanov 2025.01.02 16:47
eman11 2023.11.22 20:29 # EN
I was an institutional trader for a decade and rarely write reviews or spend more then 50 or a 100 on any indicator as my trading is well established, but always open to something interesting and new. The author is an intelligent and real trader , per many chats with him, and this indicator compliments well existing trading as is from a unique perpective. The price is not cheap , but it it is a legit and unique system, is as decribed, which can be put to good use particulalry with experienced traders who may best integrate multiple styles and ideas successfully. Great work Ivan. Thank you for the good words, Eman11 / Brgds / Ivan
ebel
1221
ebel 2023.11.22 14:41 
 

This indicator is undoubtedly expensive but I believe it to be the Ferrari of indicators and the only one you will ever need. The video in the overview is self explanatory, take the time to find the setups as described and the R:R can be extremely good. I have only been using the indicator for a week but have found several very profitable trades and feel confident that I can make back more than sufficient each month to cover my 6 monthly rental. The author is extremely responsive and helpful and is starting a telegram group so that we can share prospective setups. I believe the indicator is difficult to get to work in Strategy Tester but the author is open to free trials which demonstrates his trust in the product. I can't post images here but I will post a trade I made this morning in the comments. I can't promise it is the perfect setup as I am still learning but just this one trade covered my monthly rental cost. IMPORTANT - do not try to change to a lower timeframe while the indicator is loaded. The code is incredibly complex and trying to recalculate everything on a lower tf over a significant period will freeze your MT4 installation. You will need to delete the indicator from your MT4, force a shut down, restart and re-install. Once you understand the complexity it is not a problem, just open another chart on a lower tf or delete the indicator, change the tf and put it back on.

UPDATE 23/11

I have just seen that the author has been debarred from selling! I have just paid for 6 months rental and this is a good indicator that is making me money. What to I do after 6 months if I can't renew? And why has this happened, the author is very courteous and helpful.

Répondre à l'avis