Enigmera

5

ENIGMERA: 시장의 핵심

중요: MQL5.com의 데모는 Strategy Tester에서 실행되며 Enigmera의 기능을 완전히 반영하지 못할 수 있습니다. 설명, 스크린샷 및 비디오를 확인하여 자세한 내용을 확인하십시오. 질문이 있으면 언제든지 메시지를 보내주세요!

인디케이터의 코드는 완전히 다시 작성되었습니다. 버전 3.0은 새로운 기능을 추가하고 인디케이터가 처음 출시된 이후 누적된 버그를 수정했습니다.
소개
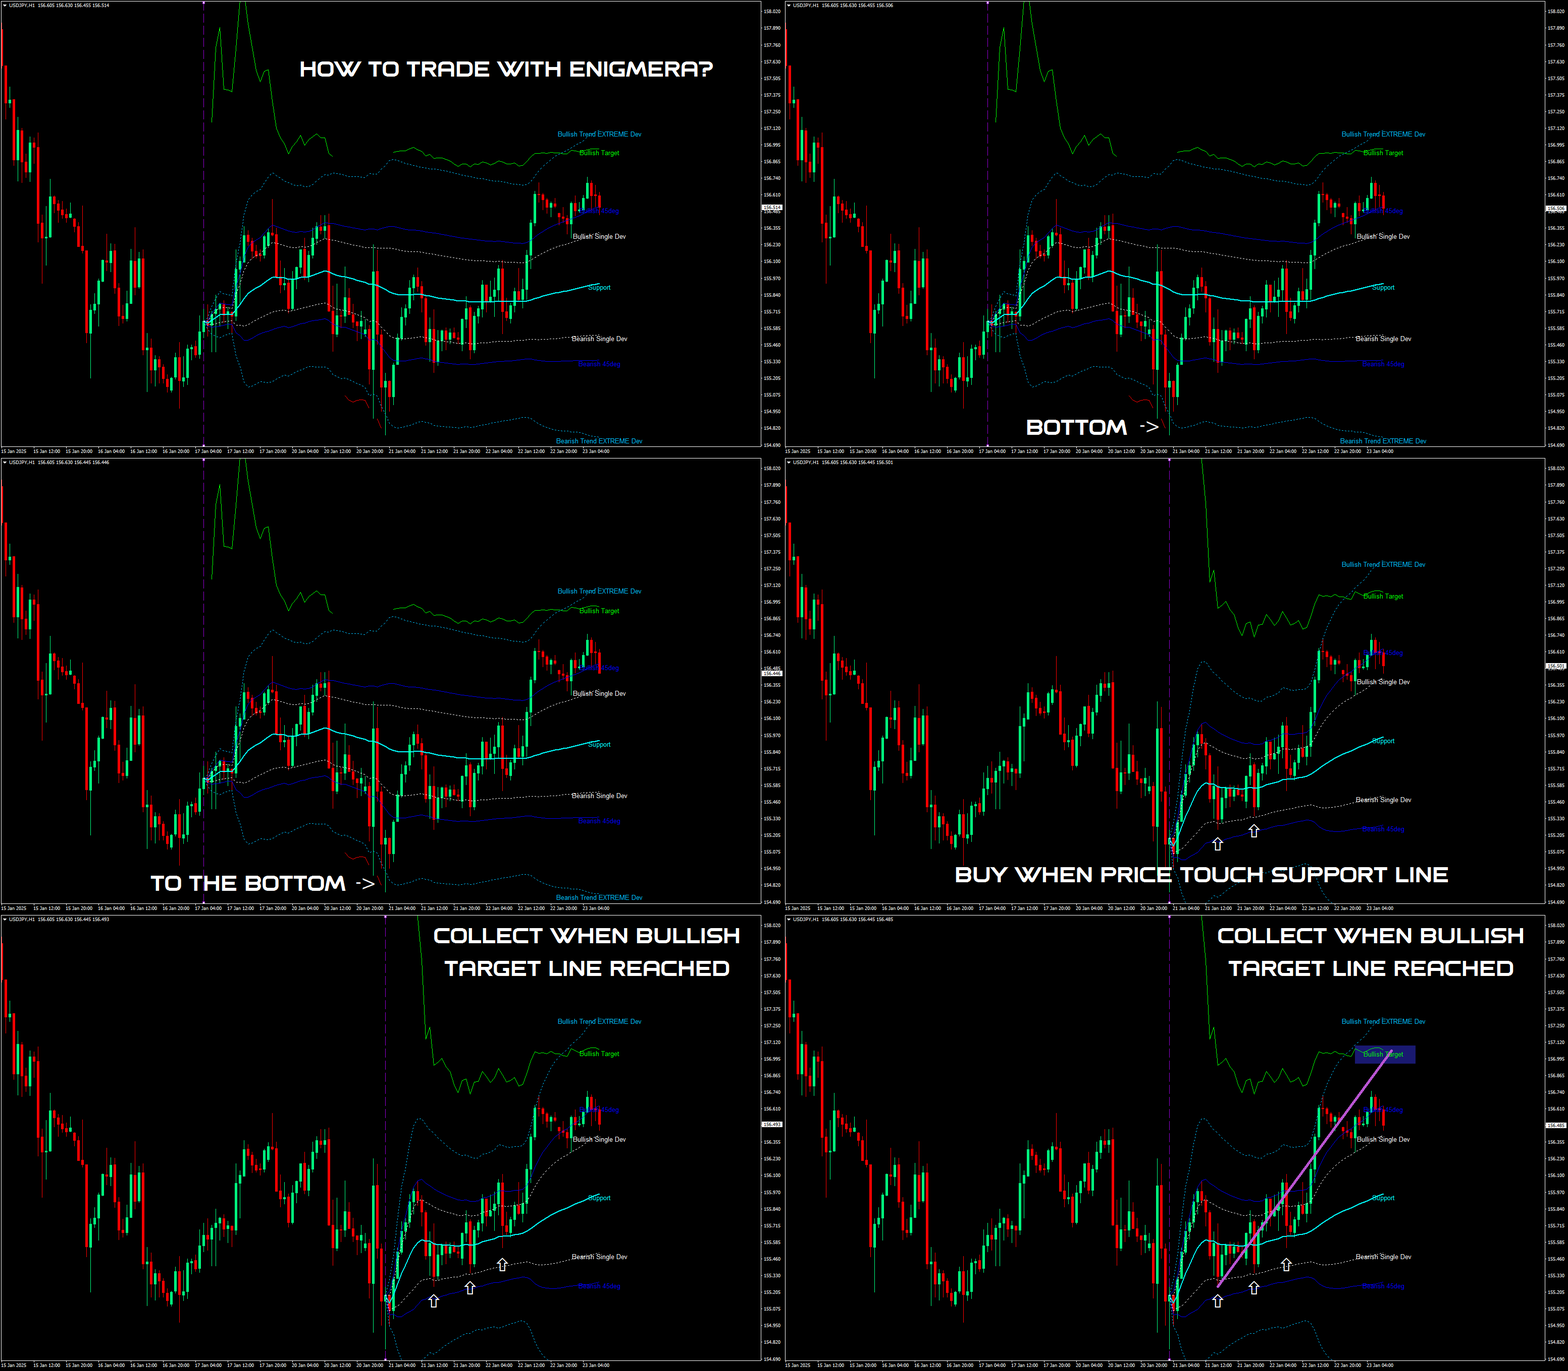
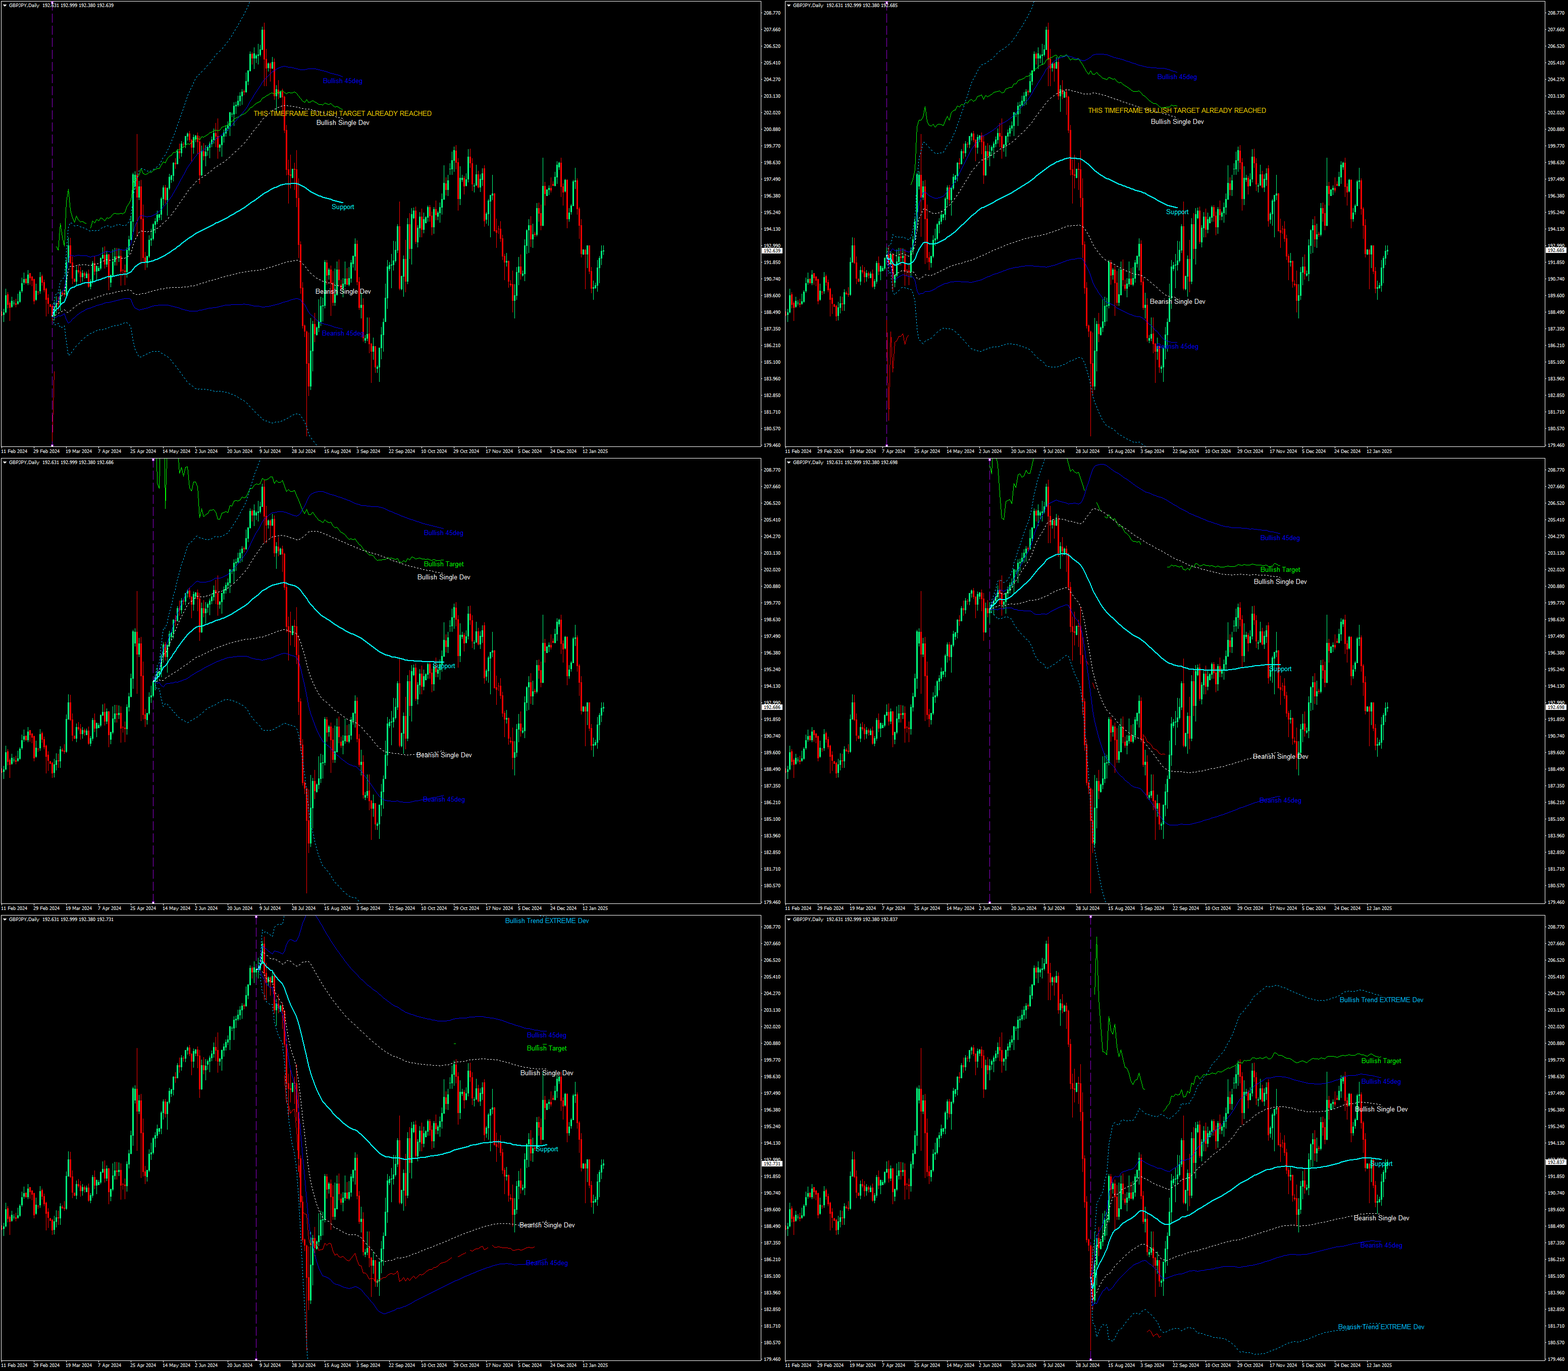
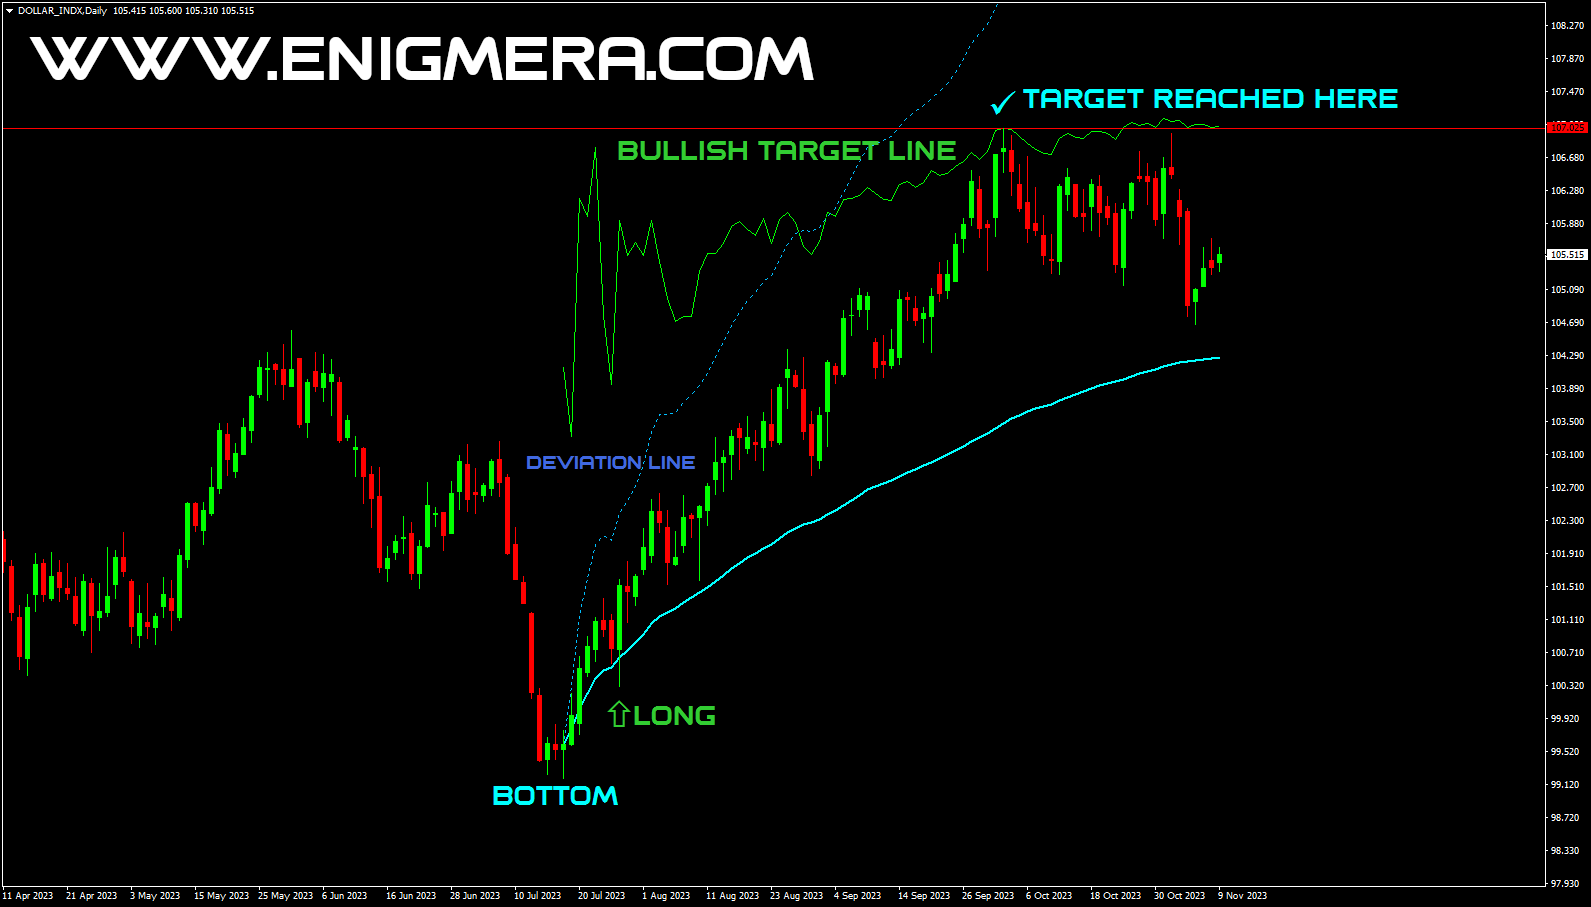
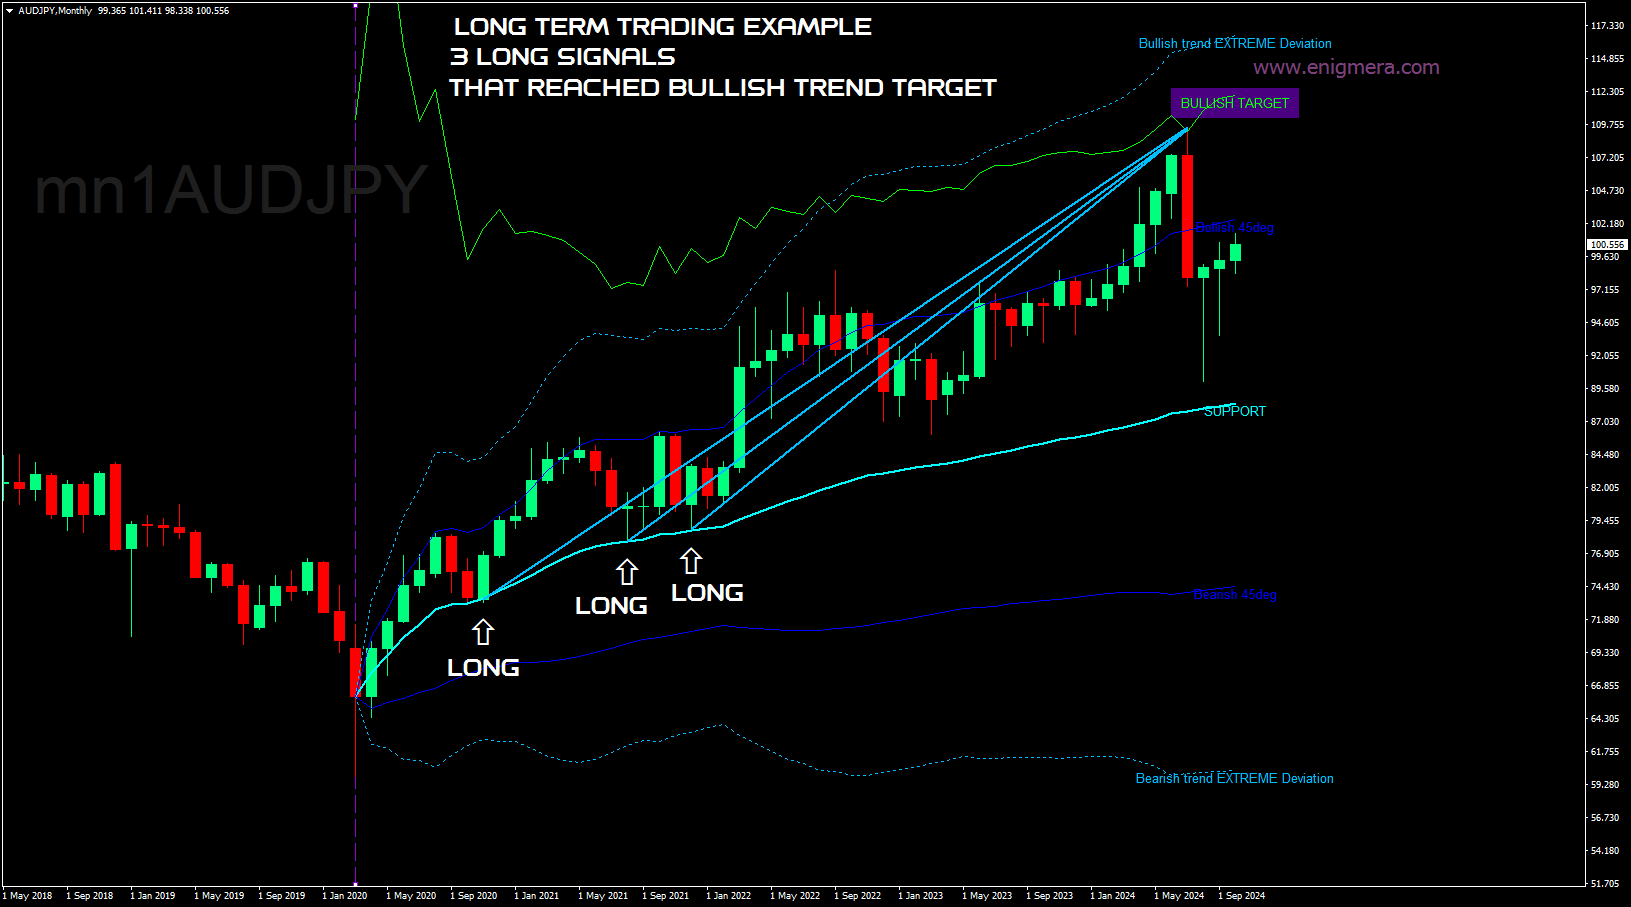
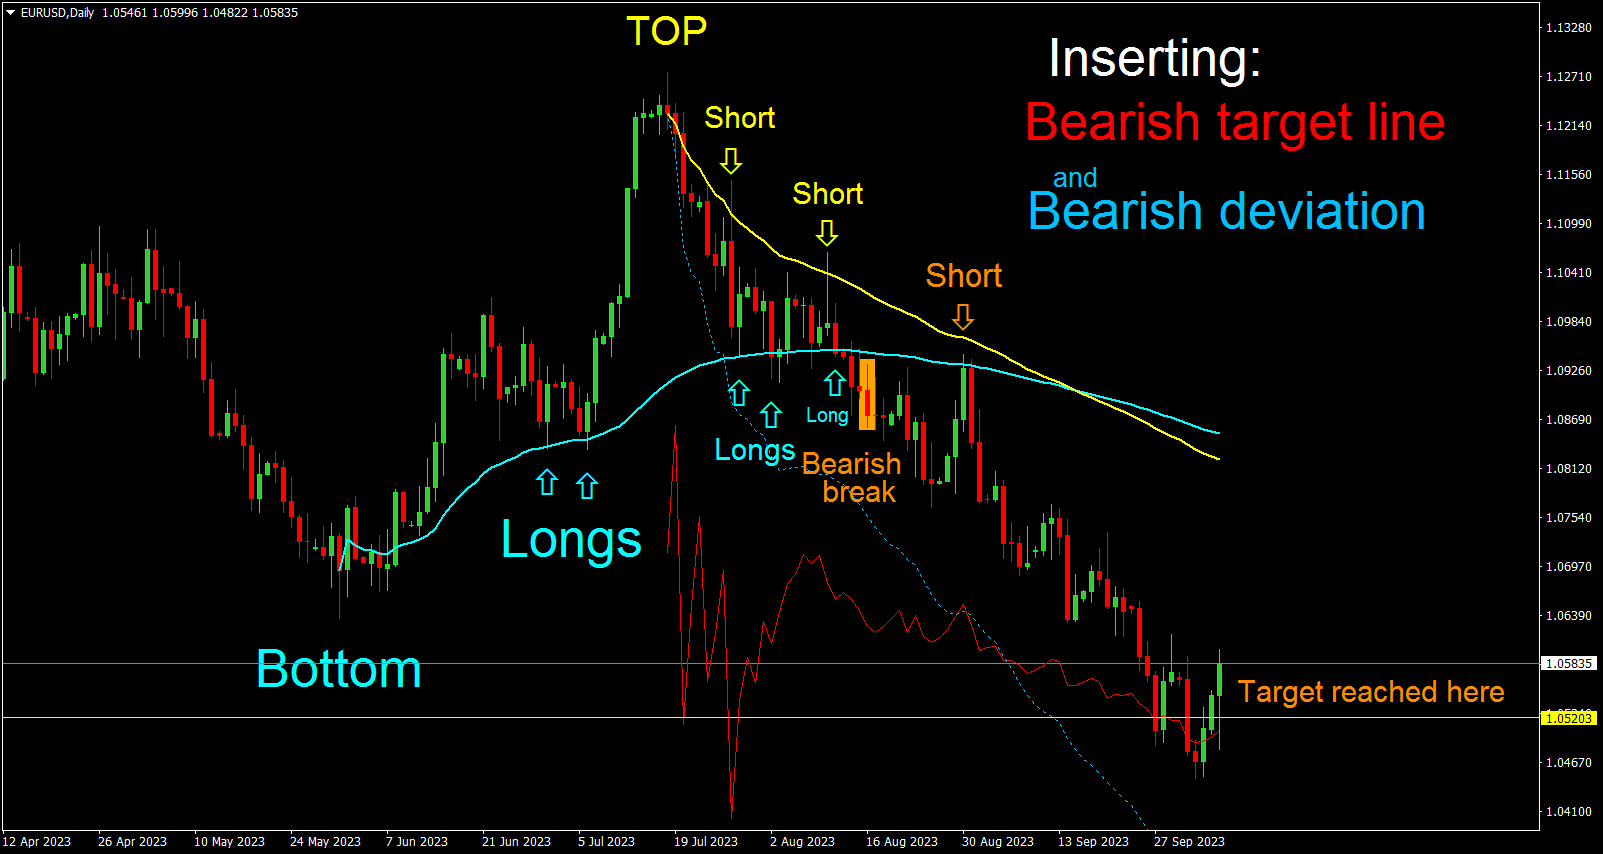
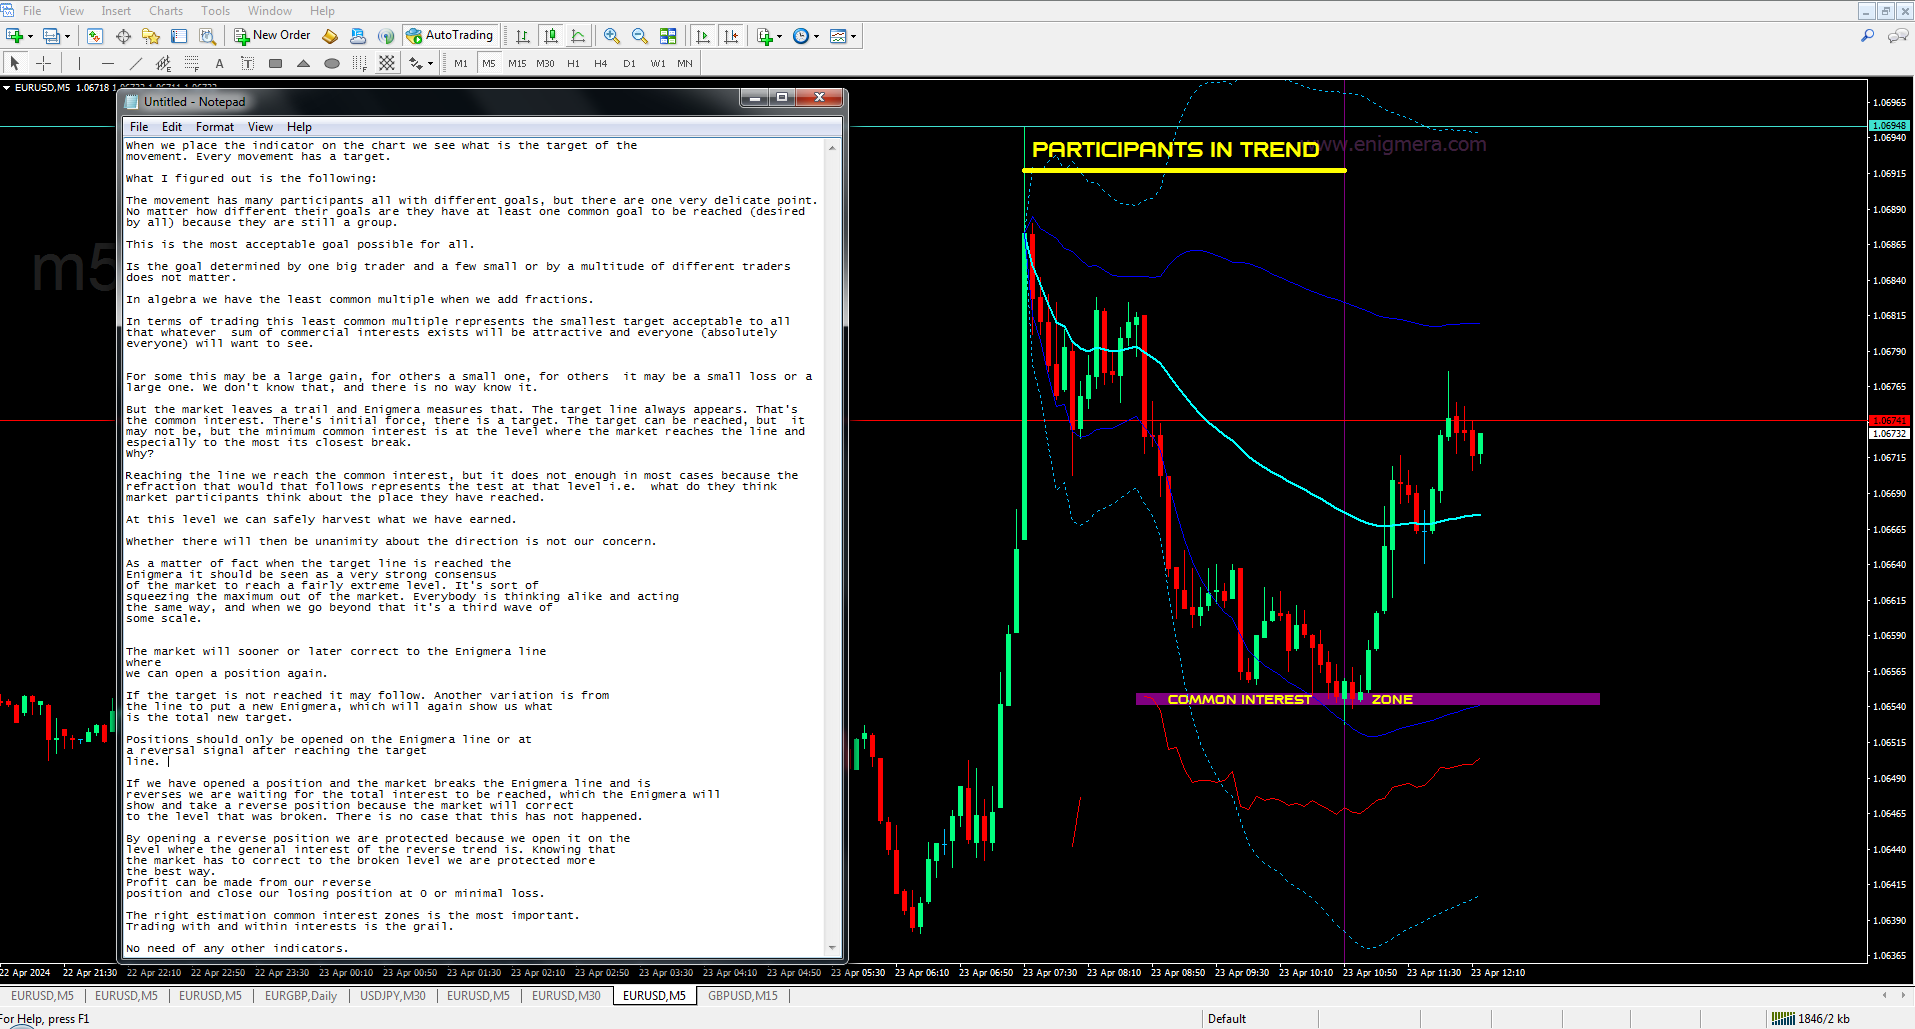
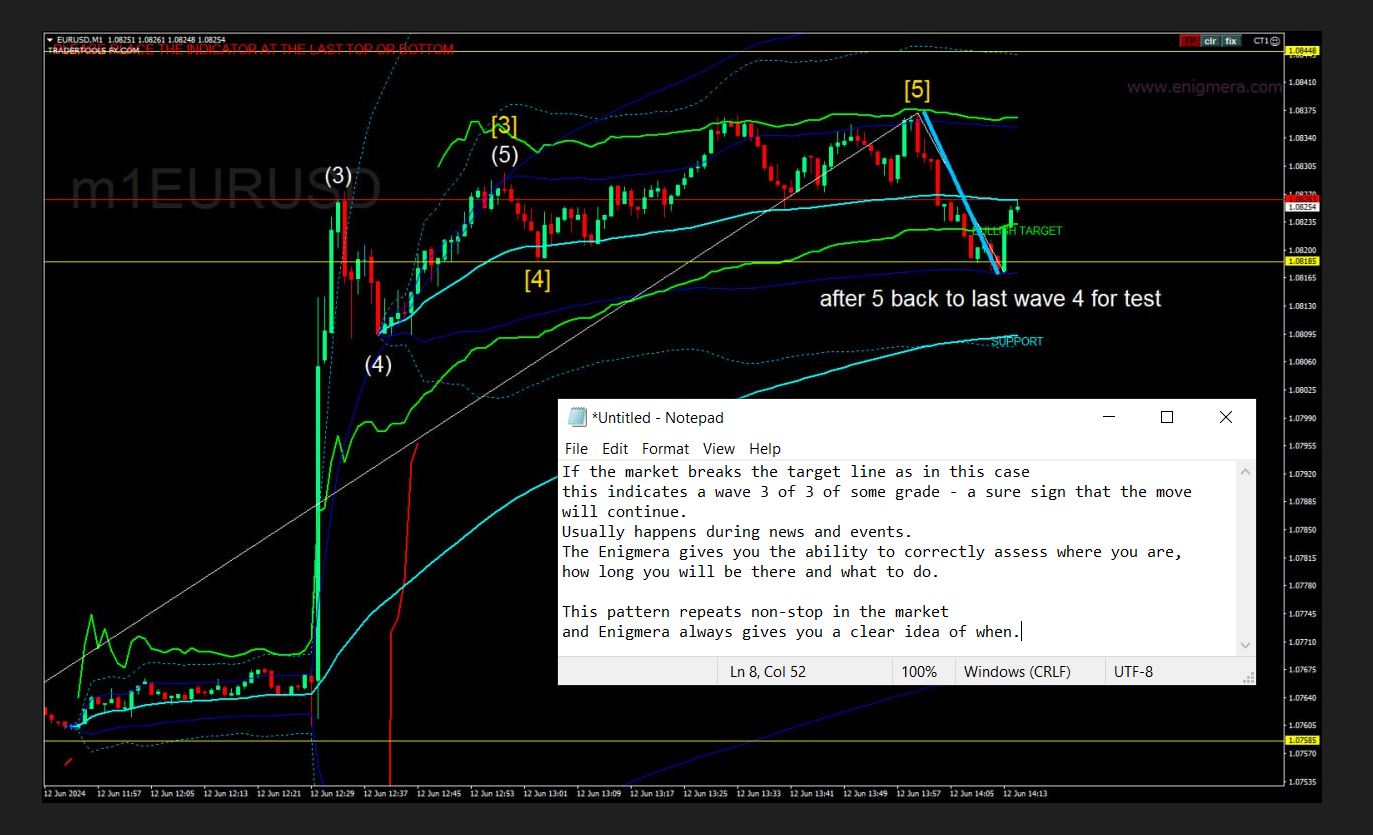
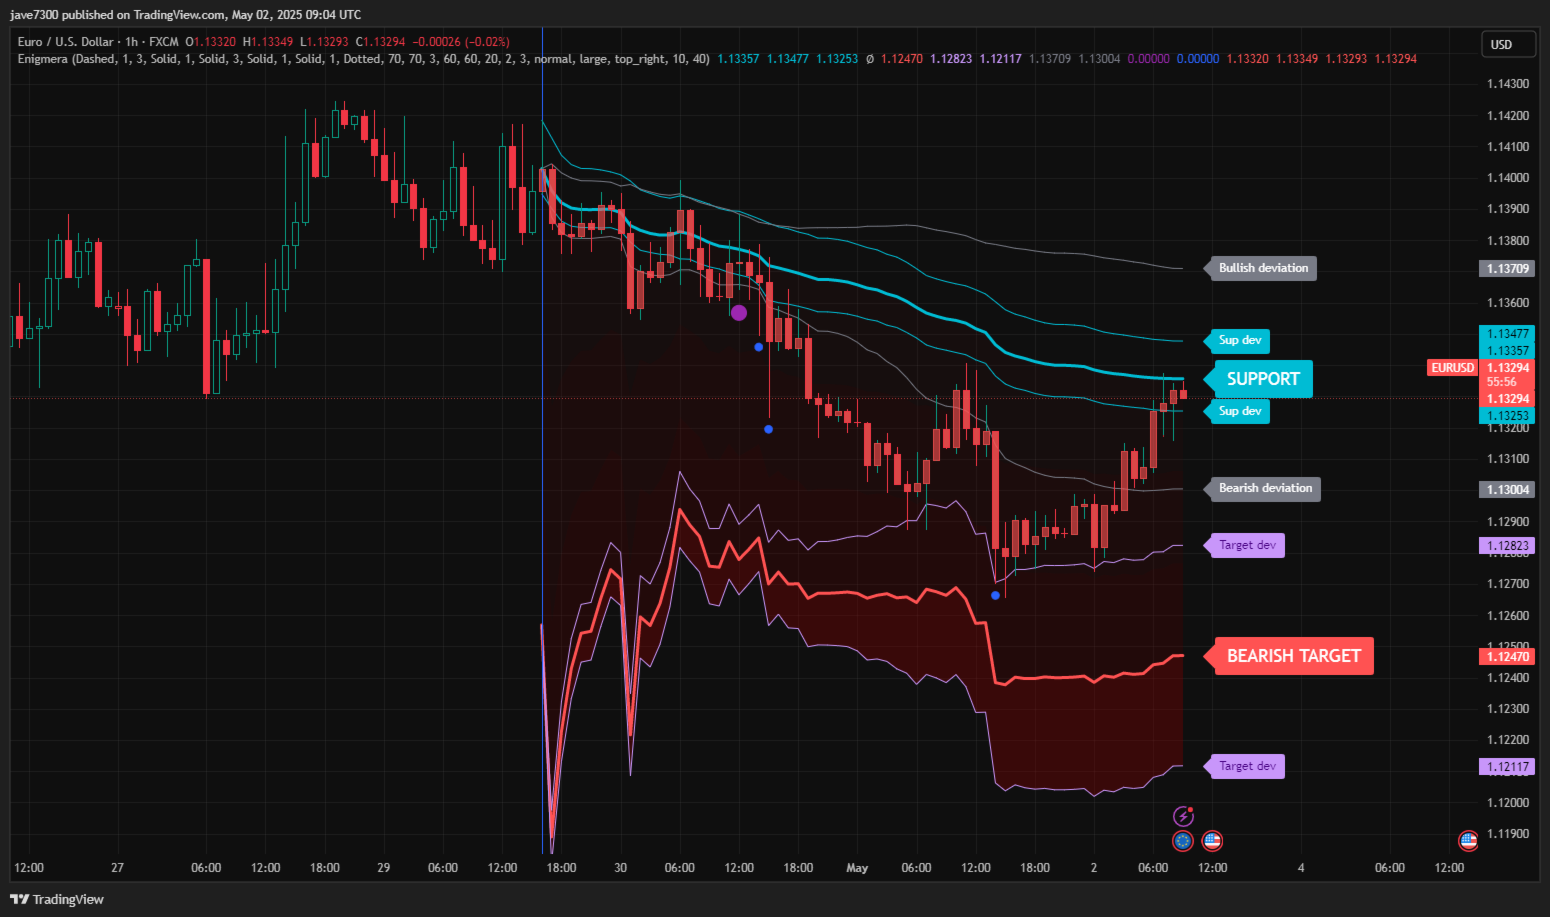
이 인디케이터 및 거래 시스템은 금융 시장에 대한 주목할 만한 접근 방식입니다. ENIGMERA는 프랙탈 주기를 사용하여 정확하게 지원 및 저항 수준을 계산합니다. 실제 축적 단계를 보여주고 방향과 목표를 제공합니다. 트렌드와 수정 모두에서 작동하는 시스템입니다.

작동 방식
인디케이터의 대부분의 기능은 차트 왼쪽에 있는 버튼을 통해 제어되며, 이를 통해 다양한 시장 상황에 빠르게 대응할 수 있습니다.

버튼

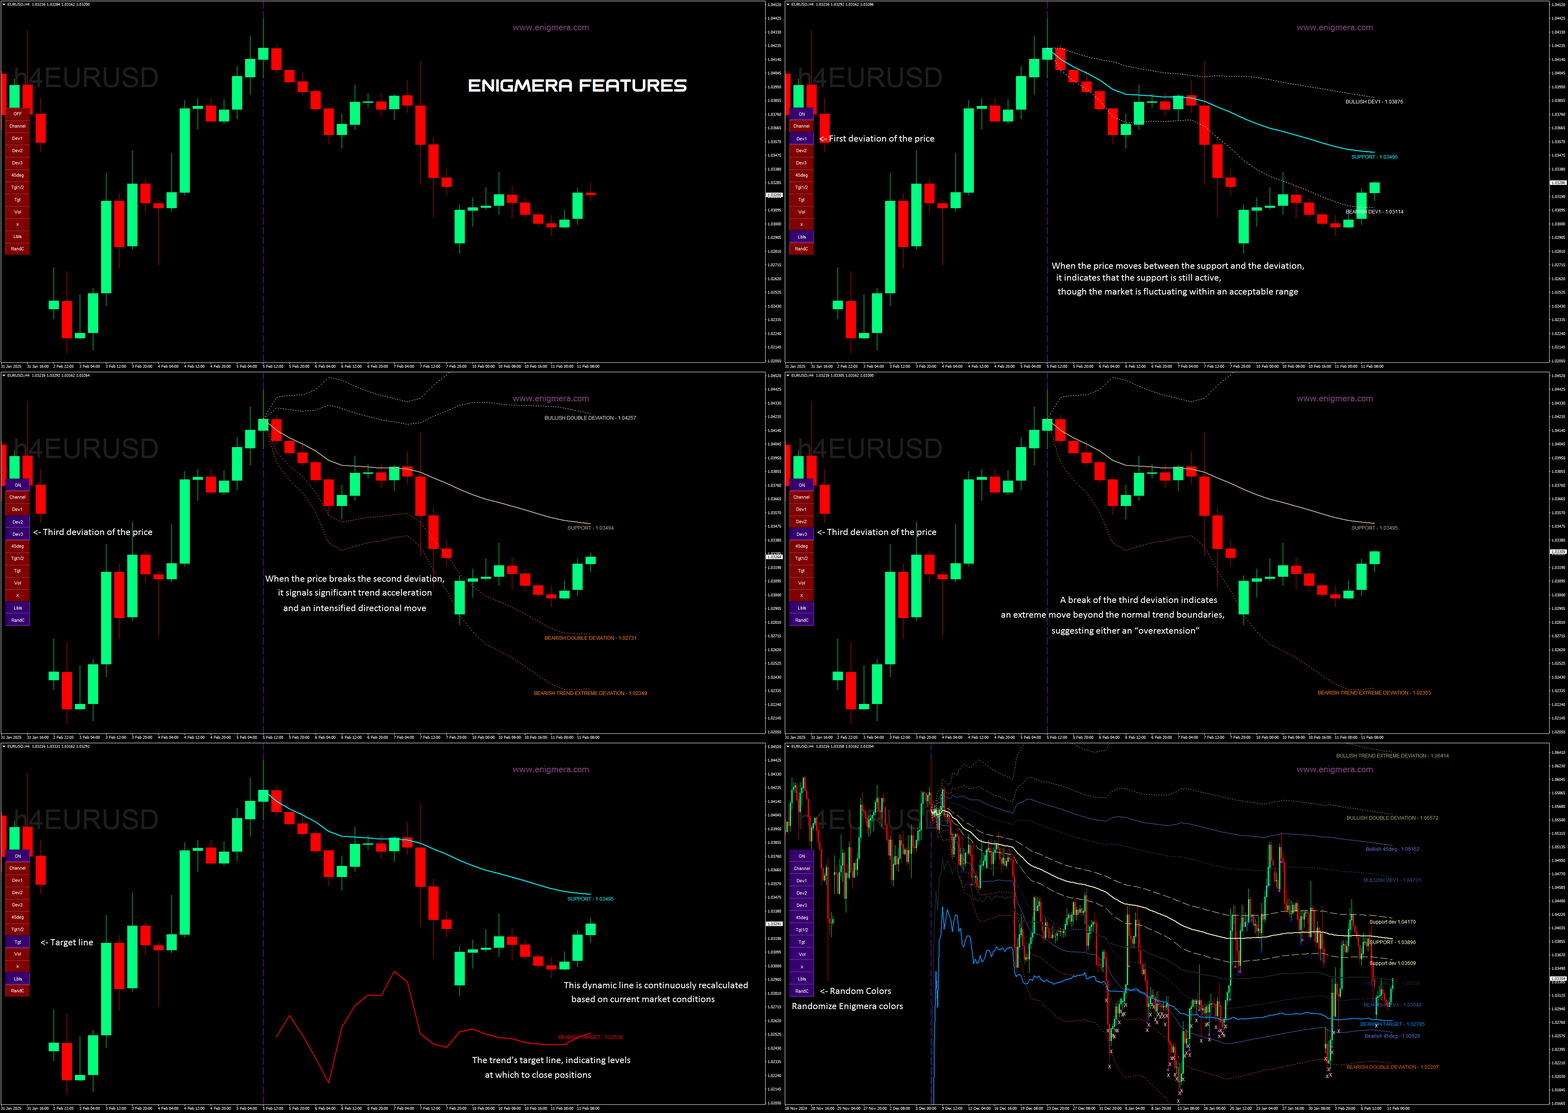
  1. ON/OFF – 인디케이터 전체를 표시하거나 숨깁니다.
  2. Channel – 지원 채널을 활성화하고 허용 가능한 편차 범위를 표시합니다.
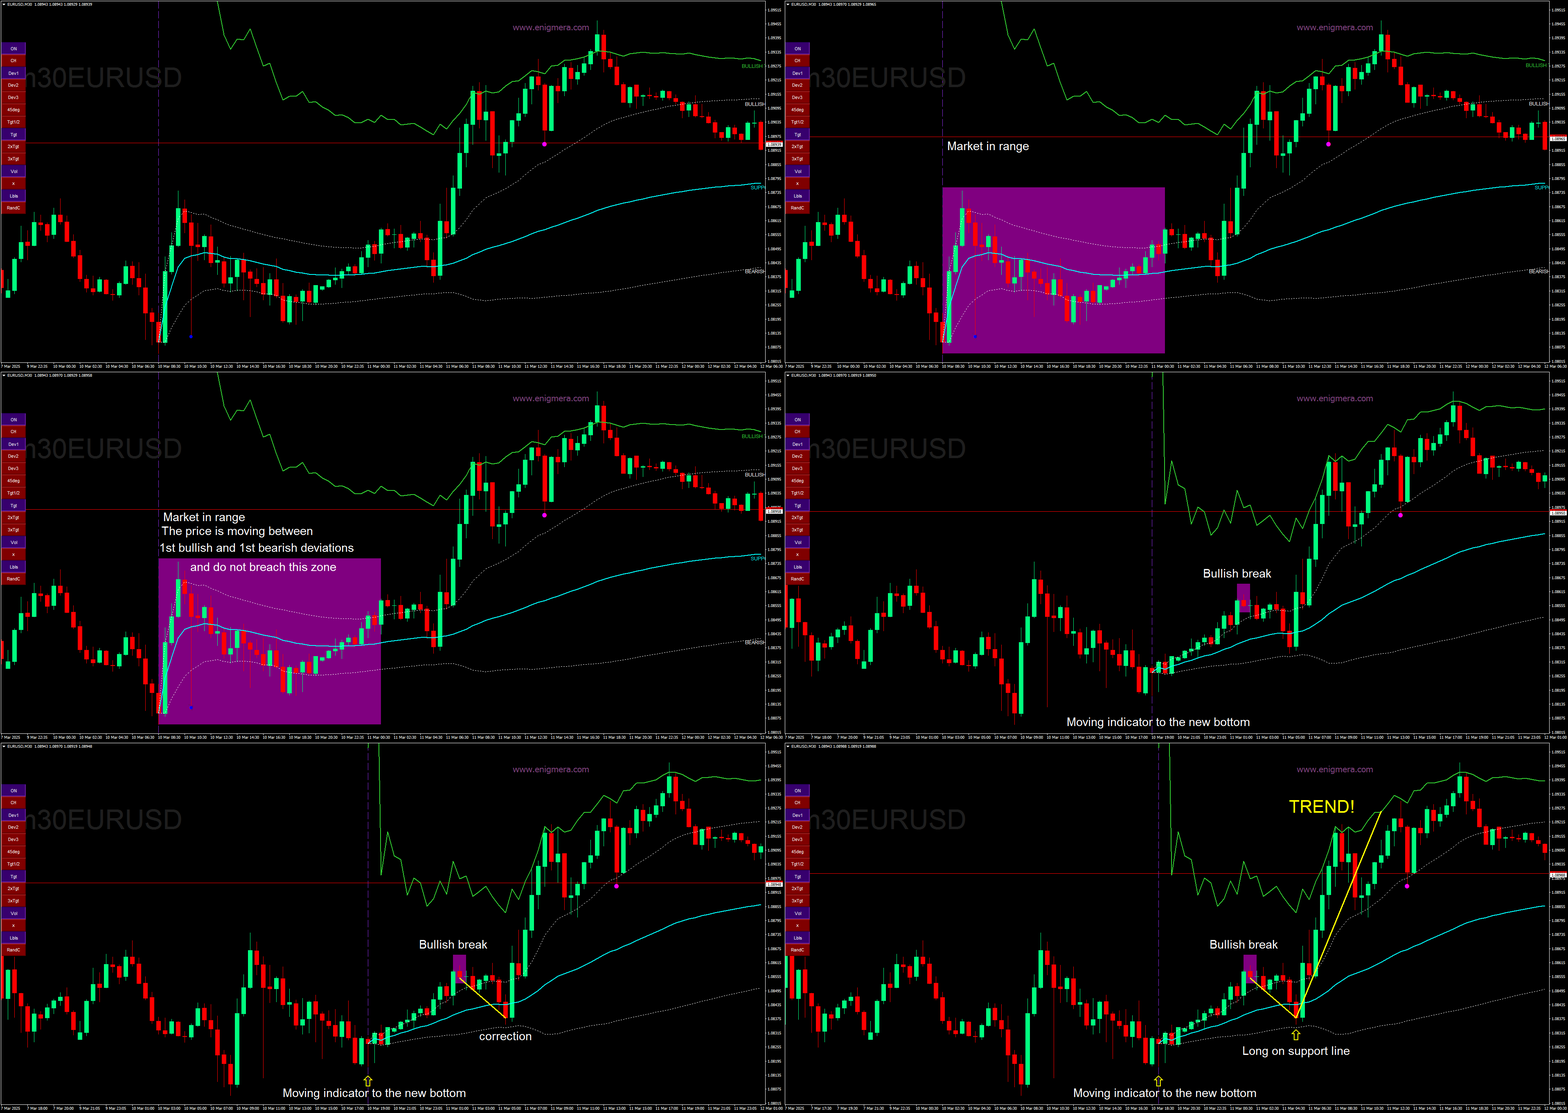
  3. Dev1 (첫 번째 편차) – 지원 편차 내에서 가격 움직임을 나타내며 시장의 통합 또는 강도 축적을 나타냅니다.
  4. Dev2 (두 번째 편차) – 편차 간의 가격 움직임을 나타내며 트렌드 형성 및 방향을 나타냅니다.
  5. Dev3 (세 번째 편차) – 트렌드의 중요한 가속화와 높은 변동성을 나타냅니다.
  6. 45deg (45도) – 45도 선에 대한 시장의 속도와 움직임의 안정성을 나타냅니다.
  7. Tgt1/2 (반 목표) – 시장의 마지막 단계에서 사용되는 트렌드 목표선의 절반을 나타냅니다.
  8. Tgt (목표) – 포지션을 닫아야 하는 수준을 나타내는 트렌드 목표선입니다.
  9. Vol (볼륨) – 시장에서 볼륨의 중요한 변화를 표시하기 위해 촛대에 볼륨 점을 표시합니다.
  10. X – 시장이 목표선에 도달하면 "X"를 표시합니다.
  11. Lbls (레이블) – 선에 있는 레이블을 표시하거나 숨깁니다.
  12. RandC (무작위 색상) – 인디케이터의 선과 레이블을 더 나은 시각화를 위해 무작위 색상으로 변경합니다.

시스템
ENIGMERA는 현재 시장 상황에 대한 완전한 그림을 제공합니다. 과거 데이터를 현재와 미래에 외삽하는 일반적인 시장 인디케이터와는 달리, 만약 지원에 있다면 그것은 실제 지원입니다. 만약 저항에 있다면, 그것은 실제 저항입니다. 레벨이 깨지면 트렌드 변화가 있음을 나타냅니다.

ENIGMERA는 고객과 신뢰할 수 있는 통찰력을 공유해야 하는 금융 분석가 및 컨설턴트와 최대한의 정확도와 신뢰를 요구하는 투자자를 위해 설계되었습니다.

ENIGMERA는 최적의 정확도로 돋보이며, 트레이더가 명확하고 자신 있게 선택할 수 있도록 도와줍니다.

20년의 거래 경험과 지식을 하나의 종합 패키지로 결합한 ENIGMERA는 직관적이고 사용자 의존적입니다. 효과성은 사용자가 성능을 극대화하기 위해 적절하게 설정하는 것에 달려 있습니다.

추천 사항:

  • 통화 쌍: 모든 쌍, 모든 시장
  • 시간대: 모든 시간대
  • 최소 예치금: 제한 없음
  • 계좌 유형: 제한 없음
  • 브로커: 제한 없음

이 고급 인디케이터는 효과적인 데이 트레이딩 및 스캘핑 전략에 적합합니다. Enigmera의 고급 알고리즘을 사용하여 Forex, 주식, 지수 및 암호화폐 시장에 적용하십시오. MetaTrader 4용으로 설계된 Enigmera는 스톱 로스 및 리스크 관리를 간소화합니다.

성공적인 트레이더가 되기 위해 필요한 모든 도구. Enigmera는 모든 시장과 시간대에서 작동하며 다시 그리기 없이 작동합니다.

귀하의 금융 결정을 궁극적인 수준으로 끌어올릴 준비가 되셨나요?

리뷰 11
John
133
John 2026.07.06 23:12 

i started with this but after looking through Ivan's other indicators i changed to Meravith .. (Ivan gave me a huge discount so i could upgrade) this developer is engaging and helpful have a chat with him and see what tools he can help you with

onermentes
19
onermentes 2025.06.17 18:57 

Yaklaşık olarak 10 yıldır forex piyasasında işlem yapmaktayım. Pek çok indikatör taradım ve aldım. Neredeyse bir çoğu çöptü diyebilirim. Enigmera indikatörden ziyade bir starteji yapmamı sağlamakta. Girmiş olduğum pozisyonlarda korkumu yenmeme katkı sağladı. Daha önce erken kapatmak zorunda olduğum pozisyonlarda bearish veya bullish hedefler neredeyse tam anlamıyla doğru çalışmakta ve buna bağlı olarak pozisyonlarımı daha uzun tutabilme güvenini sağladı. Özellikle support line çok ciddi olarak destek veya direnç olarak çalışmakta. Para yapmanıza kesinlikle katkı sağlayacaktır. Ivan teşekkür ederim.

TANJU2690
734
TANJU2690 2025.03.05 13:37 

I have never and ever seen any system like Enıgmera. What ever you want, you can find on it. İt is incredible system. And Cretor of aenıgmera, Mr.Ivan is more and more helpfull to understant of logıc Enigmera. Fistly, I want sent all thankfull to Ivan because he teach me Enıgmera Logıc and also share this marvelous product with market

추천 제품
Last 50 Pips
Martin Alejandro Bamonte
Last 50 Pips 지표는 최근 가격 움직임을 기반으로 매수 및 매도 기회를 빠르게 식별하도록 설계되었습니다. 최근 캔들의 가격 변화를 측정하여 가격이 방향을 바꿀 수 있는 순간을 노란색으로 강조 표시합니다. 매수 신호: 지표가 빨간색 에서 노란색 으로 변경될 때 매수 포지션을 열어야 합니다. 이는 하락세에서 상승세로의 전환을 암시합니다. 얼마나 쉬운지 확인하려면 이미지를 참조하세요. 매도 신호: 지표가 녹색 에서 노란색 으로 변경될 때 매도 포지션을 열어야 합니다. 이는 상승세에서 하락세로의 전환 가능성을 나타냅니다. 알림: 이 지표는 또한 사용자에게 모든 기기에서 차트의 새로운 신호에 신속하게 반응할 수 있도록 소리, 이메일 또는 푸시 알림을 통한 실시간 알림을 받을 수 있는 옵션을 제공합니다. 질문이 있으면 언제든지 저에게 연락하세요 :)
Blahtech Market Profile
Blahtech Limited
4.53 (15)
Was: $249  Now: $99   Market Profile defines a number of day types that can help the trader to determine market behaviour. A key feature is the Value Area, representing the range of price action where 70% of trading took place. Understanding the Value Area can give traders valuable insight into market direction and establish the higher odds trade. It is an excellent addition to any system you may be using. Blahtech Limited presents their Market Profile indicator for the MetaTrader community. Ins
User Manual Download link: https://ontrd.com/our-books/ For all who are asking about indicator  ON Trade Numerology Station It obtain about 16 numerology strategies it make together completed unit control your trading . Basic strategies to work with it are 3 strategies statistics about them are the following : 1. RBA levels success rate more then 95%. 2. FF more then 96%  3.RBA SUN 98% We will not say 100 % as they are .. Ratio rates as following :  1.Rba levels more then 1/3 to 1/6 . 2.FF MORE
This indicator is designed for scalping on low timeframes (M1-M15) in volatile markets like major forex pairs (e.g., EURUSD, GBPUSD). It generates non-repainting buy (green up arrow) and sell (red down arrow) signals based on EMA crossover confirmed by RSI momentum and MACD crossovers, minimizing false signals in ranging markets. How to Use: Attach the indicator to your MT4 chart. Look for arrows on the chart: Buy on green up arrow, Sell on red down arrow. Signals appear at the open of the new
Master Volume profile
Israr Hussain Shah
Money Flow Profile MT5 HERE   Here   our more valuable tools SMC Trend Trading   ,  Easy SMC Trading  ,  Institutional SMC Architect Volume Analysis Tools  ,  Volume flow Profile  ,  Market volume profile  , FVG with Volume  , Liquidity Heatmap Profile  ,  Volume Spread Analysis This Master Edition is engineered for clarity and speed, featuring a unique Auto-Theme Sync system that instantly beautifies your chart layout upon loading. Key Features: True Money Flow Calculation: Goes beyond stand
Reversal Edge System은 MetaTrader 4已推出。 잠재적인 추세 반전 구역을 감지하고 명확한 거래 신호를 생성하며, 다중 타임프레임 추세 분석으로 신호를 필터링해 实例 인디케매수 강세 매도 약세 매수 성향 약세 매도 성향 매수매도 의견 충돌 请注意,请注意以下事项: 인디케ք에 내장된 신호 백테스팅 기능은 핵심 지표인 승률과 총 신호 수를 계산하며, 트레더는 차트에서 직접 과거 성과를 시각적으로 확인할 수 있습니다。 주요 기능: 고점저점 반전 신호 다중 타임프레임(MTF) 추세 확인 필터 실시간 시장 심리 라벨 모든 신호에 방익실현 및 손절 포함 신호 백테스팅 시뮬레션 승률 및 총 신호 수 통계 외환, 암호화폐, 지수, 상품 지원 재그리기 없는 알림 검증된 반전 세팅과 내장 위험 통제로 더 스마트하게 거래하고 거래 우위를 확보하세요。
FiboZag
Andriy Sydoruk
Indicator FiboZag - transfer the indicator to the chart and the Fibonacci levels will be built automatically on the last ZigZag turn. The main advantage lies in the correct construction of Fibonacci levels and markup of price levels. Simple, visual and effective use. The indicator is not redrawn and does not lag. Works on all currency pairs and on all timeframes.
RelicusRoad Daily Pivots는 MetaTrader 4와 MetaTrader 5용 일간 피벗 포인트 지표로, 전일 범위를 Fibonacci 레벨로 나누고 마이너스 100퍼센트부터 플러스 200퍼센트까지 위아래로 연장합니다. 고전적인 floor pivot 대신, 직전에 완료된 범위를 저가가 0%, 고가가 100%인 척도로 다룹니다. 열아홉 개의 레벨이 차트 오른쪽 가장자리에 촘촘한 색상 마커로 표시되므로, 오늘 움직임의 크기를 전일 범위의 일부 또는 배수로 읽을 수 있습니다. 작동 방식 지표는 직전에 완료된 기준 기간의 고가와 저가를 가져와 그 범위의 각 비율마다 레벨을 배치합니다: level = low + ratio x (high - low). 주말 봉은 건너뛰므로 월요일의 기준은 마지막 거래일입니다. 기준 기간은 차트 시간대에서 정해집니다. 내부 구간, 회색: 0%, 23.6%, 38.2%, 50.0%, 61.8%, 78.6%, 100%. 상단 구간, 초록: +123
FREE
ADX Shark Scalper
Maxwell Ndzoyiya
ADX Shark Scalper – The Ultimate Hybrid Indicator for Precision Scalping Dive into the markets with the ADX Shark Scalper , a powerful and versatile tool designed for traders who seek precision in every trade. This cutting-edge indicator seamlessly combines multiple advanced technical signals into one streamlined system, allowing you to spot good buy and sell opportunities with ease. At its core, the ADX Shark Scalper leverages the power of trend and momentum detection through the integration of
Fxland Price Reversal Zones (MT4) FXLAND Smart Reversal Indicator is a professional technical analysis tool designed to help traders identify potential price reversal zones and key market turning points with clarity and precision. The best reversal indicator and price return by choosing only one ceiling or floor in each time frame A masterpiece of combining mathematics and Gann, fractal matrix, Fibonacci, movement angle and time. Completely intelligent Key Features Detects potential pr
The Serpent Rider Binary Options
Ellan Dirgantara Tholkhah
Embark on the pinnacle of Binary Options evolution. Our indicator isn't just adaptive—it's relentless. Picture a ninja riding a serpent, shadowing its every move; that's how this tool trails the market trend, unwavering till the end. Built upon the foundational prowess of the Ichimoku indicator and honed with an array of fine-tuned oscillators, it epitomizes accuracy and precision. Dive deep without getting lost in the Ichimoku's intricacies—our indicator simplifies the process for you. Perhaps
볼륨 프로파일 스나이퍼 11.1 은 포괄적 인 시장 분석 도구입니다 거래에 대한 전문적인 접근 방식 볼륨 프로파일 스나이퍼 11.1 은 시장 상황의 포괄적 인 평가를 기반으로 명확한 신호를 제공,하나의 지표에 15 개 이상의 키 필터를 결합합니다. 주요 특징 볼륨 불균형 분석-알고리즘은 각 촛불에서 구매자와 판매자의 점유율을 계산하여 당사자 중 한 사람의 우위를 나타냅니다(구성 가능한 임계 값은 50%에서 90%까지). 다단계 신호 필터링-표시기가 고려됩니다: 2015 년 11 월 1 일 과매수/과매도 영역을 제외한 캔들 패턴(핀 바,흡수,망치) 지원/저항 레벨(자동 감지) 주요 플레이어의 활동을 식별하는 볼륨 스파이크 고전적이고 증폭 된 발산 변동성 평가 트렌드 강도를 결정하기 위한 애드엑스 가격 조치(내부 및 외부 막대) 다중 기간 확인 시장 구조(높은 최고/낮은 최저) 세션 필터(아시아,런던,뉴욕 세션) 뉴스 배출으로부터 보호 유연한 구성 시스템-
Supply and Demand Dashboard PRO
Bernhard Schweigert
4.81 (21)
현재 30% 할인! 이 대시보드는 여러 기호와 최대 9개의 타임프레임에서 작동하는 매우 강력한 소프트웨어입니다. 주요 지표(최상의 리뷰: 고급 공급 수요)를 기반으로 합니다.   Advanced Supply Demand 대시보드는 훌륭한 개요를 제공합니다. 다음과 같이 표시됩니다.  영역 강도 등급을 포함하여 필터링된 공급 및 수요 값, 영역에 대한/및 영역 내 Pips 거리, 중첩된 영역을 강조 표시하고 모든 (9) 시간 프레임에서 선택한 기호에 대해 4가지 종류의 경고를 제공합니다. 그것은 당신의 개인적인 필요에 맞게 고도로 구성 가능합니다! 당신의 혜택! 모든 트레이더에게 가장 중요한 질문: 시장에 진입하기에 가장 좋은 수준은 무엇입니까? 최고의 성공 기회와 위험/보상을 얻으려면 강력한 공급/수요 영역 내 또는 그 근처에서 거래를 시작하십시오. 손절매를 위한 최적의 장소는 어디입니까? 가장 안전하려면 강력한 수요/공급 구역 아래/위에 정류장을 두십시오.
This is an arrow indicator without a future function,developed based on the most advanced profit trading algorithms.It has the most innovative and advanced dual trend analysis module, as well as the latest and highly effective market trend prediction algorithm.Trends are your friends, and following larger trends can earn the maximum profit in foreign exchange. This indicator helps traders identify current trends and track them. Someone once made a profit of 10 times in a week by relying on it.No
BSA Indicator
Ahmet Metin Yilmaz
BSA indicator is a ZigZag based indicator. This indicator is used to find the reversal level of the price. You can use the existing risk ratio and calculation timeframe in the entries by optimizing them according to your usage preference.  In lower time frames, the indicator can repaint. For healthier results, you can detect the least repainting by observing for a while according to the graphic you will apply.
VWAP Volume Price Customized Cycle FX-AIEA — Multi-Timeframe Anchored VWAP Indicator (Technical Features & Parameter Discussion) Overview This indicator extends the traditional VWAP (Volume Weighted Average Price) with multi-timeframe anchoring and customizable session reset mechanisms, aiming to provide a dynamic "fair value" reference area. The indicator constructs symmetric volatility boundaries via triple standard deviation channels (±1σ/±2σ/±3σ), which can serve as reference dynamic support
이 인디케이터는 수동 및 자동 방법으로 차트에 그려진 조화 패턴을 감지합니다. 사용 후기를 추가하십시오. 참고 사항: 이 인디케이터에는 제어 패널이 있으며 모든 (차트 및 시간대) 설정을 저장합니다. 더 많은 공간을 확보하려면 최소화할 수 있으며 다른 분석 도구와 함께 작업하려면 모든 인디케이터 데이터를 숨기려면 닫기 버튼을 누를 수 있습니다. 이 인디케이터를 사용하고 설정을 변경하면 이동평균이나 볼린저 밴드와 같은 인디케이터를 추가할 때 편집 내용의 템플릿을 자동으로 저장하고 필요할 때 언제든지 로드할 수 있습니다. Windows 10을 사용하는 경우 MetaTrader 아이콘을 마우스 오른쪽 단추로 클릭한 다음 호환성 > 고DPI 설정 변경 > 시스템(개선)을 선택하여 최상의 화면 설정을 사용할 수 있습니다(HD 기기에서 수행되어야 함). 이 인디케이터는 본질적으로 차트에서 조화 거래 이론을 해석하는 것으로 조화 패턴을 감지합니다. 배우고 싶다면 Scott Carney의 "Har
Trend Scan Friend
Israr Hussain Shah
Here   our more valuable tools SMC Trend Trading   ,  Easy SMC Trading  ,  Institutional SMC Architect Volume Analysis Tools  ,  Volume flow Profile  ,  Market volume profile  , FVG with Volume  , Liquidity Heatmap Profile  ,  Volume Spread Analysis Trend Identification: Look for the color change. When candles turn Green , look for Buy opportunities. When they turn Red , look for Sell opportunities. Entry: Enter on the break of the trend line or on the pullback to the line. Stop Loss: Use the
This indicator draws the volume bars as a colour gradient instead of a single flat colour, so that strong and weak volume can be told apart at a glance. Every bar is compared with the average volume over a lookback period you set. The further a bar stands above that average, the deeper its colour; bars near or below the average are drawn in a pale shade. The hue follows the candle direction, one colour for volume on rising candles and another for volume on falling candles, so the balance betwe
Key level wedge pro
Presley Annais Tatenda Meck
5 (1)
We have combined all of our beloved indicators the likes of: Key level order block , Key level supply and demand , Key level liquidity grab and Key level wedge into one single indicator and dashboard. Whats new Dashboard : There is an easy access dashboard for all your needs. Multi-timeframe button : There is now a multi-timeframe option for Order Blocks and Supply and demand zones, making it easy to see higher timeframe zones easily on the current timeframe by just clicking the desired timefra
It will be the best tool for you to make a profit! Through unique algorithms You're going to see an amazing amount of right trading signals Make huge profits every day and realize more possibilities!   Like the car no money to buy it, the love of the girls dare not to pursue?Or the credit card bill is not paid, the rent does not have the extra money to settle?Or are you fed up with being bossed around by your boss and Hope to get more people's respect?Can't afford to buy the things you want ? wa
우리의 새로운 지표를 소개합니다: [ON Trade Breakout Zone] 모든 트레이더를 위한 간단하면서도 강력한 시장 분석 도구! 프로와 초보 트레이더 모두에게 적합 당신의 거래 전략을 강화할 준비가 되셨나요? 우리의 최신 지표는 시장 분석을 간소화하고 모든 수준의 트레이더에게 자유로운 수익을 얻을 수 있는 열쇠입니다. 당신이 경험이 풍부한 전문가이든 막 시작한 초보자이든, [ON Trade Breakout Zone]은 시장의 잠재적인 이익을 해제할 수 있는 키입니다. [ON Trade Breakout Zone] 사용 방법: 이 지능형 도구는 매일 고급 알고리즘을 사용하여 차트에 손쉽게 영역을 그립니다. 여기에서 최대한 활용하는 방법입니다: 영역 식별: [ON Trade Breakout Zone]은 차트에서 핵심 영역을 정확하게 식별하여 잠재적인 거래 기회를 쉽게 발견할 수 있도록 도와줍니다. 거래 실행: 가격이 그려진 영역의 한 쪽으로 이동할 때까지 기

PZ 123 Pattern
PZ TRADING SLU
1 (1)
Unlock powerful breakout opportunities The 123 Pattern is one of the most popular, powerful and flexible chart patterns. The pattern is made up of three price points: a bottom, a peak or valley, and a Fibonacci retracement between 38.2% and 71.8%. A pattern is considered valid when the price breaks beyond the last peak or valley, moment at which the indicator plots an arrow, rises an alert, and the trade can be placed. [ Installation Guide | Update Guide | Troubleshooting | FAQ | All Products  ]
Swing Master Indicator
Elias Mtwenge
5 (1)
Dear Traders this is my another tool called " Swing Master Indicator ". As the name above the indicator is designed to help you in swing trading by capturing the low and highs of the price. You may us this tool with any trading strategy and style from scalping to position trading. It is made for level of traders including newbies and advanced traders even prop-firms, hedge funds and banks to help them make sold market analysis. I create tools for serious traders who want to make a difference in
EARLY REMINDER: The Starting price is 65 price will rise soon up to 365$ and then 750$ after first 10 copies of sales. Grab this offer now! Introduction Hello, traders! Welcome to the demonstration of the Forex Beast Indicator , a comprehensive tool designed to assist aspiring traders in navigating the complexities of the forex market. This indicator incorporates seven essential components to provide a well-rounded trading experience: Moving Averages Colored Zones Support and Resistance Levels
There are 8 types of this indicator. Consisted of 1. Bullish and Bearish Engulfing 2. Morning and Evening Star 3. Three Green Soldiers and Three Red Crows 4. Three Inside Up and Down 5. Three Outside Up and Down 6. Bullish and Bearish Harami 7. Tweezers Top and Bottom 8. Piercing and Dark cloud cover Signal Filter :: 1. The appearance of the candle stick 2. SMA 3. 2EMA :: EMA Fast and EMA Slow 4. RSI N otification :: 1. Via screen 2. Email 2. Phone For trading 1. Scaling 2. Binary options 3.
Trade with super Support and Resistance Breakout system. are you looking for the most sophisticated tools for your daily trading ? this tools are perfect for you, it has a most comprehensive breakout identification spot on all market (Forex, CFD, indice, etc) Limited offer :  10 copy for 30$ Indicator parameter: Depth: to arrange how deep to calculates the support and resistance zone Deviation Back-step the demonstration result you can see on the media file below.

Gold Phoenix
Yaroslav Varankin
The perfect tool for Scalng in the Forex markets You can trade both from signal to signal and using take profit  The algorithm does not use Zigzag!  No redrawing!  This is a channel instrument that uses a moving average as a filter. Moving Average  There are 2 parameters for the settings Ma Period = 5 period Moving Average  Channel 1.0 distance of channel lines from the chart Price Signal Filter - calculation of signal opening and filter There is a complete set of Alert There is a multi-timefram
Part of the Shved Market Analysis System (SMAS). Identifies areas of maximum Supply and Demand zone density and confluence, providing deeper market insight as part of the integrated SMAS ecosystem. Shved Supply and Demand Cluster Profile is a revolutionary, high-performance visualization tool designed to map market volume density and supply/demand zone clusters, created by a professional trader for traders. The Shved Supply and Demand Cluster Profile is a core component and the analytical h
ShvedSupDem Pro Zone
Andrey Shvedov
4.6 (5)
Part of the Shved Market Analytics System (SMAS). ShvedSupDem Pro Zone(Chart Pro) is one of the core modules of the SMAS ecosystem—a professional market analysis system built around supply and demand, market structure, and multi-timeframe confirmation. ShvedSupDem Pro Zone(Chart Pro) is a professional indicator for automated drawing of Supply and Demand zones directly on the chart of the MetaTrader 4 terminal. The indicator automatically identifies and plots key market imbalance areas where
이 제품의 구매자들이 또한 구매함
Miraculous Indicator Binary & Forex v3 StrategySafe Miraculous Indicator Binary & Forex v3 StrategySafe 는 명확한 신호, 강력한 확인 도구, 그리고 Binary 및 Forex 시장에서 사용할 수 있는 체계적인 거래 방식을 원하는 트레이더를 위한 전문 지표입니다. v3 버전에는 MIR Dashboard, Miraculous Confirmation Dashboard, GANN Law, Square of 9 레벨, GANN 각도, 그리고 더욱 강화된 Forex 모드가 포함되어 있습니다. 주요 기능 Binary 모드와 Forex 모드를 하나의 지표에서 지원. MIR Dashboard로 빠른 시장 흐름 확인. Miraculous Confirmation Dashboard로 진입 신호 확인. Forex 분석을 위한 GANN Law drawing lines. Square of 9 라인, 레벨, 방향 표시. 1x1 G
Super Signal – Skyblade Edition 전문가용 노리페인트 / 노래그 트렌드 신호 시스템, 뛰어난 승률 제공 | MT4 / MT5용 1분, 5분, 15분과 같은 낮은 타임프레임에서 가장 좋은 성능을 보입니다. 핵심 기능: Super Signal – Skyblade Edition은 추세 매매를 위해 설계된 스마트 신호 시스템입니다. 이 시스템은 다중 필터 로직을 활용하여, 명확한 방향성과 실질적인 모멘텀이 수반된 고품질 추세만을 감지합니다. 이 시스템은 고점 또는 저점을 예측하지 않으며 , 다음 세 가지 조건이 모두 충족될 때만 신호를 발생시킵니다: 명확한 추세 방향 강화되는 모멘텀 건전한 변동성 구조 또한, 시장 세션 기반의 유동성 분석을 통해 신호의 신뢰성과 타이밍을 더욱 향상시킵니다. 신호 특성: 모든 화살표 신호는 100% 리페인트 없음 / 지연 없음 신호가 한 번 발생하면 고정되며, 깜빡이거나 사라지지 않음 차트 상의 시각적 화살표, 정보 패널, 팝업 알
TrendMaestro
Stefano Frisetti
4 (4)
Attention: beware of SCAMS, TRENDMAESTRO is only ditributed throught MQL5.com market place. note: this indicator is for METATRADER4, if you want the version for METATRADER5 this is the link:  https://www.mql5.com/it/market/product/108106 TRENDMAESTRO ver 2.5 TRENDMAESTRO recognizes a new TREND from the start, he never makes mistakes. The certainty of identifying a new TREND is priceless. DESCRIPTION TRENDMAESTRO identifies a new TREND in the bud, this indicator examines the volatility, volumes a
ORB Seeker
Marcela Goncalves De Oliveira
4 (1)
한정 수량 판매 및 제품 희소성 유지를 위한 특별 가격입니다! 단돈 599달러! 구매 후 저에게 연락 주시면 보너스 ORB Seeker EA와 개인 최적화 설정 파일을 보내드립니다. 깔끔한 세션 브레이크아웃을 자신감 있게 활용하세요! ORB Seeker는 정확성, 단순성, 유연성 및 명확한 차트 구조를 원하는 트레이더를 위해 개발된 전문적인 시가 범위 돌파(ORB) 지표입니다. 이 프로그램은 모든 금융 상품에 대해 장전 거래 또는 사용자 지정 세션 범위를 자동으로 표시하고, 진입, 손절매, 목표 수익 및 선택적으로 50% 부분 목표 수익 수준을 포함한 명확한 돌파 신호를 제공합니다. 모든 계산은 실시간으로 차트에 직접 표시됩니다. 런던 개장, 뉴욕 세션, 아시아 세션 또는 사용자 지정 시장 시간대를 선택하여 거래하세요. ORB Seeker는 사용자가 선택한 세션 시간에 맞춰 작동하므로 시장 범위, 돌파 수준 및 거래 레벨을 정확하게 확인할 수 있습니다. 모든 구매 시 ORB Se
There is always a need to measure if the market is "quiet" or it is volatile. One of the possible way is to use standard deviations, but the issue is simple : We do not have some levels that could help us find out if the market is in a state of lower or higher volatility. This indicator is attempting to do that : •           values above level 0 are indicating state of higher volatility (=GREEN buffer) •           values below level 0 are indicating state of lower volatility (=RED buffer)
Gold Channel XAUUSD
Paulo Rocha
5 (4)
Gold Channel is a volatility-based indicator, developed with a specific timing algorithm for the XAUUSD pair, which consists of finding possible corrections in the market. This indicator shows two outer lines, an inner line (retracement line) and an arrow sign, where the theory of the channel is to help identify overbought and oversold conditions in the market. The market price will generally fall between the boundaries of the channel. If prices touch or move outside the channel it is a tradi
OrderFlow Absorption – MT4용 전문 델타 & 흡수 신호 인디케이터 OrderFlow Absorption으로 진정한 오더플로우 분석의 힘을 경험하세요. MetaTrader 4를 위한 궁극의 델타 히스토그램 및 흡수 신호 인디케이터입니다. 가격 움직임의 이면에서 실제로 무슨 일이 일어나는지 알고 싶은 트레이더를 위해 설계된 이 도구는, 시장을 움직이는 숨겨진 매수/매도 압력과 흡수 이벤트를 드러냅니다. 주요 기능 델타 히스토그램 시각화:   매수와 매도 압력을 색상별 히스토그램으로 즉시 확인할 수 있습니다. 흡수 신호 감지:   고급 로직으로 강세 및 약세 흡수 이벤트를 식별하여 반전 신호를 미리 알려줍니다. 차트 마커:   흡수 신호가 차트에 직접 표시되어 시각적으로 쉽게 확인할 수 있습니다. 팝업 알림:   새로운 흡수 신호가 발생하면 실시간으로 알림을 받을 수 있습니다. 사용자 지정 임계값:   약한 신호는 필터링하고, 확률이 높은 기회에 집중할 수 있습니다.
Meravith
Ivan Stefanov
5 (3)
마켓 메이커를 위한 도구. Meravith는 다음과 같은 기능을 제공합니다: 모든 타임프레임을 분석하고 현재 유효한 추세를 표시합니다. 강세와 약세 거래량이 동일한 유동성 구간(거래량 균형 구간)을 강조 표시합니다. 서로 다른 타임프레임의 모든 유동성 레벨을 차트에 직접 표시합니다. 텍스트 기반 시장 분석을 생성하여 참고용으로 제공합니다. 현재 추세를 기반으로 목표가, 지지선 및 손절가를 계산합니다. 거래의 위험 대비 보상 비율(Risk/Reward)을 계산합니다. 계좌 잔고에 따라 포지션 크기를 산출하고 잠재 수익을 추정합니다. 시장에 중대한 변화가 발생할 경우 경고도 제공합니다. 지표의 주요 라인: 강세/약세 거래량 소진 라인 — 목표가로 사용됩니다. 시장 추세를 나타내는 라인. 시장이 강세인지 약세인지에 따라 색상이 변경되며 추세 지지선 역할을 합니다. 색상은 주로 시장 심리를 보여줍니다. 거래량 균형선(Eq). Eq(Volume Equilibrium) 라인은 시스템의 핵심입니
Linear Trend Predictor - 진입 지점과 방향성 지원선을 결합한 추세 지표입니다. 고가/저가 채널을 돌파하는 원칙에 따라 작동합니다. 지표 알고리즘은 시장 노이즈를 걸러내고 변동성과 시장 역학을 고려합니다. 표시기 기능  평활화 방법을 사용하여 시장 추세와 BUY 또는 SELL 주문을 시작하기 위한 진입 시점을 보여줍니다.  모든 기간의 차트를 분석하여 단기 및 장기 시장 움직임을 파악하는 데 적합합니다.  어떠한 시장과 시간대에도 적용할 수 있으며, 입력 매개변수를 통해 거래자는 자신에게 맞게 지표를 독립적으로 사용자 지정할 수 있습니다.  설정된 지표 신호는 사라지거나 다시 그려지지 않습니다. 이는 캔들 마감 시 결정됩니다.  여러 유형의 알림이 화살표와 결합되어 있습니다.  이 지표는 독립적인 거래 시스템으로 사용할 수도 있고, 다른 거래 시스템에 추가하는 용도로도 사용할 수 있습니다.  모든 수준의 경험을 가진 거래자가 사용할 수 있습니다. 주요 매
Binary Booster
Yaroslav Varankin
5 (1)
Binary Options Trading Indicator: A Reliable Tool for Your Trades This indicator is specifically designed for binary options trading and has proven its high quality, reliability, and adequate accuracy, depending on the dynamics of the chart. Key Points: Signal Interpretation: When a blue cross signal appears, it indicates a potential entry into a trade, though it is considered a weak signal on its own. However, if the blue cross is accompanied by an arrow, it is considered a more reliable buy s
First time on MetaTrader, introducing IQ Star Lines - an original Vedic Astrology based indicator. "Millionaires don't use astrology, billionaires do" . - J.P. Morgan, Legendary American financier and banker. We don't offer free or bonus indicators in exchange of reviews from you. You won't need any free products with this indicator to make it work. ;) Enjoy! Welcome to  the new and updated  IQ Star Lines , the ultimate fusion of ancient planetary harmonic cycles and modern quantitative trading.
ATC AlgoZone Indicator
Ameur Boudenne
5 (2)
Algo Trading Indicaor  With this indicator , you’ll have zones and trends that hight probability the price will reverse from it. so will gives you all the help that you need  MT5 Version                    https://www.mql5.com/en/market/product/170028 MT4 Version                    https://www.mql5.com/en/market/product/88034 Why should you join us !?  1-This indicator is logical since it’s working in previous days movement , to predict the future movements. 2-Algo trading indicator will hel
CVD 다이버전스 검출 - 고급 볼륨 델타 분석   우리가 해결하는 문제 대부분의 트레이더들은 가격 움직임에만 의존하여 진정한 시장 심리를 드러내는 중요한 볼륨 플로우 정보를 놓치고 있습니다. 전통적인 지표는 가격 움직임에 뒤처져 늦은 진입과 나쁜 리스크 관리를 유발합니다. CVD 다이버전스 검출은 가격과 볼륨 델타 모멘텀 간의 관계를 분석하여 이를 해결하고, 주요 시장 움직임 전에 조기 경고 신호를 제공합니다.   CVD 다이버전스 분석의 장점   조기 시장 반전 검출   - 가격 차트에 나타나기 전에 모멘텀 변화를 발견   스마트 머니 추적   - 기관투자자들이 언제 축적하거나 분산하는지 확인   거짓 신호 감소   - 볼륨이 가격 움직임을 확인하여 더 높은 확률의 세팅 제공   멀티 타임프레임 우위   - 스캘핑부터 스윙 트레이딩까지 모든 시간대에서 작동   범용 적용   - 외환, 주식, 원자재, 암호화폐와 호환   4가지 시장 단계 - 실제
Pair Trading Station MT4
Young Ho Seo
3.67 (3)
How to use Pair Trading Station Pair Trading Station is recommended for H1 time frame and you can use it for any currency pairs. To generate buy and sell signal, follow few steps below to apply Pair Trading Station to your MetaTrader terminal. When you load Pair Trading Station on your chart, Pair Trading station will assess available historical data in your MetaTrader platforms for each currency pair. On your chart, the amount of historical data available will be displayed for each currency pai
FFx Engulfing Setup Alerter gives trade suggestions with Entry, Target 1, Target 2 and StopLoss. Below are the different options available: Entry suggestion - pips to be added over the break for the entry 3 different options to calculate the SL - by pips, by ATR multiplier or at the pattern High/Low 3 different options to calculate the 2 TPs - by pips, by ATR multiplier or at Risk/Reward Offset the dashboard - any place on the chart Remove the suggestion once the price reached the SL line Lines
FFx InsideBar Setup Alerter gives trade suggestions with Entry, Target 1, Target 2 and StopLoss. Below are the different options available: Entry suggestion - pips to be added over the break for the entry Minimum candle size - to avoid too close buy/sell entry suggestions 3 different options to calculate the SL - by pips, by ATR multiplier or at the pattern High/Low 3 different options to calculate the 2 TPs - by pips, by ATR multiplier or at Risk/Reward Offset the dashboard - any place on the c
FFx OutsideBar Setup Alerter gives trade suggestions with Entry, Target 1, Target 2 and StopLoss. Below are the different options available: Entry suggestion - pips to be added over the break for the entry. 3 different options to calculate the SL - by pips, by ATR multiplier or at the pattern High/Low. 3 different options to calculate the 2 TPs - by pips, by ATR multiplier or at Risk/Reward. Offset the dashboard - any place on the chart. Remove the suggestion once the price reached the SL line.
FFx PinBar Setup Alerter gives trade suggestions with Entry, Target 1, Target 2 and StopLoss. Below are the different options available: Entry suggestion - pips to be added over the break for the entry Minimum candle size - to avoid too small candles 3 different options to calculate the SL - by pips, by ATR multiplier or at the pattern High/Low 3 different options to calculate the 2 TPs - by pips, by ATR multiplier or at Risk/Reward Offset the dashboard - any place on the chart Remove the sugges
Lineverse Trendlines
Arkady Segal
5 (1)
Automatic, live & interactive picture of all trendlines. Assign push, email and sound alerts to the lines of your choice and be informed about price rollback, breakout, rollback after breakout, number of rollbacks, line expiration by double breakout. Correct, drag or delete the lines and interactively tune the line system. https://youtu.be/EJUo9pYiHFA . Chart examples https: //www.mql5.com/en/users/efficientforex Price Interaction Events All events are effective immediately and only after one
Adaptive Stochastic
Rasoul Mojtahedzadeh
Stochastic Oscillator is one of the most popular and accurate oscillators widely used by traders to capture overbought and oversold areas of price action. Although the Stochastic indicator works fine for an interval of the market, it fails to generate profitable signals when the market conditions change, and hence it produces wrong signals resulting in big losses. Have you ever thought about an adaptive Stochastic indicator that adapts its period of calculation based on the market conditions? Th
FFx MACD Divergences
Eric Venturi-Bloxs
The purpose of this new version of the MT4 standard indicator provided in your platform is to display in a sub-window multiple timeframes of the same indicator with its divergences. See the example shown in the picture below. But the display isn't like a simple MTF indicator. This is the real display of the indicator on its timeframe. Here's the options available in the FFx divergences indicator: Select the timeframes to be displayed (M1 to Monthly) Define the width (number of bars) for each tim
FFx RSI Divergences
Eric Venturi-Bloxs
The purpose of this new version of the MT4 standard indicator provided in your platform is to display in a sub-window multiple timeframes of the same indicator with its divergences. See the example shown in the picture below. But the display isn't like a simple MTF indicator. This is the real display of the indicator on its timeframe. Here's the options available in the FFx divergences indicator: Select the timeframes to be displayed (M1 to Monthly) Define the width (number of bars) for each tim
FFx CCI Divergences
Eric Venturi-Bloxs
The purpose of this new version of the MT4 standard indicator provided in your platform is to display in a sub-window multiple timeframes of the same indicator with its divergences. See the example shown in the picture below. But the display isn't like a simple MTF indicator. This is the real display of the indicator on its timeframe. Here's the options available in the FFx divergences indicator: Select the timeframes to be displayed (M1 to Monthly). Define the width (number of bars) for each ti
The FFx Dashboard MTF alerter will show you on a single chart all the timeframes (M1 to Monthly) with their own status for the indicator. 2 Alert Options: Single timeframe: each selected timeframe alert separately when a signal occurs Multi timeframes: all selected timeframes must agree for an alert to be triggered Both options have an input to select the timeframes to be used for the alert(s). How to Understand the Status: Green/Red square: histogram above/below 0 line Green square + Red bord
The FFx Dashboard MTF alerter will show you on a single chart all the timeframes (M1 to Monthly) with their own status for the indicator. 2 Alert Options: Single timeframe: each selected timeframe alert separately when a signal occurs Multi timeframes: all selected timeframes must agree for an alert to be triggered Both options have an input to select the timeframes to be used for the alert(s). How to understand the status: Green/Red square: RSI above/below 50 line Green square + Red border: R
The FFx Dashboard MTF alerter will show you on a single chart all the timeframes (M1 to Monthly) with their own status for the indicator. 2 Alert Options: Single timeframe: each selected timeframe alert separately when a signal occurs Multi timeframes: all selected timeframes must agree for an alert to be triggered Both options have an input to select the timeframes to be used for the alert(s). How to understand the status: Green/Red square: Stoch above/below 50 line Green square + Red border:
The FFx Dashboard MTF alerter will show you on a single chart all the timeframes (M1 to Monthly) with their own status for the indicator. 2 Alert Options: Single timeframe: each selected timeframe alert separately when a signal occurs Multi timeframes: all selected timeframes must agree for an alert to be triggered Both options have an input to select the timeframes to be used for the alert(s). How to understand the status: Green/Red square: Price above/below Cloud (Kumo) Green square + Red bo
The FFx Dashboard MTF alerter will show you on a single chart all the timeframes (M1 to Monthly) with their own status for the indicator. 2 Alert Options: Single timeframe: each selected timeframe alert separately when a signal occurs Multi timeframes: all selected timeframes must agree for an alert to be triggered Both options have an input to select the timeframes to be used for the alert(s). How to understand the status: Green/Red square: MA pointing Up/Down Green square + Red border: MA po
제작자의 제품 더 보기
Meravith Scanner
Ivan Stefanov
5 (3)
MERAVITH SCANNER는 MetaTrader 5용 전문 금융 시장 지표로, 여러 분석 도구를 하나의 통합 시스템으로 결합합니다. 독점적인 거래량 가중 평균 가격(VWAP) 방법론을 사용하여 모든 계산을 자동으로 수행하며, 주관적인 해석을 완전히 배제합니다. 이 지표는 모든 자산 클래스(Forex, 주식, 지수, 상품, 암호화폐)와 M1부터 월간 차트까지 모든 시간 프레임에서 작동합니다. 기본 원리는 “가격은 거래량을 따른다”입니다. MERAVITH는 기관 거래량이 집중되는 위치를 식별하고, 그 집중에서 수학적으로 정확한 가격 수준을 도출합니다. 예측이나 투기를 하지 않으며, 계산만 수행합니다. MERAVITH SCANNER를 사용하면 28개의 주요 Forex 통화쌍을 모든 시간 프레임에서 단 2~3분 만에 스캔할 수 있습니다. 또한 원하는 시장을 스캔할 수도 있으며, 예를 들어 약 100개의 주식을 약 10분 안에 스캔할 수 있습니다. 지표는 소진 레벨, 균형선, 편차, 통계
Meravith MT5
Ivan Stefanov
5 (3)
MERAVITH는 MetaTrader 5용 멀티 타임프레임 거래량·유동성 지표로, 모든 타임프레임에서 추세, 지지와 저항 구간, 진입, 목표, 손절을 보여줍니다. 시장의 완전한 유동성 지도, 헤지펀드 스타일의 유동성 도구를 제공하며, 자체 거래량 가중 평균 가격 방식으로 모든 계산을 자동으로 수행하므로 주관적인 해석이 없습니다. 외환, 금(XAUUSD), 지수, 암호화폐에서 작동하며, 모든 타임프레임에서 사용할 수 있습니다. 구매 후 보너스: MERAVITH로 거래하는 방법에 대한 동영상 강의 모음. 구매 후 저에게 메시지를 보내주세요. MERAVITH의 기능 모든 타임프레임을 분석하고 각 타임프레임에서 현재 유효한 추세를 보여줍니다. 유동성 구간(Volume Equilibrium)을 표시합니다. 상승 거래량과 하락 거래량이 같아지는 지점입니다. 모든 타임프레임의 유동성 레벨을 차트에 직접 표시합니다. 참고용으로 시장의 텍스트 분석을 작성합니다. 현재 추세를 기준으로 진입, 목표,
Currency Strength Anchor — 세션에 따라 적응하는 상대 강도 지표. 일간·주간·월간 시가를 기준점으로 사용. 리페인트 없음. 대부분의 강도 지표는 고정된 기간을 기준으로 상품을 비교합니다. 하지만 거래일이 아시아 세션에서 유럽, 미국 세션으로 넘어가면서 이러한 비교의 의미는 달라집니다. 아시아 세션 데이터로 만든 강도 순위는 런던과 뉴욕이 거래 중일 때는 거의 의미가 없습니다. Currency Strength Anchor는 다른 기준을 사용합니다. 각 상품을 일간, 주간, 월간 시가라는 세 가지 고정 앵커 포인트에 대해 측정하며, 트레이더가 현재 거래 중인 세션에 따라 계산 범위를 자동으로 조정합니다. 컨텍스트는 자동으로 다음 사이에서 전환됩니다: 아시아 세션만 아시아 + 유럽 세션 아시아 + 유럽 + 미국 세션 미국 세션만 값은 완료된 가격 데이터로 계산되며, 리페인트되지 않습니다. 읽는 방법 지표는 차트의 심볼을 구성하는 각 요소에 대해 한 개의 선을 그립니
Transaction Speed MT5
Ivan Stefanov
5 (4)
이 지표는 시장에서 관심이 나타나는 영역 을 강조 표시한 후, 주문이 누적되는 영역 을 보여줍니다. 이는 **대규모 오더북(호가창)**처럼 작동합니다. 이것은 거대한 자금 을 위한 인디케이터입니다. 성능은 탁월하며, 시장에서 어떤 관심이 있든 반드시 포착할 수 있습니다 . (이것은 완전히 새로 작성되고 자동화된 버전 입니다 – 이제 수동 분석은 필요하지 않습니다.) **거래 속도(Transaction Speed)**는 새로운 개념의 인디케이터로, 시장에 대규모 주문이 언제, 어디에 쌓이는지를 보여주며 , 그 이점을 분석합니다. 매우 초기 단계에서 트렌드 전환 을 감지할 수 있습니다. FX 시장에서 흔히 사용하는 "거래량(volume)"은 오해입니다. 실제로는 시간당 가격 변화량 이므로, 올바른 용어는 거래 속도 입니다. 우리가 어떻게 사고하고, 행동하며, 분석하느냐 가 가장 중요합니다. 분석 패러다임의 전환 은 필수적입니다. 이 인디케이터는 외환 시장에서의 볼륨 개념을 논리적으로
Fibowave
Ivan Stefanov
FIBOWAVE 월봉 차트에서 M5까지 일곱 개의 타임프레임에서 동시에 엘리어트 파동을 자동으로 카운트하며, 진행 중인 조정의 피보나치 되돌림, 3번, 5번, C 파동의 피보나치 목표치, 카운트가 무효화되는 가격 레벨, 그리고 3번 또는 5번 파동이 시작될 때의 알림을 함께 제공합니다. 엘리어트 파동을 손으로 세는 일은 느리고, 두 분석가가 같은 카운트에 도달하는 경우는 드뭅니다. FIBOWAVE는 고정된 규칙에 따라 언제나 동일한 방식으로 카운트하며, 파동과 그 하위 파동, 그리고 그 하위의 하위 파동까지 차트에 표시합니다. 카운트가 시작되는 지점 시작점을 직접 고르지 않아도 되고, 아무것도 설정하지 않아도 됩니다. 이 지표는 시장이 새로운 움직임의 시작을 보여 준 마지막 지점을 월봉 차트에서부터 아래로 내려가며 찾고, 그 지점에서부터 카운트합니다. 움직임이 시작되는 시점에서 그것은 새로운 추세의 1번 파동일 수도 있고 이전 추세의 2번 파동일 수도 있으며, 가격이 다시
MACD divergency
Ivan Stefanov
4.7 (10)
이 지표는 지수이동평균(EMA) 기간을 5(빠름)와 34(느림), 신호선 기간을 5로 설정하여 가격 움직임과 MACD 히스토그램 간의 강세 및 약세 다이버전스를 정확하게 식별합니다. 지표는 모멘텀이 약화되는 지점을 강조 표시하여 잠재적 추세 반전을 알립니다. 올바른 다이버전스 식별 규칙: 강세 다이버전스는 가격이 더 낮은 저점을 형성하면서 MACD 히스토그램이 동시에 0선 위에서 더 높은 저점을 형성할 때 유효합니다. 약세 다이버전스는 가격이 더 높은 고점을 형성하면서 MACD 히스토그램이 동시에 0선 아래에서 더 낮은 고점을 형성할 때 유효합니다. 히스토그램의 극값과 가격의 극값이 0선의 같은 쪽에 있지 않으면 다이버전스 신호는 무효로 간주되며, 이는 잘못된 신호를 초래할 수 있습니다. 이 접근법은 MACD 다이버전스 분석을 적용하는 가장 정확하고 신뢰할 수 있는 방법을 제시합니다. 지표 특징: 확인된 강세 및 약세 다이버전스를 명확하게 표시합니다. 신뢰성을 높이기 위해 MACD
FREE
Ichimoku Nexus Pro
Ivan Stefanov
5 (1)
Ichimoku Nexus Pro 호소다 고이치의 세 가지 이론을 하나의 차트에 모두 담은 일목균형표입니다. 다섯 개의 선, 파동론(I, V, N, P, Y, W 파동), 가격론(N, V, E, NT 목표치), 시간론(기본수치와 대등수치의 시간 계산). 여기에 리페인팅하지 않는 상위 시간대 구름, 수치화된 후행스팬, 기준선이 평탄하거나 구름이 얇거나 가격이 구름 안에 있는 동안 교차 신호를 보류하는 횡보 필터, 그리고 시세창의 모든 종목을 읽어 신뢰도 순으로 정렬하는 스캐너가 더해집니다. 대부분의 일목균형표 도구는 다섯 개의 선을 그리고 패널과 알림을 덧붙입니다. 다섯 개의 선은 일목균형표의 첫 부분일 뿐입니다. 호소다는 이 체계를 세 가지 이론 위에 세웠습니다. 움직임의 형태, 어디까지 가야 하는가, 그리고 언제 변화가 올 때인가. Ichimoku Nexus Pro는 이 세 가지를 모두 그립니다. 다섯 개의 선 전환선, 기준선, 구름(선행스팬 A와 B), 후행스팬을 지표 내부에서
FREE
Primes Action
Ivan Stefanov
Primes Action은 전일, 전주, 전월의 고가 및 저가 레벨을 차트에 표시하고, 가격이 이 레벨을 돌파할 때 알려줍니다. 각 타임프레임마다 고유한 색상이 있어 세 가지 기준선을 쉽게 구분할 수 있습니다. 레벨을 찾는 방법 한 기간의 정확한 고가나 저가는 대개 짧은 꼬리입니다. Primes Action은 완료된 직전 기간의 위쪽 8분의 1과 아래쪽 8분의 1 구간을 봅니다. 각 구간에서 가격이 가장 오래 머문 위치에 레벨을 그립니다. 계산에는 보고 계신 차트의 봉이 아니라 1분 데이터를 사용합니다. 따라서 일간, 주간, 월간 레벨은 M5, H1, H4에서 모두 동일합니다. 하루는 뉴욕 마감, 즉 뉴욕 시간 17:00에 끝납니다. 미국 서머타임은 자동으로 처리됩니다. 한 주는 뉴욕 시간 일요일 17:00부터 금요일 17:00까지입니다. 따라서 레벨은 브로커 서버의 시간대에 영향을 받지 않습니다. 돌파선 W. D. 갠은 lost motion을 설명했습니다. 가격은 레벨을 조금
KAMA Confluence Engine
Ivan Stefanov
5 (2)
KAMA Confluence Engine 트렌드에 따라 거래하고, 시장이 반전되는 순간에 즉시 진입, 스톱, 목표가를 확인하세요. KAMA Confluence Engine은 Kaufman Adaptive Moving Average(KAMA)를 기반으로 한 올인원 트렌드 지표로, 틱 거래량 가중치, 멀티 타임프레임 확인, 자동 거래 레벨 기능이 강화되어 있습니다. 시장 상황에 따라 자동으로 적응하며, 트렌드 구간에서는 빠르고 민감하게, 횡보 구간에서는 안정적이고 노이즈를 필터링하여 항상 올바른 방향에서 거래할 수 있도록 돕습니다. 특징 거래량 가중 적응형 엔진 실제 틱 거래량이 증가하면 KAMA 라인이 빨라지고, 거래량이 줄어들면 느려집니다. 강한 움직임에는 머물고, 가짜 신호는 피할 수 있습니다. 눈에 띄는 네온 리본 밝고 부드러운 라인으로, 아래에는 짙은 그림자가 있습니다. 녹색 = 상승 추세, 빨간색 = 하락 추세, 회색 = 횡보/비거래. 멀리서도 한눈에 추세를 파악할 수 있습니
Order Block Scorecard는 차트에 공급 구간과 수요 구간을 표시하고, 각 구간마다 사용자의 실제 히스토리에서 측정한 기록을 남깁니다. 가격이 그 구간에 몇 번 진입했는지, 그중 몇 번을 지켜냈는지, 그리고 그 후 가격이 얼마나 멀리 이동했는지입니다. 이 세 숫자는 지금 보고 있는 종목과 시간대에서 이미 일어난 일을 설명합니다. 과거 움직임의 기록이지 예측이 아닙니다. 구간 규칙 규칙은 하나뿐이며, 전부 적어 두었으므로 어떤 캔들에서든 눈으로 확인할 수 있습니다. 공급 - 하락 직전의 마지막 양봉. 단, 그 하락이 허용된 봉 수 안에 요구 거리를 지나간 경우 수요 - 상승 직전의 마지막 음봉. 조건은 동일 구간은 바로 그 캔들이며, 전체 또는 몸통만 중에서 선택할 수 있습니다. 숨은 필터도, 평활화도 없습니다. 모든 구간의 기록 구간이 생성된 시점부터 지표는 히스토리를 앞으로 따라가며 무슨 일이 있었는지 기록합니다. 테스트 - 가격이 구간에 진입한 횟수 방어 - 그중 충
FREE
GANN Master는 당일, 당주, 당월의 W. D. 갠(Gann) 제곱근 레벨을 그리고, 매수자와 매도자의 목표가 만나는 구간을 표시합니다. 레벨은 이전 기간의 고가와 저가로 계산되며, 해당 기간 내내 고정되어 있고 다시 그려지지 않습니다. 레벨이 만들어지는 방식 이전 기간의 고가는 TOP 선이 되고 저가는 BOTTOM 선이 됩니다. 지표는 TOP에서 아래로 세 개의 하락 목표(Bears' interest 1, 2, 3)를, BOTTOM에서 위로 세 개의 상승 목표(Bulls' interest 1, 2, 3)를 갠의 제곱근 단계 1/8, 2/8, 3/8로 측정합니다. 갠 계산에는 항상 스케일이 필요합니다. GANN Master는 스케일을 스스로 선택합니다. 모든 스케일을 시도한 뒤 상승 선과 하락 선이 서로 가장 가까워지는 스케일을 사용합니다. 하락 선과 상승 선이 가까운 곳에서 양측의 관심이 만납니다. 지표는 이런 자리를 상호 관심 구간으로 음영 처리합니다. 한 기간에 최대 다
Meravith
Ivan Stefanov
5 (3)
마켓 메이커를 위한 도구. Meravith는 다음과 같은 기능을 제공합니다: 모든 타임프레임을 분석하고 현재 유효한 추세를 표시합니다. 강세와 약세 거래량이 동일한 유동성 구간(거래량 균형 구간)을 강조 표시합니다. 서로 다른 타임프레임의 모든 유동성 레벨을 차트에 직접 표시합니다. 텍스트 기반 시장 분석을 생성하여 참고용으로 제공합니다. 현재 추세를 기반으로 목표가, 지지선 및 손절가를 계산합니다. 거래의 위험 대비 보상 비율(Risk/Reward)을 계산합니다. 계좌 잔고에 따라 포지션 크기를 산출하고 잠재 수익을 추정합니다. 시장에 중대한 변화가 발생할 경우 경고도 제공합니다. 지표의 주요 라인: 강세/약세 거래량 소진 라인 — 목표가로 사용됩니다. 시장 추세를 나타내는 라인. 시장이 강세인지 약세인지에 따라 색상이 변경되며 추세 지지선 역할을 합니다. 색상은 주로 시장 심리를 보여줍니다. 거래량 균형선(Eq). Eq(Volume Equilibrium) 라인은 시스템의 핵심입니
RSI Divergence Pulse는 다이버전스 감지, 다중 타임프레임 분석, 시각 도구를 하나의 가벼운 애플리케이션에 통합한 포괄적인 RSI 지표입니다. Regular 및 Hidden 다이버전스를 자동으로 식별하고, 실시간 Multi-Timeframe RSI 패널을 표시하며, OB/OS 영역을 시각적으로 인식하기 쉽게 채우고, 가격 차트와 RSI 하위 창 모두에 다이버전스 선을 그려주며, Buy/Sell 화살표를 배치하고 실시간 알림을 제공합니다. Features Color-Coded RSI Line RSI 선은 현재 영역에 따라 색상이 변경됩니다. 파랑은 중립 영역(30~70)을 나타냅니다. 초록은 과매수 영역(70 이상)을 나타냅니다. 빨강은 과매도 영역(30 이하)을 나타냅니다. RSI Signal Line RSI의 SMA(기본 기간 9)가 신호선으로 작동합니다. RSI와 신호선의 교차는 타이밍 정보를 추가로 제공합니다. 차이값(Diff)은 대시보드에 표시됩니다. Auto
Imbalance Pro
Ivan Stefanov
5 (4)
이 인디케이터는 선택한 기간 동안 상승과 하락 사이의 불균형을 측정하고 두 지점 사이의 직선을 표시합니다. 상승세가 하락세보다 거래량이 많으면 선이 녹색으로 바뀝니다.  하락세가 더 많으면 빨간색으로 표시됩니다. 이 선은 거래량의 백분율 차이도 표시합니다. 표시기는 별도의 창에 동일한 데이터를 표시합니다. 분할된 볼륨도 볼 수 있습니다. 표시기에는 두 가지 모드가 있습니다. 이를 위해 왼쪽 상단에 버튼이 있습니다,  - 누르지 않으면 시장의 임의의 지점과 현재 가격 사이의 불균형을 측정합니다.  - 버튼을 누르면 선택한 시장의 두 지점 사이의 잔액을 측정할 수 있습니다. 이 인디케이터는 선택한 기간 동안 상승과 하락 사이의 불균형을 측정하고 두 지점 사이의 직선을 표시합니다. 상승세가 하락세보다 거래량이 많으면 선이 녹색으로 바뀝니다.  하락세가 더 많으면 빨간색으로 표시됩니다. 이 선은 거래량의 백분율 차이도 표시합니다. 표시기는 별도의 창에 동일한 데이터를 표
RSI Divergence Pulse is an RSI-based indicator for MetaTrader 4. It detects regular and hidden divergences, draws them on the price chart and in the RSI subwindow, shows RSI values from five timeframes in one panel, and reports the current RSI state in an information panel. Alerts can be sent when a divergence is confirmed. How it works The indicator calculates a standard RSI and a signal line, which is a simple moving average of the RSI. Significant RSI highs and lows are located with a frac
Sense
Ivan Stefanov
5 (2)
SENSE는 선택된 GANN 방식과 프랙탈 계산을 결합한 자동화된 시스템입니다. 이 시스템은 거래를 개시하고 청산할 위치를 알려줍니다. 더 이상 복잡한 계산에 시간을 낭비할 필요가 없습니다. SENSE가 모든 것을 알아서 해줍니다. 인디케이터를 설치하기만 하면 됩니다. 기본 원칙: 가격이 흰색 선 위에 있으면 시장은 강세입니다. 흰색 선 위에서 매수, 아래에서 손절 녹색 선은 상승 목표 가격이 흰색 선 아래에 있으면 시장은 약세입니다. 흰색 선 아래에서 매도, 그 위에 스톱 빨간색 선은 하락 목표 녹색 또는 빨간색 이중선은 강세 구간을 나타냅니다. 왜 센스인가? 수익 목표: SENSE는 자동으로 이익 실현 목표를 설정하여 트레이딩 성공을 극대화할 수 있도록 도와줍니다. 자동 적응: 인디케이터는 모든 차트주기에 대해 자동으로 다시 계산하여 수동으로 조정할 필요 없이 정확하고 신뢰할 수 있는 신호를 제공합니다. 스캘핑에도 좋습니다. 데모를 확인해 보세요!
Two Snakes
Ivan Stefanov
5 (1)
2 SNAKES  is a first class scalping system. As the entries are quite precise, you are likely to become addicted to this system very quickly.  You have 2 snakes. When you see a candle above or below them that does not touch them - that is your scalping signal. Then buy or sell at the green line or close. If you use a larger time frame, scalping can become trend following. The snakes are calculated precisely in relation to the current state of the market. They ARE NOT moving averages.  You decide
GANN Master
Ivan Stefanov
5 (1)
GANN Master는 당일, 당주, 당월의 W. D. 갠(Gann) 제곱근 레벨을 그리고, 매수자와 매도자의 목표가 만나는 구간을 표시합니다. 레벨은 이전 기간의 고가와 저가로 계산되며, 해당 기간 내내 고정되어 있고 다시 그려지지 않습니다. 레벨이 만들어지는 방식 이전 기간의 고가는 TOP 선이 되고 저가는 BOTTOM 선이 됩니다. 지표는 TOP에서 아래로 세 개의 하락 목표(Bears' interest 1, 2, 3)를, BOTTOM에서 위로 세 개의 상승 목표(Bulls' interest 1, 2, 3)를 갠의 제곱근 단계 1/8, 2/8, 3/8로 측정합니다. 갠 계산에는 항상 스케일이 필요합니다. GANN Master는 스케일을 스스로 선택합니다. 모든 스케일을 시도한 뒤 상승 선과 하락 선이 서로 가장 가까워지는 스케일을 사용합니다. 하락 선과 상승 선이 가까운 곳에서 양측의 관심이 만납니다. 지표는 이런 자리를 상호 관심 구간으로 음영 처리합니다. 한 기간에 최대 다
Fifty Pro
Ivan Stefanov
5 (1)
FIFTY 인디케이터는 이제 자동화된 버전으로 제공되어 수동으로 레벨을 그릴 필요가 없습니다. 이 버전은 일간, 주간, 월간 및 연간 레벨을 자동으로 차트에 표시하여 정확성을 보장하고 시간을 절약합니다. 또한, 이러한 레벨의 표시 여부를 전환할 수 있는 버튼이 제공되어 완전한 사용자 맞춤 설정이 가능합니다. 수동 조작을 선호하는 사용자들을 위해 무료 버전도 계속 제공되며, 완전한 기능을 갖추고 있습니다. 트레이더는 자신의 거래 스타일에 맞춰 수동 또는 자동 도구를 선택할 수 있습니다. 가장 논리적인 인디케이터 중 하나. 높은 신뢰성. FIFTY 인디케이터는 이제 자동화된 버전으로 제공되어 수동으로 레벨을 그릴 필요가 없습니다. 이 버전은 일간, 주간, 월간 및 연간 레벨을 자동으로 차트에 표시하여 정확성을 보장하고 시간을 절약합니다. 또한, 이러한 레벨의 표시 여부를 전환할 수 있는 버튼이 제공되어 완전한 사용자 맞춤 설정이 가능합니다. 수동 조작을 선호하는 사용자들을 위해 무료 버
Fifty Pro MT5
Ivan Stefanov
가격만을 기준으로 레벨을 계산하는 몇 안 되는 인디케이터 중 하나입니다. 이 인디케이터는 시간 프레임, 추세 또는 시장 사이클의 영향을 받지 않습니다. 지금까지 만들어진 것 중 가장 논리적인 인디케이터 중 하나입니다. FIFTY 인디케이터는 이제 자동화 버전으로 제공되어 수동으로 레벨을 그릴 필요가 없습니다. 이 버전은 일간, 주간, 월간, 연간 레벨을 자동으로 차트에 표시하여 정확성을 높이고 시간을 절약해 줍니다. 또한, 이러한 레벨의 표시 여부를 전환할 수 있는 버튼이 제공되어 완전한 사용자 맞춤 설정이 가능합니다. 수동 방식을 선호하는 분들을 위해 무료 버전도 여전히 제공되며, 완전히 작동합니다. 사용자들은 자신의 트레이딩 스타일에 따라 수동 또는 자동 도구를 선택할 수 있습니다. 매우 신뢰할 수 있으며 강력히 추천드립니다! 수동 버전의 FIFTY 인디케이터를 지금 요청해 보세요!
Speculator MT5
Ivan Stefanov
SPEKULATOR는 주요 지원 영역과 시장 방향을 식별하는 데 도움이 되는 수동 거래 시스템 및 지표입니다. 간단한 전략과 숨겨진 지혜로 시장을 마스터하세요. 차트에서 원하는 최고점(TOP)과 최저점(BOTTOM)을 선택하면 지표는 다음을 그립니다: 당신의 트렌드를 위한 지원 영역. 상승 추세에서는 녹색 영역이, 하락 추세에서는 빨간색 영역이 나타납니다. 지원 영역의 민감도는 지표 설정에서 조정할 수 있습니다. 이 영역은 선택한 추세를 기반으로 지원이 나타날 가능성이 있는 위치를 나타냅니다. 높은 편차선과 낮은 편차선 W.D. Gann의 9의 제곱에 따라 계산된 각도선 거래에 진입할 때: 높은 편차선이 위로 돌파되면 롱 포지션을 취합니다. 낮은 편차선이 아래로 돌파되면 숏 포지션을 취합니다. 시장이 편차선 사이에 있을 경우, 해당 구간 내에서 매수와 매도를 하며 지원 영역을 존중합니다. Gann의 각도선은 이익 실현 구간으로 가이드를 제공합니다. 핵심 수준은 360도 선입니다: 가
Naturu
Ivan Stefanov
5 (1)
“Naturu”는 자연의 대칭성을 알고리즘으로 활용하는 수동 인디케이터입니다. 간단한 전략과 숨겨진 지혜로 시장을 제패하세요! 인디케이터를 로드하면 위(Top)와 아래(Bottom) 두 개의 라인이 표시됩니다. 라인을 한 번 클릭해 활성화한 후, 이동하고 싶은 캔들 위를 클릭하면 그 위치로 이동합니다. 사용자가 고점과 저점을 지정하면, 인디케이터가 자동으로 계산합니다: 마젠타 색 영역: 상승(불) 세력과 하락(곰) 세력의 관심이 가장 가까워져서 지지/저항이 될 가능성이 큰 구간 회색 영역: 다음 관심 구간 아쿠아 색 실선: 상승 세력의 목표가 골드 색 실선: 하락 세력의 목표가 수동 인디케이터는 실시간 시장 상황과 개인의 직관에 따라 레벨을 자유롭게 조정할 수 있는 완전한 제어력과 유연성을 제공합니다. 직접 가격 움직임을 분석함으로써 지지·저항과 패턴 형성을 본질적으로 이해할 수 있습니다. 인간의 판단을 통해 자동 시스템이 놓치거나 오해하기 쉬운 ‘노이즈’를 걸러내어 잘못된 신호를
Chart AI Assistant – 클릭 한 번으로 실시간 차트를 AI가 분석 AI는 여러분이 보는 것과 똑같이 차트 화면을 봅니다. 화면의 캔들, 가격 레벨, 지표를 보고 읽은 다음, 지금 무슨 일이 일어나고 있는지 알려 줍니다. Chart AI Assistant는 경험 많은 트레이더처럼 차트를 분석하고 무엇을 보고 있는지 알려줍니다: 구조, 구간, 유동성, 패턴, 거래량, 그리고 다음에 예상되는 움직임. 모든 종목과 모든 시간 단위에서 작동합니다. ANALYZE를 누르면 답변이 사용자의 언어로 차트에 표시됩니다. 이 어시스턴트는 거래를 하지 않으며 포지션을 진입하거나 청산하지도 않습니다. 두 번째 의견을 제공할 뿐이며, 모든 결정은 사용자의 몫입니다. 사용 방법 아무 차트에나 Expert Advisor를 적용합니다. 궁금한 질문을 체크합니다. ANALYZE를 누릅니다. 답변이 차트 옆 패널에 표시되고, 주요 가격대가 차트에 그려집니다. 원하는 것만 질문하세요 질문 버튼은 아홉
Gann Gold Scalp Gann Gold Scalp는 MetaTrader 5용 금 스캘핑 지표입니다. 일, 주, 월의 갠 레벨에서 어디서 진입하고, 어디서 이익을 실현하며, 손절가가 어디인지 보여줍니다. 명확한 BUY 및 SELL 신호, 두 개의 진입점, TARGET 1과 TARGET 2, STOP, 차트 알림과 푸시 알림. 리페인트 없음. M5의 XAUUSD용으로 만들어졌으며, 외환, 지수, 주식, 비트코인 같은 암호화폐에서도 모든 시간 프레임에서 똑같이 작동합니다. 어디서 진입하고, 어디서 청산할까 지표는 갠 레벨 사이에 매수자와 매도자가 만나는 배틀 존을 그립니다. 한눈에 볼 수 있는 지지 및 저항 구간입니다. 가격에 가장 가까운 존이 가장 밝고, 멀리 있는 존일수록 흐려집니다. 가격이 한 존에서 다음 존으로 돌파하면 신호가 나타납니다: BUY 1 과 BUY 2 (또는 SELL 1 과 SELL 2 ): 두 개의 진입 위치. TARGET 1 과 TARGET 2 : 두 개의
필터:
John
133
John 2026.07.06 23:12 

i started with this but after looking through Ivan's other indicators i changed to Meravith .. (Ivan gave me a huge discount so i could upgrade) this developer is engaging and helpful have a chat with him and see what tools he can help you with

Ivan Stefanov
9673
개발자의 답변 Ivan Stefanov 2026.07.09 05:13
Thank you, John! Enigmera was my initial model and it is still very good. Meravith comes after that. It is significant upgrade!
onermentes
19
onermentes 2025.06.17 18:57 

Yaklaşık olarak 10 yıldır forex piyasasında işlem yapmaktayım. Pek çok indikatör taradım ve aldım. Neredeyse bir çoğu çöptü diyebilirim. Enigmera indikatörden ziyade bir starteji yapmamı sağlamakta. Girmiş olduğum pozisyonlarda korkumu yenmeme katkı sağladı. Daha önce erken kapatmak zorunda olduğum pozisyonlarda bearish veya bullish hedefler neredeyse tam anlamıyla doğru çalışmakta ve buna bağlı olarak pozisyonlarımı daha uzun tutabilme güvenini sağladı. Özellikle support line çok ciddi olarak destek veya direnç olarak çalışmakta. Para yapmanıza kesinlikle katkı sağlayacaktır. Ivan teşekkür ederim.

TANJU2690
734
TANJU2690 2025.03.05 13:37 

I have never and ever seen any system like Enıgmera. What ever you want, you can find on it. İt is incredible system. And Cretor of aenıgmera, Mr.Ivan is more and more helpfull to understant of logıc Enigmera. Fistly, I want sent all thankfull to Ivan because he teach me Enıgmera Logıc and also share this marvelous product with market

smso9466eiou
233
smso9466eiou 2025.02.23 15:38 

a very good indicator that composes all in one, entry, exit and reverse. Great!

Ivan Stefanov
9673
개발자의 답변 Ivan Stefanov 2025.02.23 18:12
Thank you! Wishing you profits!
Rutt Tungkiratichai
2898
Rutt Tungkiratichai 2025.02.01 00:11 

This is very good and accurate indicator.

Ivan Stefanov
9673
개발자의 답변 Ivan Stefanov 2025.02.01 11:30
Thank you for the good words! Brgds / Ivan
Osazeme Usen
694
Osazeme Usen 2024.12.31 12:38 

This is probably the best indicator I have seen in marketplace. Fantastic analysis with phenomenal success rates.

Update: Not great for direction, but fantastic for TP and SL.

Ivan Stefanov
9673
개발자의 답변 Ivan Stefanov 2025.01.02 16:45
Osazeme Usen 2024.12.31 12:38 # EN
This is probably the best indicator I have seen in marketplace. Fantastic analysis with phenomenal success rates. Thank you for the good words! Brgds/Ivan
vincenzo1964
1231
vincenzo1964 2024.07.11 15:59 

Assolutamente straordinario a cominciare da chi l'ha ideato Ivan, Sono assolutamete felice dell'affito/prova fatto, Enigmera è sorprendente, ti accompagna sempre sul lato giusto della tendenza sino alla fine del percorso. Se poi parliamo del dott. Ivan e della sua disponbilità, se potessi postare gli screenshot e la guida passo passo che mi ha concesso, è commovente e sorprendente. Se volete fare buon trading con giudizio e responsabilità potete tranquillamente perdere qualche giorno del vostro tempo a capire la logica ed il ragionamento che c'è dietro enigmera, solo così sarete sempre dal lato giusto del trend sino alla fine, sopratutto quando ci sono le news ed enigmera già vi sta indicando i livelli di tp da raggiungere. Proprio oggi ero già lon su eurusd e sell su usdchf ed entrambe dopo le notizie chiuse in tp. Consiglio anche l'indicatore Speed, leggetene l'utilizzo, la forza e ciò che vi può indicare, io ci sto lavorando sodo seguito da ivan perchè l'unione di enigmera e speed è devastante, alla fine dell'affitto acquisterò engmera mentre affitterò mensilmente speed (il costo è di 30.00€ mentre l'acquisto è di 3000€), ma il suo potenziale per il trend followhing e immenso, saluti e buon trading a tutti, grazie Ivan...

Irfan
1797
Irfan 2024.06.21 13:44 

사용자가 평가에 대한 코멘트를 남기지 않았습니다

Ivan Stefanov
9673
개발자의 답변 Ivan Stefanov 2025.01.02 16:46
Irfan 2024.06.21 13:44 # EN
Enigmera gives you an entirely different way of looking at the market. It does not look into the past, what has happened in the past stays in the past it gives you a picture of what is going on in the market right now and gives you logical understanding for trading. The author is so confident about his product the he gave me a full version of the indicator so that I could try it for a week before I decided to buy it. Ivan spent a lot of time chatting with me, educating me how to use the indicator. He is very quick and replies to your questions. I have already seen good results with this indicator and it has increased my confidence. Thank you for the good words, Irfan!
Sajid Iqubal
186
Sajid Iqubal 2024.06.08 21:59 

Enigmera is an exceptional trading indicator that has greatly improved my trading performance. Ivan Stefano offers the best support and guidance, always going above and beyond like an elder brother to me. His guidance and the effectiveness of Enigmera make a winning combination. I highly recommend using Enigmera.

eman11
1820
eman11 2023.11.22 20:29 

사용자가 평가에 대한 코멘트를 남기지 않았습니다

Ivan Stefanov
9673
개발자의 답변 Ivan Stefanov 2025.01.02 16:47
eman11 2023.11.22 20:29 # EN
I was an institutional trader for a decade and rarely write reviews or spend more then 50 or a 100 on any indicator as my trading is well established, but always open to something interesting and new. The author is an intelligent and real trader , per many chats with him, and this indicator compliments well existing trading as is from a unique perpective. The price is not cheap , but it it is a legit and unique system, is as decribed, which can be put to good use particulalry with experienced traders who may best integrate multiple styles and ideas successfully. Great work Ivan. Thank you for the good words, Eman11 / Brgds / Ivan
ebel
1221
ebel 2023.11.22 14:41 

This indicator is undoubtedly expensive but I believe it to be the Ferrari of indicators and the only one you will ever need. The video in the overview is self explanatory, take the time to find the setups as described and the R:R can be extremely good. I have only been using the indicator for a week but have found several very profitable trades and feel confident that I can make back more than sufficient each month to cover my 6 monthly rental. The author is extremely responsive and helpful and is starting a telegram group so that we can share prospective setups. I believe the indicator is difficult to get to work in Strategy Tester but the author is open to free trials which demonstrates his trust in the product. I can't post images here but I will post a trade I made this morning in the comments. I can't promise it is the perfect setup as I am still learning but just this one trade covered my monthly rental cost. IMPORTANT - do not try to change to a lower timeframe while the indicator is loaded. The code is incredibly complex and trying to recalculate everything on a lower tf over a significant period will freeze your MT4 installation. You will need to delete the indicator from your MT4, force a shut down, restart and re-install. Once you understand the complexity it is not a problem, just open another chart on a lower tf or delete the indicator, change the tf and put it back on.

UPDATE 23/11

I have just seen that the author has been debarred from selling! I have just paid for 6 months rental and this is a good indicator that is making me money. What to I do after 6 months if I can't renew? And why has this happened, the author is very courteous and helpful.

리뷰 답변