Cobra Levels

Introducing

Cobra Levels

Watch the Tutorial video of backtest and accuracy : here

This strategy is based on the concept that prices will revert to their mean or average value over time.

  • Identify the mean price: Calculate the levels e.g. U4 U5 or D4 D5
  • Wait for the price to move away from the mean (Middle Line) before taking action.
  • Buy and sell signals:
    • Buy: When the price falls below the lower threshold.
    • Sell: When the price rises above the upper threshold.


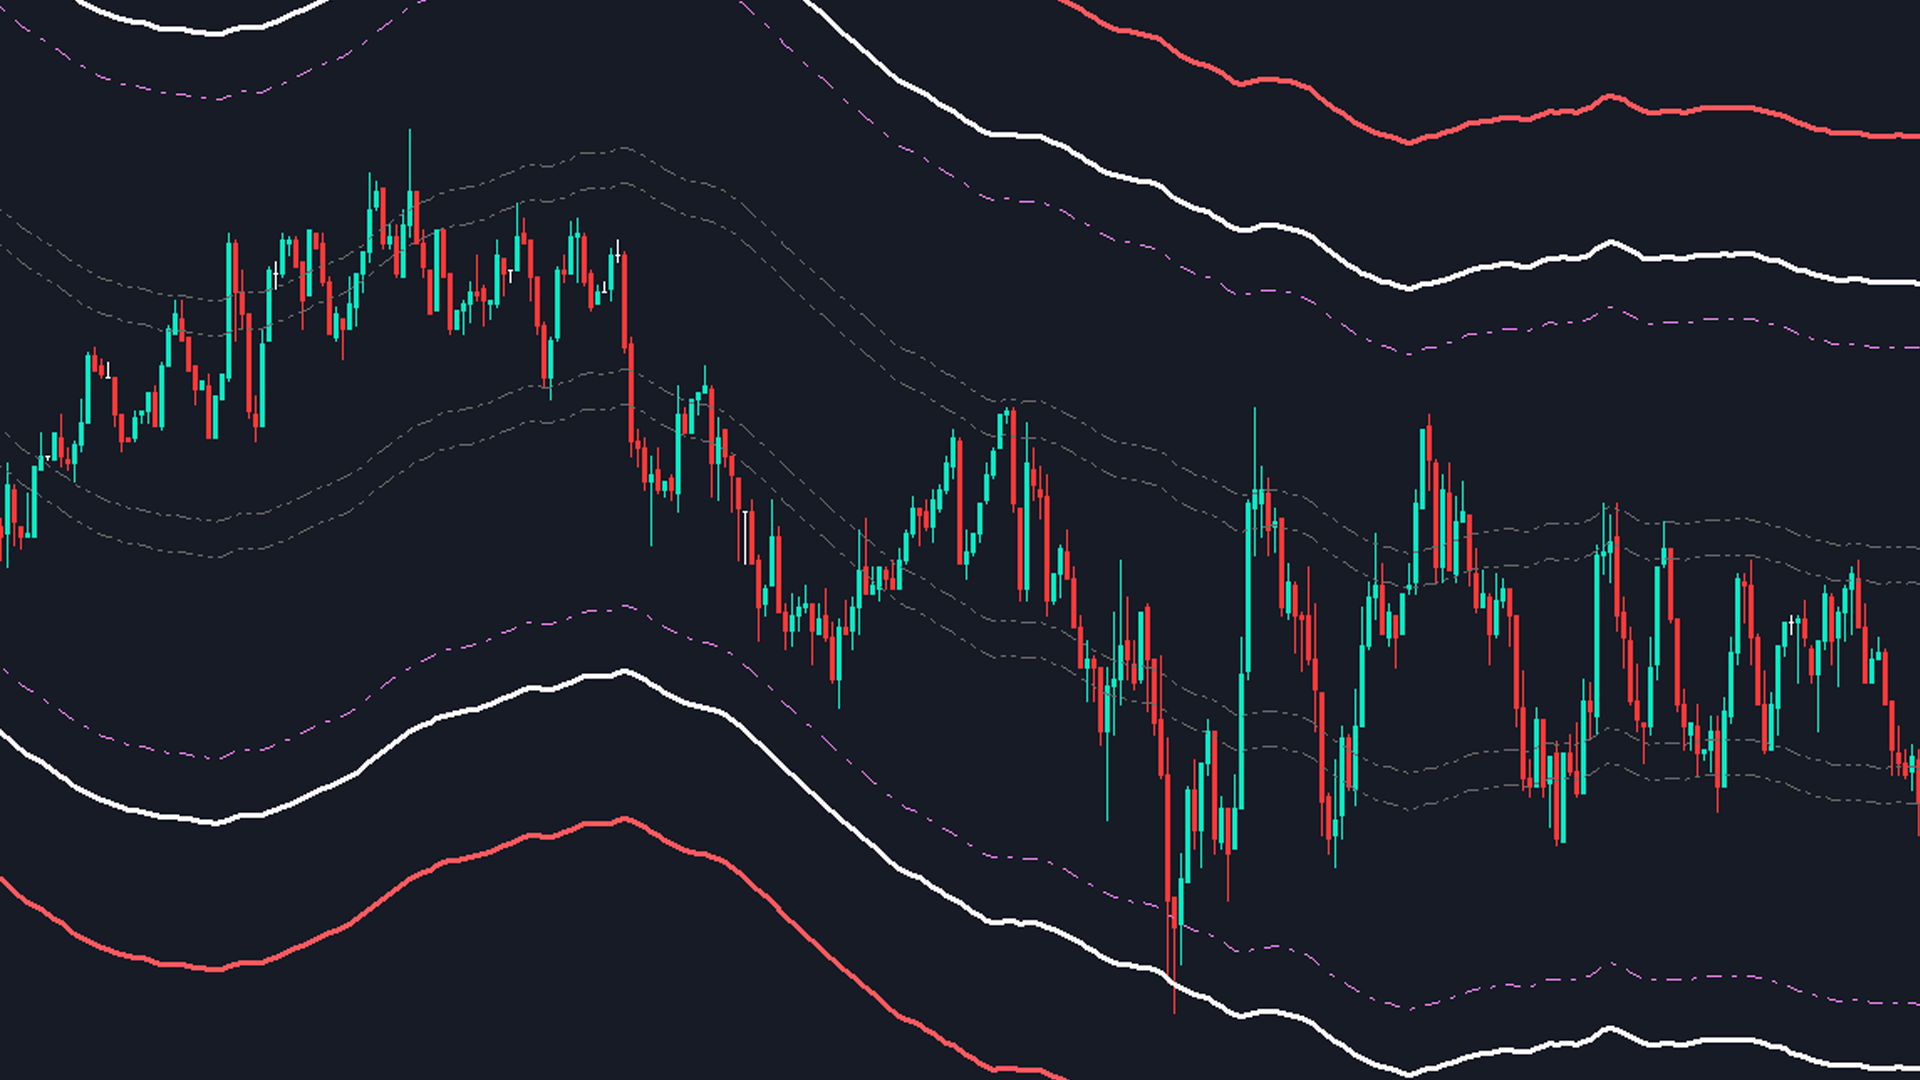
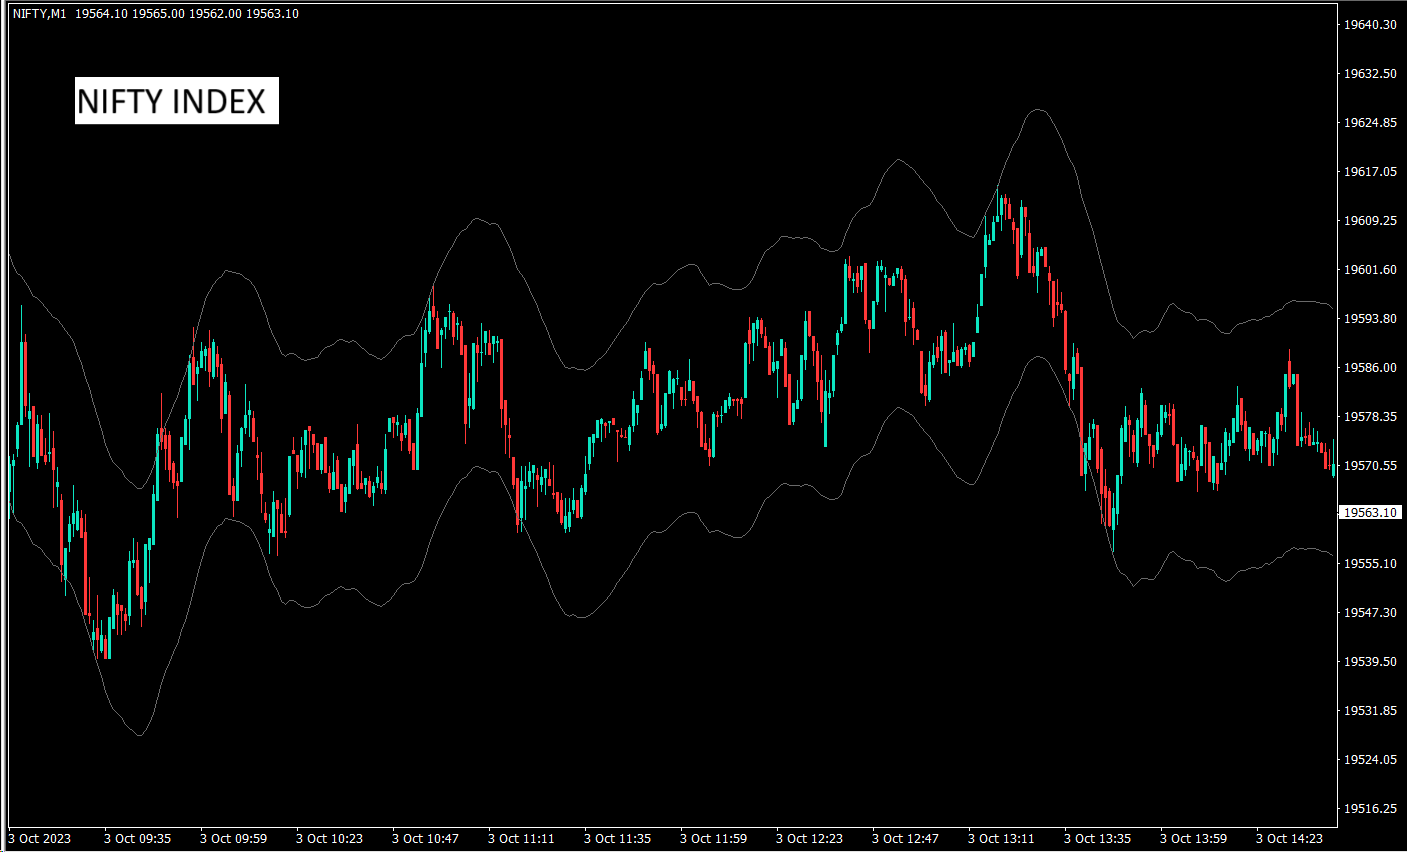
These are 6 sets of levels with two frequency modes which works on universal market including forex, crypto, commodity, nifty and banknifty and other markets. They are published after best research on financial instruments. The purpose of these levels are to trade reversal crash and boom, use them to watch for overbought and oversold market condition and understand the market cycle of any symbol

The upper levels are called U1 to U5 and the lower levels are called D1 to D5
Market may drive in either internal channels upto U3 or D3 in normal condition or external channels U4 to U5 or D4 to D5 in volatile condition. When price reaches U3 U4 U5 or D3 D4 D5, the chances of reversal are very high and a trader should wait for a closing of a candlestick to confirm the entry and may trade with valid risk management.


This indicator offers you to shift the levels distance by customization options in indicator settings. A user can customize the levels by adding + or - points from the adjustment setting.

1. They are working on Timeframe : M1, M3, M5, M15, H1 and H4 only.
2. Suitable for intraday , swing and positional trading methods
3. Help finding in best overbought and oversold turning points based on research as compared to any other indicator
4. Dynamic Levels : Level value changes as per time every minute but when price pass the criteria to reach these levels in any condition, a cycle is followed up and reversal can be seen.
5. Include Alerts ad Push Notification


For more info regarding trading strategy, You can contact me via DM.

Recommended products
Free automatic Fibonacci is an indicator that automatically plots a Fibonacci retracement based on the number of bars you select on the BarsToScan setting in the indicator. The Fibonacci is automatically updated in real time as new highest and lowest values appears amongst the selected bars. You can select which level values to be displayed in the indicator settings. You can also select the color of the levels thus enabling the trader to be able to attach the indicator several times with differe
FREE
Blue Orbit
Farel
4.38 (8)
Blue Orbit Price today is 190 . When 10 copies are sold, the new price will be 249 . Don’t miss the early slot. Currently sold: 9 . Step into a new era of automated trading with Blue Orbit —an EA engineered to interpret the natural “flow dynamics” of the market. Designed for precision, this system focuses on reading real-time momentum shifts, detecting zones of exhaustion, and executing entries where trend exhaustion meets reversal strength. It's a non-linear, fluid approach—far beyond rigid me
Follow The Line MT5
Oliver Gideon Amofa Appiah
4.6 (35)
This indicator obeys the popular maxim that: "THE TREND IS YOUR FRIEND" It paints a GREEN line for BUY and also paints a RED line for SELL. (you can change the colors). It gives alarms and alerts of all kinds. IT DOES NOT REPAINT and can be used for all currency pairs and timeframes. Yes, as easy and simple as that. Even a newbie can use it to make great and reliable trades. NB: For best results, get my other premium indicators for more powerful and reliable signals. Get them here: https://www.m
FREE
PROMETHEUS TECHNICAN VERSION Free | By THE SONS A gift from The Sons — no strings, no trial, no expiry. Every trader deserves access to professional-grade market intelligence. That belief is why Prometheus Technical Version exists, and why it costs nothing. Consider it our handshake to the trading community. What You're Getting This is not a simplified tool dressed up as a gift. Prometheus Technican Version is a fully built, institutional-quality technical analysis indicator running a dual-model
FREE
Reversal Composite Candles
MetaQuotes Ltd.
3.67 (15)
The idea of the system is to indentify the reversal patterns using the calculation of the composite candle. The reversal patterns is similar to the "Hammer" and "Hanging Man" patterns in Japanese candlestick analysis. But it uses the composite candle instead the single candle and doesn't need the small body of the composite candle to confirm the reversal. Input parameters: Range - maximal number of bars, used in the calculation of the composite candle. Minimum - minimal size of the composite can
FREE
Caicai L&S Yield Histogram Important Notice: This indicator is an integral tool of the automated EA Caicai Long and Short Pair Trading . This indicator visually displays the percentage deviation (Yield %) of a pair's current spread relative to its own historical mean. It is an excellent tool for quickly visualizing the gross financial potential of a market distortion in Long & Short operations. Main Features: Percentage Visualization: Understand the size of the distortion in palpable percentage
Donchian Breakout And Rsi
Mattia Impicciatore
4.5 (2)
General Description This indicator is an enhanced version of the classic Donchian Channel , upgraded with practical trading functions. In addition to the standard three lines (high, low, and middle), the system detects breakouts and displays them visually with arrows on the chart, showing only the line opposite to the current trend direction for a cleaner view. The indicator includes: Visual signals : colored arrows on breakout Automatic notifications : popup, push, and email RSI filter : to val
FREE
WaveTrend Arrow LIGHT is a clean and lightweight WaveTrend-based arrow indicator for MetaTrader 5. This free version focuses purely on visual buy & sell arrows , generated from WaveTrend WT1 and WT2 crossings, without alerts or notifications. It is designed for traders who prefer a simple, non-repainting arrow indicator and for developers who want a stable signal source for EA integration . Features: Buy & Sell arrows based on WaveTrend crossing Non-repainting signals (closed bar option) Clean a
FREE
Mitimom
Danil Poletavkin
The indicator is based on Robert Miner's methodology described in his book "High probability trading strategies" and displays signals along with momentum of 2 timeframes. A Stochastic oscillator is used as a momentum indicator. The settings speak for themselves period_1 is the current timeframe, 'current' period_2 is indicated - the senior timeframe is 4 or 5 times larger than the current one. For example, if the current one is 5 minutes, then the older one will be 20 minutes The rest of the s
FREE
Intraday Momentum Index IMI
Danilo Hudson Couto Monteiro
Indicador IMI (Intraday Momentum Index) Descrição O Indicador IMI (Intraday Momentum Index) é uma poderosa ferramenta de análise técnica desenvolvida para identificar a força do momentum e potenciais reversões no mercado. Este indicador quantifica a relação entre ganhos e perdas durante um período específico, ajudando traders a avaliar a dinâmica atual do mercado. Características Oscila entre 0 e 100, facilitando a interpretação das condições de mercado Identifica com precisão áreas de sobrecomp
FREE
ATR Plus
Ivan Pochta
5 (1)
ATR Plus is an enhanced version of the classic ATR that shows not just volatility itself, but the directional energy of the market . The indicator converts ATR into a normalized oscillator (0–100), allowing you to clearly see: who dominates the market — buyers or sellers when a trend begins when a trend loses strength when the market shifts into a range where volatility reaches exhaustion zones ATR Plus is perfect for momentum, trend-following, breakout and volatility-based systems. How ATR Plus
FREE
Spike Catch Pro
Amani Fungo
4.14 (7)
Spike Catch Pro 22:03 release updates Advanced engine for searching trade entries in all Boom and Crash pairs (300,500 and 1000) Programmed strategies improvements Mx_Spikes (to combine Mxd,Mxc and Mxe), Tx_Spikes,   RegularSpikes,   Litho_System,   Dx_System,   Md_System,   MaCross,   Omx_Entry(OP),  Atx1_Spikes(OP),   Oxc_Retracement (AT),M_PullBack(AT) we have added an arrow on strategy identification, this will help also in the visual manual backtesting of the included strategies and see ho
FREE
Are you tired of drawing trendlines every time you're analyzing charts? Or perhaps you would like more consistency in your technical analysis. Then this is for you. This indicator will draw trend lines automatically when dropped on a chart. How it works Works similar to standard deviation channel found on mt4 and mt5. It has 2 parameters: 1. Starting Bar 2. Number of bars for calculation The   starting bar   is the bar which drawing of the trend lines will begin, while the   number of bars for c
FREE
SPECIAL LAUNCH OFFER: $30 (1-Month Rent) Limited time offer to build our community and gather feedback! AmbM GOLD Institutional Scalper A high-precision M5 algorithm for XAUUSD (Gold) , engineered to trade exclusively at Institutional Liquidity Levels ($5/$10 psychological marks). PERFORMANCE DATA (BUY ONLY) • Win Rate: 87.09%. • Safe Growth: +$4,113 profit on $10k (13.75% Max Drawdown). • Extreme Stress Test: Successfully generated +$22,997 in a 5-year stress test (2020-2026), proving
Super Trend eu
Emin Ulucanli
4.83 (6)
SUPERTREND; It is a trend following indicator based on the SuperTrend ATR created by Olivier Seban. It can be used to detect changes in trend direction and locate stops. When the price falls below the indicator curve, it turns red and indicates a downtrend. Conversely, when the price moves above the curve, the indicator turns green, indicating an uptrend. Like other indicators, it works well on SuperTrend when used in conjunction with other indicators such as MACD, parabolik SAR, Bollinger Band
FREE
Bollinger Bands B
Flavio Javier Jarabeck
4.25 (4)
John Bollinger created this indicator in 2010 as a way to read the original indicator (Bollinger Bands) in a more "technical" way, shown as an oscillator. The typical range of the Bollinger Bands %B is 0 - 0.5 - 1.0, where "0" represents the lower band, the "0.5" the middle band, and "1" the upper band. The line on the indicator represents the Closing prices. As simple as that. SETTINGS Bollinger Bands period of analysis Standard Deviation multiplier Shift Price type to be analyzed If you like
FREE
Donchian Pro
Paulo Henrique Faquineli Garcia
4.75 (4)
The Donchian Channel Channels are among the most popular tools of technical analysis, as they visually convey to the analyst the limits within which most price movement tends to occur. Channel users know that valuable information can be obtained at any time, whether prices are in the central region of a band or close to one of the border lines. One of the best known techniques to explore these concepts is Bollinger Bands. However, John Bollinger was not the only one to research the application
FREE
High Low Open Close
Alexandre Borela
4.98 (44)
If you like this project, leave a 5 star review. This indicator draws the open, high, low and closing prices for the specified period and it can be adjusted for a specific timezone. These are important levels looked by many institutional and professional traders and can be useful for you to know the places where they might be more active. The available periods are: Previous Day. Previous Week. Previous Month. Previous Quarter. Previous year. Or: Current Day. Current Week. Current Month. Current
FREE
KT Renko Patterns MT5
KEENBASE SOFTWARE SOLUTIONS
KT Renko Patterns scans the Renko chart brick by brick to find some famous chart patterns that are frequently used by traders across the various financial markets. Compared to the time-based charts, patterns based trading is easier and more evident on Renko charts due to their uncluttered appearance. KT Renko Patterns features multiple Renko patterns, and many of these patterns are extensively explained in the book titled Profitable Trading with Renko Charts by Prashant Shah. A 100% automated
VFI Quantum
Nikita Berdnikov
5 (1)
Introducing VFI (Volume Flow Indicator) – a trading indicator that analyzes the relationship between volume and price movement to identify key trading opportunities. The indicator displays the strength and direction of volume flow, providing clear signals about potential entry and exit points. Signals are formed based on zero line crossovers, crossovers between the VFI line and its exponential moving average (EMA), and when the indicator exits overbought and oversold zones. Attention! This stra
FREE
WAPV Weis Wave Chart Forex
Eduardo Da Costa Custodio Santos
The Weis Wave Chart Forex for MT5 is a Price and Volume indicator. The Price and Volume reading was widely disseminated through Richard Demille Wyckoff based on the three laws created by him: Supply and Demand, Cause and Effect and Effort vs. Result. In 1900 R.Wyckoff already used the wave chart in his analyses. Many years later, around 1990, David Weis Automated R. Wyckoff's wave chart and today we bring you the evolution of David Weis' wave chart. It shows the amount of Volume and the amount o
FlatBreakout MT5
Aleksei Vorontsov
FlatBreakout MT5 (Free Version) Flat Range Detector and Breakout Panel for MT5 — GBPUSD Only FlatBreakout MT5   is the free version of the professional FlatBreakoutPro MT5 indicator, specially designed for flat (range) detection and breakout signals on the   GBPUSD   pair only. Perfect for traders who want to experience the unique fractal logic of FlatBreakout MT5 and test breakout signals on a live market without limitations. Who Is This Product For? For traders who prefer to trade breakout of
FREE
This EA finds Fair Value Liquidity (FVL) on the chart, tracks when they get mitigated , and then looks for an inversion signal (price “fails” through the zone). When that inversion happens, it places a trade in the opposite direction of the original Liquidity gap (an Inverse FVG approach). It also lets you control when it trades using market sessions , and it can auto-close positions at New York open (all positions or profitable-only). Key advantages Clear, rule-based entries (no guessing): trad
FREE
MACD Enhanced
Nikita Berdnikov
5 (3)
Introducing the MACD  Enhanced – an advanced MACD (Moving Average Convergence Divergence) indicator that provides traders with extended capabilities for trend and momentum analysis in financial markets. The indicator uses the difference between the fast and slow exponential moving averages to determine momentum, direction, and strength of the trend, creating clear visual signals for potential entry and exit points. Attention! To achieve the best results, it is recommended to adapt the indicator
FREE
VolumeBasedColorsBars
Henrique Magalhaes Lopes
VolumeBasedColorsBars — Free Powerful Volume Analysis for All Traders Unlock the hidden story behind every price bar! VolumeBasedColorsBars is a professional-grade, 100% FREE indicator that colorizes your chart candles based on real, adaptive volume analysis. Instantly spot surges in market activity, identify exhaustion, and catch the moves that matter. This indicator gives you:    • Dynamic color-coded bars for instant volume context    • Adaptive thresholds based on historical, session-awar
FREE
AUTO FIBONACCI MULTI-TIMEFRAME TOOLKIT Technical analysis tool that automatically draws Fibonacci levels for 4H, Daily, Weekly, and Monthly sessions. AUTOMATIC FIBONACCI RETRACEMENTS (7 CLASSIC LEVELS): - 0.0% (Previous session Low - support level) - 23.6% (Fibonacci Golden Ratio - early entry level) - 38.2% (Strong retracement level) - 50.0% (Key pivot level highlighted in YELLOW - market equilibrium) - 61.8% (Main Golden Ratio - critical decision level) - 78.6% (Deep retracement level) - 100.0
Elliott Wave Trend was designed for the scientific wave counting. This tool focuses to get rid of the vagueness of the classic Elliott Wave Counting using the guideline from the template and pattern approach. In doing so, firstly Elliott Wave Trend offers the template for your wave counting. Secondly, it offers Wave Structural Score to assist to identify accurate wave formation. It offers both impulse wave Structural Score and corrective wave Structure Score. Structural Score is the rating to sh
1. Overview The Scalping PullBack Signal indicator is a powerful technical analysis tool designed to help traders identify scalping opportunities based on potential pullback and reversal signals. This tool is particularly useful on lower timeframes (below 15 minutes) but can also be applied on higher timeframes for longer-term trades. This indicator integrates several key analytical components, providing a comprehensive view of trends and potential entry/exit points, helping you make quick and e
FREE
FX Clock
Abderrahmane Benali
FXClock – Professional Clock Indicator for Traders Please leave a 5 star rating if you like this free tool! Thank you so much :) The FXClock indicator is a practical and simple tool that displays time directly on your trading platform, allowing you to track multiple key pieces of information at the same time. It is specially designed to help traders synchronize their trading with market hours and global sessions. Key Features: Displays the broker server time with precision. Displays your local c
FREE
LT Donchian Channel
Thiago Duarte
4.86 (7)
Donchian Channel is an indicator created by Richard Donchian. It is formed by taking the highest high and the lowest low of the last specified period in candles. The area between high and low is the channel for the chosen period. Its configuration is simple. It is possible to have the average between the upper and lower lines, plus you have alerts when price hits one side. If you have any questions or find any bugs, please contact me. Enjoy!
FREE
Buyers of this product also purchase
ARIPoint
Temirlan Kdyrkhan
ARIPoint is a powerful trading companion designed to generate high-probability entry signals with dynamic TP/SL/DP levels based on volatility. Built-in performance tracking shows win/loss stats, PP1/PP2 hits, and success rates all updated live. Key Features: Buy/Sell signals with adaptive volatility bands Real-time TP/SL/DP levels based on ATR Built-in MA Filter with optional ATR/StdDev volatility Performance stats panel (Success, Profit/Loss, PP1/PP2) Alerts via popup, sound, push, or email Cu
SuperScalp Pro
Van Minh Nguyen
4.57 (21)
SuperScalp Pro – Advanced Multi-Filter Scalping Indicator System SuperScalp Pro is an advanced scalping indicator that combines the classic Supertrend with multiple intelligent confirmation filters to help identify trading opportunities. It works efficiently across multiple timeframes from M1 to H4, with optimized performance on XAUUSD, BTCUSD, and major Forex pairs. The indicator provides clear Buy and Sell signals, along with automatically calculated entry price, stop loss, and take profit lev
Divergence Bomber
Ihor Otkydach
4.9 (87)
Each buyer of this indicator also receives the following for free: The custom utility "Bomber Utility", which automatically manages every trade, sets Stop Loss and Take Profit levels, and closes trades according to the rules of this strategy Set files for configuring the indicator for various assets Set files for configuring Bomber Utility in the following modes: "Minimum Risk", "Balanced Risk", and "Wait-and-See Strategy" A step-by-step video manual to help you quickly install, configure, and s
Entry In The Zone and SMC Multi Timeframe is a real-time 2-in-1 market analysis tool that combines market structure analysis and a No Repaint BUY / SELL signal system into a single indicator, built on Smart Money Concepts (SMC) — a widely adopted framework used by professional traders to understand market structure. This indicator helps you see the market more clearly, make decisions based on structure rather than guesswork, and focus on high-probability zones where price is more likely to react
Power Candles MT5
Daniel Stein
4.75 (8)
Power Candles V3 - The First Self-Optimizing Strength Indicator Power Candles V3 turns strength analysis into an actionable trading system. Instead of just coloring your chart by market strength, it now runs a live auto-optimization in the background and hands you the best Stop Loss, Take Profit and signal threshold for your symbol. One click adopts it for live trading. This tool is part of the Stein Investments ecosystem.  Browse all 18 tools, get AI-powered setup recommendations,  and join th
Grabber System MT5
Ihor Otkydach
4.83 (23)
Let me introduce you to an excellent technical indicator – Grabber, which works as a ready-to-use "All-Inclusive" trading strategy. Within a single code, it integrates powerful tools for technical market analysis, trading signals (arrows), alert functions, and push notifications. Every buyer of this indicator also receives the following for free: Grabber Utility for automatic management of open orders Step-by-step video guide: how to install, configure, and trade with the indicator Custom set fi
New Update of   Smart Trend Trading System MT5 For  2026 Market: If You Buy this Indicator you will Get my Professional Trade Manager + EA  for FREE . First of all Its worth emphasizing here that this Trading System is Non-Repainting   , Non Redrawing and Non Lagging Indicator Which makes it ideal from both manual and robot trading .  [Online course] , [manual] and [download presets] . The Smart Trend Trading System MT5 is a comprehensive trading solution tailored for new and experienced traders
Quantum TrendPulse
Bogdan Ion Puscasu
5 (23)
Introducing Quantum TrendPulse , the ultimate trading tool that combines the power of SuperTrend , RSI , and Stochastic into one comprehensive indicator to maximize your trading potential. Designed for traders who seek precision and efficiency, this indicator helps you identify market trends, momentum shifts, and optimal entry and exit points with confidence. Key Features: SuperTrend Integration: Easily follow the prevailing market trend and ride the wave of profitability. RSI Precision: Detect
Azimuth Pro
Ottaviano De Cicco
5 (7)
Azimuth Pro V2: Synthetic Fractal Structure and Confirmed Entries for MT5 Overview Azimuth Pro is a multi-level swing structure indicator by Merkava Labs . Four nested swing layers, swing-anchored VWAP, ABC pattern detection, three-timeframe structural filtering, and closed-bar confirmed entries — one chart, one workflow from micro-swings to macro-cycles. This is not a blind signal product. It is a structure-first workflow for traders who care about location, context, and timing. V2 Launch Offe
FX Trend MT5 NG
Daniel Stein
5 (4)
FX Trend NG: The Next Generation Multi-Market Trend Intelligence Overview FX Trend NG is a professional multi-timeframe trend and market monitoring tool designed to give you a complete structural overview of the market in seconds. Instead of switching between dozens of charts, you instantly see which symbols are trending, where momentum is fading, and where strong alignment exists across timeframes. This tool is part of the Stein Investments ecosystem.  Browse all 18 tools, get AI-powered set
SignalTech MT5 is a trading system for EURUSD, USDCHF, USDJPY, AUDUSD, NZDUSD, EURJPY, AUDJPY, NZDJPY, CADJPY H2 and H3 Timeframe.  It can generate signals with Buy/Sell Arrows and Pop-Up/Sound Alerts. Each signal has clear Entry and Stop Loss levels, which should be automatically flagged on the chart, as well as potential Targets 1, 2, and 3. The Entry and TP levels are fixed after the trade is taken. The exit level is dynamic. If there are signs of a potential short-term trend reversal, the
Gann Made Easy   is a professional and easy to use Forex trading system which is based on the best principles of trading using the theory of W.D. Gann. The indicator provides accurate BUY and SELL signals including Stop Loss and Take Profit levels. You can trade even on the go using PUSH notifications. PLEASE CONTACT ME AFTER PURCHASE TO GET TRADING  INSTRUCTIONS   AND GREAT EXTRA INDICATORS   FOR FREE! Probably you already   heard   about the Gann trading methods before. Usually the Gann theory
Meravith MT5
Ivan Stefanov
5 (1)
Market makers' tool. Meravith will: Analyze all timeframes and display the current trend in force. Highlight liquidity zones (volume equilibrium) where bullish and bearish volumes are equal. Display all liquidity levels across different timeframes directly on your chart. Generate and present text-based market analysis for your reference. Calculate targets, support levels, and stop-loss points based on the current trend. Compute the risk/reward ratio for your trades. Determine position size accor
Atomic Analyst MT5
Issam Kassas
3.94 (31)
New Update of   Atomic Analyst MT5 For  2026 Market: If You Buy this Indicator you will Get my Professional   Trade Manager + EA  for   FREE . First of all Its worth emphasizing here that this Trading Indicator is   Non-Repainting   , Non Redrawing and Non Lagging Indicator   Indicator, Which makes it ideal from both manual and robot trading.  User manual: settings, inputs and strategy . The Atomic Analyst  is a PA Price Action Indicator that uses Strength and Momentum of the price to find a bet
Bill Williams Advanced
Siarhei Vashchylka
5 (11)
Bill Williams Advanced is designed for automatic chart analysis using Bill Williams' "Profitunity" system. The indicator analyzes four timeframes at once. Manual (Be sure to read before purchasing) Advantages 1. Analyzes the chart using Bill Williams' "Profitunity" system. Signals are displayed in a table in the corner of the screen and on the price chart. 2. Finds all known AO and AC signals, as well as zone signals. Equipped with a trend filter based on the Alligator. 3. Finds "Divergence Bar
Trend Screener Pro MT5
STE S.S.COMPANY
4.85 (104)
Trend Screener Indicator --Professional Trend Trading & Market Scanning System for MetaTrader Unlock the true power of trend trading with Trend Screener Indicator — a complete multi-currency, multi-timeframe trend analysis solution powered by Fuzzy Logic,Trend Pulse Technology  and advanced market structure algorithms.   Trend Screener transforms your MetaTrader platform into a professional-grade Trend Analyzer and Market Scanner, helping you identify high-probability trend opportunities, early
Top indicator for MT5   providing accurate signals to enter a trade without repainting! It can be applied to any financial assets:   forex, cryptocurrencies, metals, stocks, indices .  Watch  the video  (6:22) with an example of processing only one signal that paid off the indicator! MT4 version is here It will provide pretty accurate trading signals and tell you when it's best to open a trade and close it. Most traders improve their trading results during the first trading week with the help of
Introducing   Quantum Breakout PRO , the groundbreaking MQL5 Indicator that's transforming the way you trade Breakout Zones! Developed by a team of experienced traders with trading experience of over 13 years,   Quantum Breakout PRO   is designed to propel your trading journey to new heights with its innovative and dynamic breakout zone strategy. Quantum Breakout Indicator will give you signal arrows on breakout zones with 5 profit target zones and stop loss suggestion based on the breakout b
Btmm state engine pro
Garry James Goodchild
5 (4)
BTMM State Engine Pro is a MetaTrader 5 indicator for traders who use the Beat The Market Maker approach: Asian session context, kill zone timing, level progression, peak formation detection, and a multi-pair scanner from a single chart. It combines cycle state logic with a built-in scanner dashboard so you do not need the same tool on many charts at once. What it does Draws the Asian session range; session times can follow broker server offset or be set in inputs. Tracks level progression (L
OmniSync Projection
Antonio-alin Teculescu
5 (1)
Chronos Fractal Engine is an innovative price projection indicator for MetaTrader 5, designed to transform your technical analysis by intelligently identifying and projecting historical price patterns. Built upon an advanced correlation algorithm and the fractal principles of the market, this powerful tool visualizes potential future price movements, giving you a unique edge in your trading decisions. What is Chronos Fractal Engine? At its core, the Chronos Fractal Engine employs a sophisticat
Let's be honest first. No indicator will make you profitable on its own. If someone tells you otherwise, they're selling you a dream. Every indicator that shows perfect buy/sell arrows can be made to look flawless — just zoom into the right window of history and screenshot the winners. We won't do that. SMC Intraday Formula is a tool. It reads the market structure for you, maps the highest-probability price zones, and tells you exactly what the smart money footprint looks like right now — in pl
FX Power MT5 NG
Daniel Stein
5 (31)
FX Power: Analyze Currency Strength for Smarter Trading Decisions Overview FX Power is your go-to tool for understanding the real strength of currencies and Gold in any market condition. By identifying strong currencies to buy and weak ones to sell, FX Power simplifies trading decisions and uncovers high-probability opportunities. Whether you’re looking to follow trends or anticipate reversals using extreme delta values, this tool adapts seamlessly to your trading style. Don’t just trade—trade
See which strategy actually works on your symbol - before you risk real money. Power Bar detects extreme price bars on any symbol and any timeframe, then instantly backtests 3 different trading strategies so you can compare win rates, profit factors, and P&L side by side. All in a single interactive panel. No guessing. No curve-fitting. Just data. This tool is part of the Stein Investments ecosystem.  Browse all 18 tools, get AI-powered setup recommendations,  and join the community at https://
Market Structure Order Block Dashboard MT5 is an MT5 indicator designed for traders who want to read market structure and the main price reaction zones directly on the chart. It combines BOS, ChoCH, Order Blocks, Fair Value Gaps (FVG), Liquidity, Kill Zones, Volume Profile, and a compact dashboard for quick analysis. This indicator targets traders who use market structure, ICT and Smart Money concepts as a decision framework. It can help spot trend continuations, possible reversals, price imbala
Berma Bands
Muhammad Elbermawi
5 (8)
The Berma Bands (BBs) indicator is a valuable tool for traders seeking to identify and capitalize on market trends. By analyzing the relationship between the price and the BBs, traders can discern whether a market is in a trending or ranging phase. Visit the [ Berma Home Blog ] to know more. Berma Bands are composed of three distinct lines: the Upper Berma Band, the Middle Berma Band, and the Lower Berma Band. These lines are plotted around the price, creating a visual representation of the pric
Crystal Heikin Ashi Signals
Muhammad Jawad Shabir
5 (2)
Crystal Heikin Ashi Signals - Professional Trend & Signal Detection Indicator Advanced Heikin Ashi Visualization with Intelligent Signal System for Manual & Automated Trading Final Price: $149 ---------> Price goes up $10 after every 10 sales . Limited slots available — act fast . Overview Crystal Heikin Ashi Signals is a professional-grade MetaTrader 5 indicator that combines pure Heikin Ashi candle visualization with an advanced momentum-shift detection system. Designed for both manual traders
Gartley Hunter Multi
Siarhei Vashchylka
5 (11)
Gartley Hunter Multi - An indicator for searching for harmonic patterns simultaneously on dozens of trading instruments and on all possible timeframes. Manual (Be sure to read before purchasing) | Version for MT4 Advantages 1. Patterns: Gartley, Butterfly, Shark, Crab. Bat, Alternate Bat, Deep Crab, Cypher 2. Simultaneous search for patterns on dozens of trading instruments and on all possible timeframes 3. Search for patterns of all possible sizes. From the smallest to the largest 4. All fou
FX Levels MT5
Daniel Stein
5 (13)
FX Levels: Exceptionally Accurate Support & Resistance for All Markets Quick Overview Looking for a reliable way to pinpoint support and resistance levels across any market—currencies, indices, stocks, or commodities? FX Levels merges our traditional “Lighthouse” method with a forward-thinking dynamic approach, offering near-universal accuracy. By drawing from real-world broker experience and automated daily plus real-time updates, FX Levels helps you identify reversal points, set profit targe
META Points PRO     — is a trend-following tool that takes the guesswork out of trading and shows where the market has already made its decision. The indicator identifies key points where trends, trends, and structures change, and highlights areas where the price returns for major players to take positions. You don't just see the movement — you understand the logic behind it. All signals are recorded after the candle closes, are not redrawn, and are saved on the chart, allowing you to confidentl
IX Power MT5
Daniel Stein
4.92 (13)
IX Power: Unlock Market Insights for Indices, Commodities, Cryptos, and Forex Overview IX Power is a versatile tool designed to analyze the strength of indices, commodities, cryptocurrencies, and forex symbols. While FX Power offers the highest precision for forex pairs by leveraging all available currency pair data, IX Power focuses exclusively on the underlying symbol’s market data. This makes IX Power an excellent choice for non-forex markets and a reliable option for forex charts when deta
More from author
Crypto Charting
Rajesh Kumar Nait
5 (5)
Overview Crypto Charting for MT5 provides real-time OHLC data for various cryptocurrencies via WebSocket integration. It is designed for traders who require consistent and automated chart updates from multiple exchanges directly within the MetaTrader 5 platform. The product supports all standard MT5 timeframes and offers historical data synchronization features. Features Real-Time Charts via WebSocket Provides continuous, low-latency market data without relying on traditional API connections. A
This indicator plots upto 6 levels which can be enable / disable to make chart cleaner as per trader's requirement You can get alerts on Previous Week Previous Day, Previous Month or high low of any period previous candle available in MT4 These 6 levels are in 2 sets : High and Low For each sets, different time frame can be selected It is based on strategy of Previous High Low reversal, as its considered that price usually show rejection in smaller timeframe like 5min when price reach Daily, We
This library will allow you to manage trades using any of your EA and its very easy to integrate on any EA which you can do yourself with the script code which is mentioned in description and also demo examples on video which shows the complete process. This product allows trading operations via API For chart : Renting Crypto Charting for OHLC data or Crypto Ticks with Order Book Depth is optional If your EA is HFT and operations on seconds chart, You may be interested in converting charts to se
Binance Trading Tool for MT5 1. This product include live chart from websocket, historical chart, automatic updates on restart of mt5 terminal to make it run smooth with zero manual intervention that makes you experience to trade Binance smoothly. Trading, Live chart & Historical Data available for Spot and Futures Chart Features : 1. Live OHLC Chart via Websocket (wss) 2. Update History from API 3. Auto Update history on charts every time you open MT5 4. All time frame supports from M1 to
This indicator finds Double Top and Double bottom Example : What is Double Top When price establishes a new high and then falls, then reverse to the same candle area of High then its considered a valid double top and vice versa for double bottom. 1. It plots and high and low on visible chart if ChartChange is set to true else it searches on new bar opening 2. If there is double top and double bottom found in visible chart window then it plots a line 3. It has options to customize text color, tex
FREE
Malaysian SNR  https://www.scribd.com/document/846474911/Malaysian-Snr-Theory is a Support and Resistance System used by trader from Malaysia and is a quick way for scalpers and day traders to find Support and Resistance. This indicator features 1. Panel to show / hide Classic support resitance (Malaysian SNR), Gap SNR, RBS / SBR and Reverse levels of SNR to find price liquidity 2. Enable Wick Rejection Filter to show only SNR validated by Wick Rejection 3. Show Hide Prices on level 4. Works on
Real Spinning Top Indicator  It detects accurate spinning top on chart with balanced body and wick height ratio which is the true meaning of spinning top which differs it from Hammers and Doji or Null Candlestick. This indicator plots an wingdings icon at number of spinning tops found on the chart. Settings include Number of Bars : To adjust search on number of bars Color of Icon :change color of icon Icon code : change code of wingdings for icon
FREE
Multi Symbol Double Click anywhere on chart to set price alert for MT4 and get notified from Terminal Alert or Push Notification 1. Add the EA Utility on chart 2. Browse chart by <- left or -> right arrow keys 3. Double click anywhere on chart and it will add a line, drag this line to set your desired price and voila, alert is set! When price will reach to the line it will notify you with either terminal or push notification as per utility's settings.  This alert will keep working even if you r
Cobra Pivot Points is an indicator for plotting best optimized pivot points support and resistance levels which you can backtest yourself by downloading the DEMO. 1. Select 7 type of Pivot Mode : Cobra, Camarilla 1, Camarilla 2, Floor, Woodie, Demark and Fibonacci pivots 2. You can use any time frame to find pivot points support and resistance 3. You can play with Previous day High Low Close value with Shift parameter. 1 = Previous Bar, 2 = Bar before Previous bar and so on.. These parameter wil
Multi Currency Previous Candle or Previous Bar Scanner helps you scan multi symbol charts with any custom timeframe which you select from indicator settings. Based on product : https://www.mql5.com/en/market/product/110229 It can be used to scan multi symbols for Previous Day high low, Previous week high low, Previous month High low or any custom timeframe e.g. Previous 4 hour chart high low It filters noise and gives directional alerts when price touches High or low line  The strategy is simp
Pivot Points Multi Symbol Scanner scans all symbols available in marketwatch for Floor, Woodie, Camarilla, Demark or Fibonacci Pivot Points. You can select any timeframe to calculate pivot points and get alerts when price touch these levels of support and resistance. For visual Pivot Points You may be interested in this product : https://www.mql5.com/en/market/product/110231 It has options for choosing various alerts type You can choose and set frequency to scan in milliseconds 1000 means it
This library will allow you to manage trades using any of your EA and its very easy to integrate on any EA which you can do yourself with the script code which is mentioned in description and also demo examples on video which shows the complete process. This product allows trading operations via API and does not include charts. Users may use charts from brokers who provides Crypto and send orders to binance - Supports One way and Hedge Mode - Place Limit, SL Limit and Take Profit Limit Orders -
This library will allow you to manage trades using any of your EA and its very easy to integrate on any EA which you can do yourself with the script code which is mentioned in description and also demo examples on video which shows the complete process. This product allows trading operations to Bybit exchange via API  This tool does not have charting feature so users may use other symbols provided by exchanges for BTCUSDT and other crypto. - Place Limit and Market Orders (Hedge Mode and One Way
Add this indicator to chart and set the ExtDepth Setting of ZigZag  It gives instant alert when Price touches trendline Upper, Lower or Middle channel Features : -Enable / Disable alerts on upper, lower or middle line - Add pause after a alert in seconds - Pause or Unpause Trend channel with button on chart - Add early alerts by adding points in input field, for example ETH price is 2900.25 here the digits 25 is "point", so if you add 25 in input field in points and if the value of lower line
Crypto to MT5
Rajesh Kumar Nait
Crypto.com to MT5 Live Candlestick Stream to Metatrader 5 from Crypto.com websocket Its a OHCLV (Open High Low Close Real Volume ) Live Rates Data you can check my other crypto product on my profile  https://www.mql5.com/en/users/rajeshnait/seller 1. OHLCV Data 2. Supports and Creates Multiple Symbols 3. You need to add Crypto.com websocket and api URL as mentioned at Tools > Options > Allow Webrequest from URL tab and also tick Allow Webrequest checkbox - Websocket URL : stream.crypto.com - API
Patterns Explorer for Triangle pattern such as symmetrical triangle, asymmetrical triangle or right angle triangle , Wedge pattern such as Rising wedge or Falling wedge, Expansion pattern and Trend Channel This indicator explores historical pattern as well as current patterns, It is the best indicator for those who are trying to save time from manually drawing trendline or triangle and want to use this for automated analysis of plotting best patterns on chart Features : - Panel for changing ZigZ
This indicator plots upto 6 levels which can be enable / disable to make chart cleaner as per trader's requirement These 6 levels are in 2 sets : High and Low For each sets, different timeframe can be selected It is based on strategy of Previous High Low reversal, as its considered that price usually show rejection in smaller timeframe like 5min when price reach Daily, Weekly or Monthly High Low Features : - Track upto 6 Timeframe High Lows in single chart - Add Previous London Session, NY Sessi
Kraken Crypto Exchange Futures History Update Panel Features : 1.  It will create symbol based on setting and update history fully which is available from Kraken API for the symbol. This panel updates history on Kraken Futures symbols with Open High Low Close data, It also Prints message when History Update is complete. Please note this is not LIVE Data.   3.  You need to add Kraken API URL as mentioned at Tools > Options > Allow Webrequest from URL tab and also tick Allow Webrequest checkbox
5 EMA Scalping Strategy Multi Symbol Scanner This EA utility will scan all symbols which are selected in marketwatch and alert when such condition is formed in chart when Candle low is above EMA 5 for Sell alert and Candle high is lower from EMA5 so you can be ready before selling or buying for scalping purpose on 5min chart For more details watch attached video Logic : When a candle closes above 5 EMA in 5 mins chart, Wait for its low to break and Sell when low is broken by wick, Your SL shou
Multi Symbol ZigZag Breakout Scanner scans all symbols selected in marketwatch. It will help finding double top, double bottom or any fibonacci extension level easily when price is about to reach those levels. You can select Timeframe, and multiple Extdepths (up to 3) of Zigzag. Recommended ZigZag are 21,34 and 55 which covers all types of Zigzag and filter noise You can set to receive either terminal alert or push notification or both Use cases : 1. To find Break of structure of order blocks 2
Market structures are the one which when breakout in higher timeframe may help clears a trend to a trader. 1. This indicator will draw ZigZag to only last 2 structures (previous high and low of ZigZag ) and a new bar of ZigZag will be only formed when break of structure happens 2. It gives Terminal and Push notificationon break of structure 3. Increase and Decrease Extdepth of ZigZag from "[" and "]" keys to adjust swing 4. Change colors of Line AB BC and CD 5. Add to many charts and get alerts
Fibo Musang FMBCR CB1 breakout multi symbol scanner for MT5 scans all symbols selected in marketwatch for dominan break Fibo Musang CB1 or Candle Break 1 is a strategy that works very well on Gold XAUUSD and other forex symbols. This scanner will help you scan mulltisymbol currencies very fast and get alerts on FMCBR CB1 breakout Please see video for more details as its completely customizable as per trader's preference: 1. You can select timeframe and History of Bars 2. You can modify your p
Multi Symbol Double Click anywhere on chart to set price alert and get notified from Terminal Alert or Push Notification 1. Add the EA Utility on chart 2. Browse chart by <- left or -> right arrow keys 3. Double click anywhere on chart and it will add a line, drag this line to set your desired price and voila, alert is set! When price will reach to the line it will notify you with either terminal or push notification as per utility's settings.  This alert will keep working even if you restart te
Control Candle is the candlestick which holds multiple inside bars and are in control until its high low range is broken by close of any candlestick. When control candle is broken, price may act on these control candle as support and resistance. This indicator create rectangles on chart which will help you find control candles fast. Control candle indicator box is customizable by color, style, width and other options in indicator settings.
This indicator allows you to show fibonacci levels labels with big font size . It supports up to 25 fibonacci levels - As soon as you draw fibonacci it shows the levels you added as input parameter with big font size with the color and font you choose. Customizable options : 1. Fibo Text Font 2. Fibo Text Size 3. Fibo Text Color 3. Add description to each level 4. Other options such as Anchors and Degrees
Higher Time Frame Bars
Rajesh Kumar Nait
5 (1)
This indicator efficiently tracks any other timeframe candlesticks which you want to track on same chart 1. Select any higher time frame to load bars on same chart 2. Customize colors, width, background and style of candlesticks and wick width 3. Choose number of bars to draw candlesticks 4. Track higher timeframe complete candles along with wick and body 5. Easy and convenient for those who dont want to switch chart. 6. See candle range { high - low } and change color, font, size 7. Enable / Di
Cobra Pivot Points is an indicator for plotting best optimized pivot points support and resistance levels which you can backtest yourself by downloading the DEMO. 1. Select 7 type of Pivot Mode : Cobra, Camarilla 1, Camarilla 2, Floor, Woodie, Demark and Fibonacci pivots 2. You can use any time frame to find pivot points support and resistance 3. You can play with Previous day High Low Close value with Shift parameter. 1 = Previous Bar, 2 = Bar before Previous bar and so on.. These parameter wil
Multi Currency Previous Candle or Previous Bar Scanner helps you scan multi symbol charts with any custom timeframe which you select from indicator settings. Based on product : https://www.mql5.com/en/market/product/78657 It can be used to scan multi symbols for Previous Day high low, Previous week high low, Previous month High low or any custom timeframe e.g. Previous 4 hour chart high low It filters noise and gives directional alerts when price touches High or low line  The strategy is simpl
Pivot Points Multi Symbol Scanner scans all symbols available in marketwatch for Floor, Woodie, Camarilla, Demark or Fibonacci Pivot Points. You can select any timeframe to calculate pivot points and get alerts when price touch these levels of support and resistance. For visual Pivot Points You may be interested in this product : https://www.mql5.com/en/market/product/110072 It has options for choosing various alerts type You can choose and set frequency to scan in milliseconds 1000 means it
Crypto Ticks and Depth
Rajesh Kumar Nait
5 (2)
Crypto Ticks for MetaTrader 5 – Real-Time Crypto Tick Data and Order Book Integration Overview Crypto Ticks streams real-time tick data and order book depth from major cryptocurrency exchanges directly into MetaTrader 5. Designed for traders who require precise market data for scalping, algorithmic strategies, and strategy testing. Supported Exchanges Binance : Spot  and Futures  KuCoin : Spot and Futures (active chart order book support) Bybit : Futures and Inverse Futures XT.com : Spot and Fu
Filter:
No reviews
Reply to review