Regardez les tutoriels vidéo de Market sur YouTube
Comment acheter un robot de trading ou un indicateur
Exécutez votre EA sur
hébergement virtuel
hébergement virtuel
Test un indicateur/robot de trading avant d'acheter
Vous voulez gagner de l'argent sur Market ?
Comment présenter un produit pour qu'il se vende bien
Indicateurs techniques pour MetaTrader 5 - 6

Candle Time CountDown By BokaroTraderFx The Candle Timer Countdown Indicator is a versatile tool designed for the MetaTrader 5 (MT5) trading platform. It provides traders with a visual countdown of the remaining time for the current candle on a chart. The key features include:
Customizable Position: Place the countdown timer in any corner of the chart for optimal visibility. Default Text Color: Set to red for clear visibility, with options for further customization. Minimal Display: Shows only
FREE

Bienvenue dans notre modèle de vague de prix MT5 -- (modèle ABCD) -- Le modèle ABCD est un modèle de trading puissant et largement utilisé dans le monde de l'analyse technique.
Il s'agit d'un modèle de prix harmonique que les commerçants utilisent pour identifier les opportunités potentielles d'achat et de vente sur le marché.
Avec le modèle ABCD, les traders peuvent anticiper les mouvements de prix potentiels et prendre des décisions éclairées sur le moment d'entrer et de sortir des trans
FREE

The Breakout Finder (BF) is a powerful MetaTrader 5 indicator designed to detect potential breakout and breakdown opportunities in price action. By analyzing pivot highs and lows over a user-defined period, it identifies consolidation zones where price has repeatedly tested resistance or support levels within a narrow channel. When price breaks out of these zones with sufficient confirmation (based on the minimum number of tests and channel width threshold), the indicator visually highlights th
FREE

The MTF Candlestick Patterns Detector indicator is a comprehensive Momentum & Trend Intelligence System designed to strip away market noise and provide institutional-grade clarity for retail traders. It specializes in high-probability signal detection by merging price action geometry with temporal confluence. Here is why this tool is a game-changer for your trading desk: Core Functionalities · Automated Candlestick Pattern Recognition: The indicator scans for high-alpha patterns (like E

Overview The Smart Money Structure Markup Indicator for MetaTrader 5 is a powerful tool designed to help traders identify key market structures based on popular Smart Money Concepts (SMC) strategies. This indicator detects micro-market structures, providing insights into price movements and potential trend changes. It highlights important elements such as valid Break of Structure (BOS), Change of Character (CHoCH), and Inducement (IDM), helping traders to make informed decisions. Key Features Ma
FREE
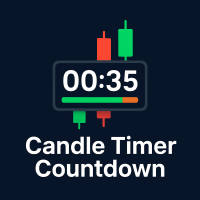
Candle Timer Countdown v2.5 is an advanced MQL5 indicator designed to enhance your trading precision. It provides a live countdown for each candle while simultaneously analyzing multiple timeframes to detect trend direction and potential early reversals. Key features include: Candle Countdown & Progress Bar: Monitor the exact time remaining for each candle with a clear progress visualization. Advanced Trend Detection: Analyze both fast and slow trends with configurable sensitivity and multi-time
FREE

Si vous aimez ce projet, laissez un examen 5 étoiles. Cet indicateur tire les prix ouverts, élevés, bas et de fermeture pour les prix
spécifiés
période et il peut être ajusté pour un fuseau horaire spécifique. Il s ' agit là d ' un niveau important qui s ' intéresse à de
nombreux domaines institutionnels et professionnels.
traders et peut être utile pour vous de connaître les endroits où ils pourraient
être plus
active. Les périodes disponibles sont les suivantes : Jour précédent. Semaine pré
FREE

Opening‑Range Sessions (GMT‑Aware) est un indicateur léger qui trace automatiquement l’intervalle d’ouverture — plus haut, plus bas et rectangle coloré — pour les principales fenêtres de liquidité du marché Forex : Sydney, Tokyo, Londres et New York . L’indicateur détecte le fuseau horaire du serveur de votre courtier, de sorte que chaque session commence à l’heure locale correcte, quel que soit l’emplacement du serveur ou du trader. Points forts Détection automatique du fuseau horaire – exploit
FREE
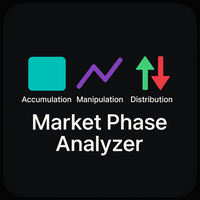
Description générale
Des signaux clairs et des règles simples pour identifier les trois phases clés du marché. Cet indicateur détecte en temps réel une phase d’accumulation basée sur la session asiatique, identifie les balayages de liquidité pendant la phase de manipulation et confirme la direction de tendance lors de la phase de distribution. Il affiche des flèches vertes pour la phase haussière et rouges pour la phase baissière, trace la boîte asiatique avec couleur et bordure personnalisable
FREE

Detailed Description:
The Pivot Points Indicator is designed for traders who rely on pivot points, midpoints and support/resistance levels for their trading strategies. By automatically calculating and plotting these levels (based on the previous period's high, low, and close prices) , the indicator provides a clear, visual representation of critical price areas where the market may reverse or break out.The tool is particularly useful for day traders and swing traders looking to base th
FREE

This indicator has been developed to identify and display these trends quickly and easily, allowing you to see instantly, those currency pairs which are trending, and those which are not – and in all timeframes, with just one click. The 28 currency pairs are displayed as a fan as they sweep from strong to weak and back again, and this is why we call it the ‘currency array’. All 28 pairs are arrayed before you, giving an instant visual description of those pairs that are trending strongly, those

ZenTrend — Adaptive Trend Indicator for MetaTrader 5 ZenTrend is an innovative trend indicator for MetaTrader 5 that plots a flexible and informative trend line on the chart, based on adaptive moving average calculations. This tool is ideal for traders seeking precise and timely identification of trend direction on any financial market: forex, stocks, indices, cryptocurrencies, and commodities. Key Features of ZenTrend 1. Four Types of Moving Averages Supported
ZenTrend allows you to choose fro

Bienvenue sur l’indicateur EPo-CreW Forex Super ORB-H4 !
Ce guide vous apprendra à utiliser cet outil puissant afin d’identifier des opportunités de trading à forte probabilité, basées sur la première plage d’ouverture de 4 heures du marché.
Que vous soyez débutant ou trader expérimenté, ce système vous aidera à trader avec plus de confiance et de régularité. CECI EST UN PRODUIT DE DÉMONSTRATION. IL EXPIRERA 30 JOURS APRÈS LA DATE D’INSTALLATION. Version complète disponible ici : https://www.mql
FREE

** All Symbols x All Timeframes scan just by pressing scanner button ** Discount: The price is $50$, But now it is just $39, Limited time offer is active.
*** Contact me to send you instruction and add you in "Trend Reversal group" for sharing or seeing experiences with other users. Introduction: Trendlines are the most famous technical analysis in trading . Trendlines continually form on the charts of markets across all the different timeframes providing huge opportunities for traders

Synthetic Trend AI : un indicateur de tendance intelligent optimisé par l'intelligence artificielle
L'indicateur Synthetic Trend AI est un puissant outil d'analyse technique qui combine la formule classique de SuperTrend avec des algorithmes d'intelligence artificielle (k-Nearest Neighbors, KNN) et l'analyse des volumes. Il est conçu pour ceux qui souhaitent analyser le marché en profondeur et prendre des décisions plus éclairées.
Ce qui rend Synthetic Trend AI unique : Prévisions de tendance
FREE
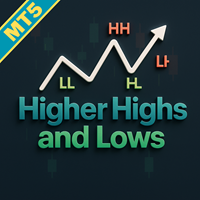
Améliorez votre trading d'action des prix avec l'indicateur Higher Highs and Lows MT5, un outil robuste qui exploite l'analyse fractale pour repérer les points de swing clés et identifier les patterns définissant les tendances comme Higher Highs (HH), Lower Highs (LH), Lower Lows (LL) et Higher Lows (HL) pour des insights clairs sur la direction du marché. S'inspirant des principes fondamentaux d'action des prix enracinés dans la Théorie de Dow du début des années 1900 et popularisés dans le tr
FREE

Pourquoi la plupart des divergences RSI sont soit retardées, soit sujettes au repaint Si vous avez utilisé suffisamment d’indicateurs de divergence RSI, vous avez probablement rencontré l’une des deux situations suivantes : soit la divergence apparaît très tard,
soit une divergence affichée disparaît ensuite. Cela ne signifie pas que l’indicateur est « mal codé ».
Le problème vient du fait que la logique de calcul des divergences comporte un compromis inévitable . Si l’on cherche à afficher la d
FREE

DRX Smart Risk | Planificateur de Trade Professionnel Arrêtez de deviner. Commencez à planifier. Le calcul manuel des lots et du ratio Risque/Rendement est lent. DRX Smart Risk apporte le flux de travail intuitif des plateformes professionnelles (comme TradingView) directement dans votre terminal MetaTrader 5. Le Problème : Les lignes standard de MT5 sont peu pratiques. Elles disparaissent lors du changement d'unité de temps et vous obligent à calculer le R:R mentalement. La Solution : DRX Smart
FREE
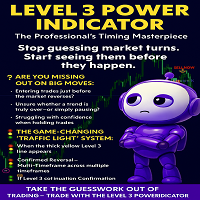
LEVEL 3 POWER INDICATOR
The Professional’s Timing Masterpiece
Stop guessing market turns. Start seeing them before they happen.
---
Are You Missing Out on Big Moves?
Entering trades just before the market reverses?
Unsure whether a trend is truly over—or simply pausing?
Struggling with confidence when holding trades?
You’re not alone. Most traders wrestle with these exact challenges… until they discover the Level 3 Power Indicator.
---
The Game-Changing “Traffic Light” Syst
FREE

Outil d'Analyse de Tendance Multi-Temporelle Vous voulez suivre les tendances sur plusieurs unités de temps sans changer constamment de graphiques ? Smart Trend Consensus MT5 est un outil d'analyse technique qui consolide les données de 7 unités de temps simultanément (M1, M5, M15, M30, H1, H4, D1). L'indicateur utilise 7 critères techniques pour évaluer l'état de la tendance sur chaque unité de temps et affiche toutes les informations sur un tableau de bord visuel. Un outil d'analyse

Pips Hunter PRO a été développé sur plusieurs années et est une version améliorée de son prédécesseur. Ce puissant indicateur analyse le marché et l'historique des prix pour générer des entrées d'achat et de vente. Pour le calcul de ces entrées, il utilise différents indicateurs qui travaillent ensemble ainsi qu'un logarithme statistique complexe qui filtre les entrées les moins favorables et les élimine / version MT4 .
Fonctionnalités Pas de repeinture
Cet indicateur ne change pas ses va
FREE

This indicator provides the ability to recognize the SMC pattern, essentially a condensed version of the Wyckoff model. Once the pattern is confirmed by RTO, it represents a significant investment opportunity. There are numerous indicators related to SMC beyond the market, but this is the first indicator to leverage patterns to identify specific actions of BigBoy to navigate the market. The SMC (Smart Money Concept) pattern is a market analysis method used to understand the behavior of "smart

Dark Oscillator is an Indicator for intraday trading. This Indicator is based on Counter Trend strategy, trying to intercept changes in direction, in advance compared trend following indicators. We can enter in good price with this Indicator, in order to follow the inversion of the trend on the current instrument. It is advised to use low spread ECN brokers. This Indicator does Not repaint and N ot lag . Recommended timeframes are M5, M15 and H1. Recommended working pairs: All. I nst
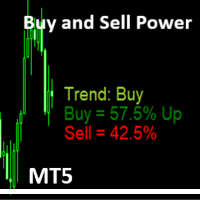
Simple Indicator that shows the Buy and Sell volume in percent. The Buy and Sell Power indicator for MetaTrader 5 calculates and displays estimated buy/sell volume percentages over a user-defined period (default: 14 bars) using tick volume data. It overlays text labels on the chart showing Buy % (with "Up" if >51%), Sell % (with "Dn" if >51%), and a trend signal based on thresholds: Neutral (<55%), Trend: Buy/Sell (55%+), Trend: Strong Buy/Sell (62%+), Trend Max UP/Down (65%+), or Trend change s
FREE

Haven HTF Candle — La Puissance du Timeframe Supérieur sur Votre Graphique Découvrez Haven HTF Candle — un outil puissant qui affiche les bougies d'un timeframe supérieur (HTF) directement sur votre graphique de travail. Cessez de basculer constamment entre les fenêtres et commencez à voir le véritable contexte du marché, ce qui est la base pour prendre des décisions de trading éclairées. Autres produits -> ICI . Fonctionnalités Clés et le Concept "Power of 3" Analyse selon le concept "Power of
FREE

Présentation Quantum Breakout PRO , l'indicateur révolutionnaire MQL5 qui transforme la façon dont vous négociez les zones d'évasion ! Développé par une équipe de traders expérimentés avec une expérience commerciale de plus de 13 ans, Évasion quantique PRO est conçu pour propulser votre parcours commercial vers de nouveaux sommets grâce à sa stratégie de zone de discussion innovante et dynamique.
Quantum Breakout Indicator vous donnera des flèches de signalisation sur les z
Affiche automatiquement les niveaux de variation en pourcentage du jour pour indiquer les zones de support et de résistance — voici 2MV Frequencies Full. Basé sur la méthodologie exclusive de Evandro Soares , cet indicateur permet d’identifier rapidement les zones de support et de résistance selon des niveaux de pourcentage (par exemple : 0,50%, 1%, 1,50%). Entièrement personnalisable, il permet d’analyser avec précision et clarté les zones de renversement, de cassure et de latéralisation .

Introduction
Reversal Candles is a cutting-edge non-repainting forex indicator designed to predict price reversals with remarkable accuracy through a sophisticated combination of signals.
Signal Buy when the last closed candle has a darker color (customizable) and an up arrow is painted below it Sell when the last closed candle has a darker color (customizable) and a down arrow is painted above it
FREE

Necessary for traders: tools and indicators Waves automatically calculate indicators, channel trend trading Perfect trend-wave automatic calculation channel calculation , MT4 Perfect trend-wave automatic calculation channel calculation , MT5 Local Trading copying Easy And Fast Copy , MT4 Easy And Fast Copy , MT5 Local Trading copying For DEMO Easy And Fast Copy , MT4 DEMO Easy And Fast Copy , MT5
DEMO
砖图 Renko PRO->>>
The display of the brick map on the main map.
The Renko chart ideally r
FREE

The trend is your friend!
Look at the color of the indicator and trade on that direction. It does not repaint. After each candle is closed, that's the color of the trend. You can focus on shorter faster trends or major trends, just test what's most suitable for the symbol and timeframe you trade. Simply change the "Length" parameter and the indicator will automatically adapt. You can also change the color, thickness and style of the lines. Download and give it a try! There are big movements w

Royal Scalping Indicator is an advanced price adaptive indicator designed to generate high-quality trading signals. Built-in multi-timeframe and multi-currency capabilities make it even more powerful to have configurations based on different symbols and timeframes. This indicator is perfect for scalp trades as well as swing trades. Royal Scalping is not just an indicator, but a trading strategy itself. Features Price Adaptive Trend Detector Algorithm Multi-Timeframe and Multi-Currency Trend Low

For those who struggle with overbloated Volume Profile/Market Profile indicators, here is a solution that contains only the Point of Control (POC) information. Super-fast and reliable, the Mini POC indicator presents this vital information visually within your chart. Totally customizable in splittable timeframes, type of Volume, calculation method, and how many days back you need.
SETTINGS Timeframe to split the POCs within the day. Volume type to use: Ticks or Real Volume. Calculation method .
FREE
Indicateur ICONIC SMC — Tradez avec une clarté de niveau institutionnel Enfin un SMC objectif — sans la corvée manuelle. Marre de passer des heures à baliser vos graphiques pour rater l’entrée de quelques pips ? Vous doutez de votre lecture quand l’argent réel est en jeu ? L’ère d’un SMC subjectif et chronophage est terminée. L’ Indicateur ICONIC SMC n’est pas « un outil de plus ». C’est un moteur d’analyse de niveau institutionnel qui automatise tout le workflow Smart Money Concepts et transfor
FREE

Institutional Tick Engine Lite: Outil de Vélocité des Ticks et de Renversement Institutional Tick Engine Lite est un indicateur technique conçu pour analyser la vélocité du marché et la logique de microstructure à l'aide de données tick brutes. Il fournit des métriques en temps réel pour le scalping et le day trading. Fonctionnalités Incluses Moniteur de Vélocité: Histogramme en temps réel affichant les "Ticks Par Seconde" (TPS). Signaux de Renversement (Lite): Identifie les points de retourneme
FREE
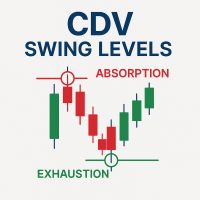
Cumulative Delta Volume (CDV) Swing Level - Absorption & Exhaustion Detector
Full Documentation: [ Download PDF ] CDV Swing Aggressive Score Guide : [ Download PDF ] Free Professional Education Course: After purchasing, contact me to receive access to the complete CDV Professional Training Video Course.
Professional CDV Analysis for Market Reversals This indicator identifies CDV absorption and exhaustion patterns to detect precise market turning points. It analyzes cumulative delta vo

If you like this free tool, check out my EA which is currently on a Launch Sale for only $39 ! https://www.mql5.com/zh/market/product/159451?source=Site Short Description: A specialized technical indicator designed for Gold (XAUUSD) trading. It automatically identifies market swings, plots key 0.382 and 0.618 Fibonacci retracement levels, and sen mobile push nothiations not sat 面紙 面 面 面面 筆/內托are detected. 【Key Features】 Dual Monitoring Mode: Simultaneously tracks the 0.382 (Shallow Retracement)
FREE

Ritz Smart Detection BUY & SELL
The Ritz Smart Detection BUY & SELL is a next-generation trading indicator engineered to detect high-probability entry signals by combining ATR-based volatility measurement , trend reversal detection , and smart alerting technology . It delivers real-time BUY/SELL opportunities with adaptive targets and risk levels, making it a versatile tool for both scalpers and swing traders. Core Market Logic ATR-Driven Volatility Analysis Uses multiple ATR methods (SMA, EMA,
FREE

VWAP, or volume-weighted average price, helps traders and investors observe the average price that major traders consider the "fair price" for that move. VWAP is used by many institutions to set up large operations.
In this indicator, you can enjoy the following features:
Daily VWAP, with option to display your current price next to the chart VWAP Weekly, with option to display your current price next to the chart Monthly VWAP, with option to display your current price next to the chart
FREE
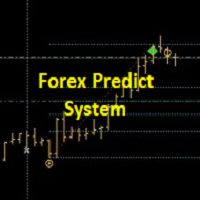
+++++++++++++++++++++++++++++++++++++++++++++++++++++++++++++++++++++++++++++++++++++++++++++++++ +++ Link to EURUSD Only Free Version --> https://www.mql5.com/en/market/product/156904?source=Unknown +++++++++++++++++++++++++++++++++++++++++++++++++++++++++++++++++++++++++++++++++++++++++++++++++ Hallo Trader, This is a traditional GANN & FIBONACCI strategy based on detection of an impulsive move in the opposite direction. This is called a Breakout. At the moment of Breakout, the indicator draw

SmartScalp M1 – Fast Scalping with Accurate Trends and Clean Signals SmartScalp M1 is a high-speed scalping indicator optimized specifically for the M1 timeframe. It combines Supertrend and Heiken Ashi to identify clear trend reversals and effectively filter market noise. BUY and SELL signals are generated when the Supertrend flips and are confirmed by Heiken Ashi candle colors, significantly reducing false signals in choppy market conditions. The indicator performs best on high-volatility ins

non-repaint free MT5 technical indicator works on all timeframes 1 minute to the monthly timeframe the trade vision buy and sell arrow is a multi currency and synthetic indicator Trade vision buy and sell arrow comes with Push Alerts purple arrow look for selling opportunities white arrow look for buying opportunities. wait for candle to close and arrow to appear before taking any trades.
FREE

The Volume Profile Fixed Range indicator is a powerful tool designed for MetaTrader 5 (MT5) platforms. It visualizes the distribution of trading volume over a fixed historical range of bars, helping traders identify key price levels where significant volume has accumulated. This aids in spotting support/resistance zones, value areas, and potential reversal or breakout points. Below is a detailed description of its features:
Key Features: - Fixed Range Analysis: Analyzes volume profile based on
FREE

YOU CAN NOW DOWNLOAD FREE VERSIONS OF OUR PAID INDICATORS . IT'S OUR WAY OF GIVING BACK TO THE COMMUNITY ! >>> GO HERE TO DOWNLOAD
This system is an Heiken Ashi system based on RSI calculations . The system is a free open source script originally published on TradingView by JayRogers . We have taken the liberty of converting the pine script to Mq4 indicator . We have also added a new feature which enables to filter signals and reduces noise on the arrow signals.
Background
HEIKEN ASHI
Th
FREE

Trend Line Map indicator is an addons for Trend Screener Indicator . It's working as a scanner for all signals generated by Trend screener ( Trend Line Signals ) . It's a Trend Line Scanner based on Trend Screener Indicator. If you don't have Trend Screener Pro Indicator, the Trend Line Map Pro will not work. LIMITED TIME OFFER : Trend Line Map Indicator is available for only 50 $ and lifetime. ( Original price 125$ )
By accessing to our MQL5 Blog, you can find all our premium indicat

Haven Bands Reversion – Un indicateur professionnel pour le trading de retour à la moyenne Découvrez Haven Bands Reversion – un outil puissant et précis, conçu pour les traders qui utilisent des stratégies de retour à la moyenne. Contrairement aux Bandes de Bollinger classiques, cet indicateur est basé sur la Moyenne Mobile Pondérée par les Volumes (VWMA) , ce qui rend ses canaux plus sensibles à l'activité réelle du marché. Plus important encore, l'indicateur génère des signaux qui ne se redess
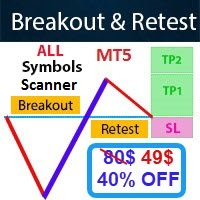
- Real price is 80$ - 40% Discount (It is 49$ now) Contact me for instruction, any questions! - Non-repaint - I just sell my products in Elif Kaya Profile, any other websites are stolen old versions, So no any new updates or support. - Lifetime update free Related product: Bitcoin Expert Introduction The Breakout and Retest strategy is traded support and resistance levels. it involves price breaking through a previous level. The break and retest strategy is designed to help traders do two main

Discover the power of harmony in the markets with this advanced harmonic pattern indicator. Designed for demanding technical traders, this indicator automatically detects 11 of the most popular harmonic patterns, including the Gartley, Bat, Crab, Butterfly, Shark, Cypher, and many more.
Thanks to its dynamic dashboard, you can easily manage the visibility of patterns on the chart, activating or deactivating the ones you want in real time without overloading your platform. This flexibility allo
FREE

Lion Arrow Super Arrow Indicator for MetaTrader 5
The Lion Arrow Super Arrow Indicator for MetaTrader 5 is a hybrid trading system that integrates multiple advanced technical analysis tools to generate high-quality trading signals. By combining trend, momentum, and pressure-based indicators, it aims to reduce false signals and improve entry accuracy. Core Components of the Indicator The Lion Arrow Super Arrow indicator is built on several key analytical elements: Fast Moving Average: Reacts qui
FREE

A top-quality implementation of the famous Super Trend indicator, which needs no introduction. It is completely loyal to the original algorithm, and implements many other useful features such as a multi-timeframe dashboard. [ Installation Guide | Update Guide | Troubleshooting | FAQ | All Products ] Easy to trade It implements alerts of all kinds It implements a multi-timeframe dashboard It is non-repainting and non-backpainting Input Parameters
ATR Period - This is the average true range peri
FREE

RiskKILLER_AI Navigator est un Assistant de Direction de Marché et de Stratégie Multi-timeframe basé sur l'IA. La performance en trading consiste à comprendre le marché comme le font les professionnels. C'est exactement ce que propose le RiskKILLER_AI Navigator : Bénéficiez d'analyses institutionnelles avec l'analyse de tendance, de sentiment et macro driven par l'IA externe à MQL5 , adaptée à votre style de trading. Après l'achat, pour obtenir le Manuel de l'Utilisateur : 1. postez un commentai
Indicateur Trend BB MACD avec filtre ADX L' indicateur Trend BB MACD avec filtre ADX est un outil technique avancé qui combine les bandes de Bollinger (BB) , le MACD et l' Average Directional Index (ADX) . Il intègre désormais un système complet d'analyse directionnelle avec +DI et -DI , ainsi que des options de confirmation croisée avec le MACD. Il est conçu pour offrir des signaux de trading précis et filtrés, optimisés pour le scalping , le trading intraday et le swing trading , aidant à ide
FREE

Volumes with Moving Average est un indicateur de volume simple et direct complété par une moyenne mobile.
Comment l'utiliser ?
Il est bien adapté pour filtrer les signaux lors de l'entrée dans une transaction à la fois à partir des niveaux de support/résistance et lors des ruptures de volatilité des canaux de tendance. Il peut également servir de signal pour fermer une position en fonction du volume.
Paramètres d'entrée :
Volumes - volume réel ou tic-tac. MA_period - période de la moyenne m
FREE

Capture every opportunity: your go-to indicator for profitable trend trading Trend Trading is an indicator designed to profit as much as possible from trends taking place in the market, by timing pullbacks and breakouts. It finds trading opportunities by analyzing what the price is doing during established trends. [ Installation Guide | Update Guide | Troubleshooting | FAQ | All Products ]
Trade financial markets with confidence and efficiency Profit from established trends without getting whip

Price Volume Distribution
Indicateur Volume Profile analysant la distribution du volume de trading par niveau de prix. Affiche POC, Value Area, pics de volume et filtrage de signaux base sur les zones pour MT5.
Apercu
Price Volume Distribution est un indicateur d'analyse de volume pour MetaTrader 5. Il calcule et affiche la distribution du volume sur les niveaux de prix en utilisant les donnees du timeframe M1, fournissant une representation visuelle par des barres d'histogramme et des lignes

HiperCube AutoTrend Lines Code de réduction de 20% sur Darwinex Zero : DWZ2328770MGM_20 Cet indicateur vous aide à identifier facilement les supports et les résistances, à tracer des lignes dans le graphique et à savoir où se trouve un point important sur le marché. Cet outil est le meilleur moyen d'automatiser partiellement votre trading, en faisant une partie du travail à votre place. La résistance ou le support sont des niveaux importants qui sont parfois difficiles à identifier, mais mainte
FREE

Introducing the MACD Enhanced – an advanced MACD (Moving Average Convergence Divergence) indicator that provides traders with extended capabilities for trend and momentum analysis in financial markets. The indicator uses the difference between the fast and slow exponential moving averages to determine momentum, direction, and strength of the trend, creating clear visual signals for potential entry and exit points. Attention! To achieve the best results, it is recommended to adapt the indicator
FREE
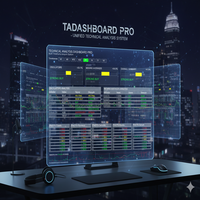
Technical Analysis Dashboard Pro (TADashboard Pro) – Système Unifié d'Analyse Technique TADashboard Pro est un tableau de bord d'analyse technique avancé qui consolide de multiples indicateurs et unités de temps ( timeframes ) dans une interface visuelle unique. Conçu pour les traders qui exigent précision et efficacité , le système analyse simultanément 7 oscillateurs et 4 moyennes mobiles sur 8 unités de temps différentes , générant des scores normalisés qui simplifient la prise de décision. C
FREE

BlueBoat – Prime Cycle is a technical indicator for MetaTrader 5 that visualizes market cycles based on the Fimathe cycle model (Marcelo Ferreira) . It identifies and displays historic and live cycle structures such as CA, C1, C2, C3, etc., helping traders understand the rhythm and timing of price movement across multiple sessions. This tool is ideal for manual analysis or as a supporting signal in discretionary strategies. Key Features Historical Cycle Analysis – Backtest and visualize as many
Assistant intelligent pour les entrées précises et opportunes sur le marché. L'indicateur émet un bip et des alertes lorsque le prix atteint les niveaux. Vous pouvez définir manuellement les niveaux de support et de résistance ou le confier à un algorithme. Au moment où le prix atteint le niveau, en outre, les motifs de bougies sont marqués. Les modèles de chandeliers uniques sont une symbiose des modèles classiques et des modèles de rupture et de rupture des niveaux. Pour un commerce très renta
FREE

This indicator plots the volume profile by Price on the chart
There are 5 ways to view it:
By Total Volume Traded (Premium Version); Volume Ticks(Forex) Separated by Buyers and Sellers (Premium Version); Buyers Only (Premium Version); Sellers Only (Premium Version); Business balance (Buyers - Sellers) (Premium Version); .
It is possible to select how many days the profiles will be calculated.( Premium Version)
On the current day it recalculates the histogram data for each new candlestick.
FREE

Daily VWAP Indicator (Volume Weighted Average Price) Special Deal! Leave a review and get the indicator Long & Short Cointegration Analyzer for free — just send me a message!
Description The Daily VWAP (Volume Weighted Average Price) indicator is an essential tool for traders seeking to identify the true average price of an asset throughout the day, adjusted by traded volume. Primarily used by institutional and professional traders, the daily VWAP serves as a reference point to identify the av
FREE

Bienvenue dans l'indicateur avancé de reconnaissance de formes Gartley Cet indicateur détecte le modèle Gartley basé sur HH et LL de la structure des prix et les niveaux de Fibonacci, et lorsque certains niveaux fib sont atteints, l'indicateur affichera le modèle sur le graphique. Version MT4 : WH Advanced Gartley Pattern MT4 **Cet indicateur fait partie du combo Ultimate Harmonic Patterns MT5 , qui inclut toute la reconnaissance des formes.**
Caractéristiques : Algorithme avancé pour
FREE

TickFlow is a tool for tick-data analysis and visual highlighting of significant zones on the chart. The utility aggregates current and historical ticks, shows the buy/sell balance, and helps to identify support/resistance levels and cluster zones. This is the MetaTrader 4 version. How it works (brief) TickFlow collects tick data and aggregates it by price steps and candles. Based on the collected data the indicator builds visual layers: up/down tick counters, buy/sell ratio, historical levels

It is a MetaTrader 5 integrated drawing tool inspired on the "Pointofix" software. You can paint, make annotations and drawings on the chart in real time. It works in multiple timeframes, that is, the drawings can be visualized in different timeframes. The drawings are also saved in files and can be restored even on MetaTrader restarting.
Simple and Pratical
Chart Pen is designed as simple, beautiful and innovative way to create and manage all your chart analysis. There is no existing drawing
FREE
Engulfing Zone Sniper MT5 — Multi-Timeframe Signal & Zone Indicator The Engulfing Zone Sniper MT5 is a technical analysis tool designed to highlight engulfing candlestick patterns in combination with adaptive support/resistance zones. It provides visual markers and optional alerts to assist traders in identifying market structure reactions across multiple timeframes. Key Features Multi-Timeframe Detection – Option to scan higher timeframe engulfing setups with lower timeframe confirmation. Su

Are You Tired Of Getting Hunted By Spikes And Whipsaws?
Don't become a victim of the market's erratic moves.. Do Something About It!
Instantly make smarter decisions with Impulse Pro's precise balance of filters and accurate statistics.
Timing Is Everything In Trading
To learn more, please visit www.mql5.com/en/blogs/post/718212 Anticipate the next big move before it unfolds in 3 Simple Steps!
Advantages You Get
Early impulse detection algorithm.
Flexible combination to different trading s
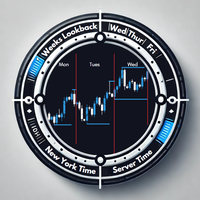
Overview The Daily Session Separator indicator is a powerful tool designed to enhance your trading experience by clearly marking daily trading sessions on your chart. It helps traders visualize daily boundaries, session highs and lows, and essential day-specific data to make informed decisions. With its seamless integration into any chart and dynamic adaptability, this indicator is a must-have for traders who rely on precision and clarity. Key Features Daily Session Separators Automatically adds
FREE

Ekom Spike Detector Pro
Take your trading to the next level with the Ekom Boom and Crash Spike Detector Indicator Pro, designed for serious traders who demand more. This advanced version provides: Key Features: Accurate Spike Detection: Identify high-probability spike patterns in real-time using price action Clear Visual Signals: Displays clear buy and sell arrows on the chart for easy decision-making Alert options : MT5 Alert/Notification to receive alerts on your mobile when signal
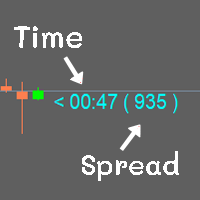
Show the time of candlesticks and spread. All data will be displayed in a rod. Can change color Can fix the size as needed
MT4 : Link https://www.mql5.com/en/market/product/102742 MT5 : Link https://www.mql5.com/en/market/product/102834
Most free code on various websites I didn't write it myself. I only do a little bit.
If you like it, please give 5 stars with it. Thank you.
FREE

The Advanced Trend Scalper MT5 indicator is designed to help both novices and professional traders. The indicator analyses the market and gives you buy and sell signals. It does not use any other indicators, it works only with the market actions. The signal appears right after the candle close and it does not repaint. The efficient algorithm provides a high degree of reliability of such signals. Advanced Trend Scalpe r for the MetaTrader 4 terminal : https://www.mql5.com/en/market/product/
MetaTrader Market - les robots de trading et les indicateurs techniques pour les traders sont disponibles directement dans votre terminal de trading.
Le système de paiement MQL5.community est disponible pour tous les utilisateurs enregistrés du site MQL5.com pour les transactions sur les Services MetaTrader. Vous pouvez déposer et retirer de l'argent en utilisant WebMoney, PayPal ou une carte bancaire.
Vous manquez des opportunités de trading :
- Applications de trading gratuites
- Plus de 8 000 signaux à copier
- Actualités économiques pour explorer les marchés financiers
Inscription
Se connecter
Si vous n'avez pas de compte, veuillez vous inscrire
Autorisez l'utilisation de cookies pour vous connecter au site Web MQL5.com.
Veuillez activer les paramètres nécessaires dans votre navigateur, sinon vous ne pourrez pas vous connecter.