MetaTrader 5용 기술 지표 - 6

FREE

Smart Structure Concepts MT5 is an all-in-one Smart Money Concepts indicator created to help traders visually read institutional structure and understand why each movement occurs. Unlike most indicators on the Market, this system does not only draw patterns or zones. It teaches.
Every visual element (BOS, CHoCH, OB, FVG, EQH, EQL, PDH, PDL, etc.) includes educational tooltips that explain the concept and the suggested trader action (buy, sell, or wait).
These on-chart explanations make it perfe
FREE

YOU CAN NOW DOWNLOAD FREE VERSIONS OF OUR PAID INDICATORS . IT'S OUR WAY OF GIVING BACK TO THE COMMUNITY ! >>> GO HERE TO DOWNLOAD
This system is an Heiken Ashi system based on RSI calculations . The system is a free open source script originally published on TradingView by JayRogers . We have taken the liberty of converting the pine script to Mq4 indicator . We have also added a new feature which enables to filter signals and reduces noise on the arrow signals.
Background
HEIKEN ASHI
Th
FREE

LEVEL 3 POWER INDICATOR
The Professional’s Timing Masterpiece
Stop guessing market turns. Start seeing them before they happen.
---
Are You Missing Out on Big Moves?
Entering trades just before the market reverses?
Unsure whether a trend is truly over—or simply pausing?
Struggling with confidence when holding trades?
You’re not alone. Most traders wrestle with these exact challenges… until they discover the Level 3 Power Indicator.
---
The Game-Changing “Traffic Light” Syst
FREE
Special offer : ALL TOOLS , just $35 each! New tools will be $30 for the first week or the first 3 purchases ! Trading Tools Channel on MQL5 : Join my MQL5 channel to update the latest news from me 개요
OA SnR Power는 트레이더가 지지와 저항 레벨의 강도를 식별하고 평가하도록 설계된 강력한 도구입니다. 거래량, 반등 빈도 및 재테스트 횟수와 같은 주요 요소를 통합하여 이 지표는 시장의 주요 가격 영역에 대한 종합적인 뷰를 제공합니다. 더 많은 제품 보기: 모든 제품 OA SnR Power의 작동 원리 고점과 저점 식별 이 지표는 지역 고점과 저점을 계산하기 위해 지능형 알고리즘을 사용합니다. 사용자는 영역 폭 설정을 조정하여 잠재적인 지지 및 저항 수준을 정확하게 탐지할 수 있습니다. 주요
FREE
트렌드 BB MACD ADX 필터 지표 트렌드 BB MACD ADX 필터 는 볼린저 밴드(BB) , MACD , 그리고 **평균 방향성 지수(ADX)**를 결합한 고급 기술적 도구입니다. 이제 +DI 와 -DI 를 사용한 완전한 방향 분석 시스템과 MACD와의 교차 확인 옵션을 포함합니다. 이 지표는 스캘핑 , 단타매매 , 스윙 트레이딩 에 최적화된 정확하고 필터링된 트레이딩 신호를 제공하도록 설계되었으며, 추세의 방향뿐만 아니라 강도와 신뢰성을 파악하는 데 도움을 줍니다. 주요 구성 요소 볼린저 밴드 (BB) BB 미들 (중심선): 단순 이동 평균(SMA). BB 상단 / BB 하단: SMA ± (표준 편차 × 승수). 전체 맞춤 설정: 색상, 두께, 라인 스타일을 조정할 수 있습니다. 하이브리드 신호 (Hybrid Signal) MACD 라인(히스토그램 아님)과 BB 미들을 결합하고 그 값을 스케일링하여 동적 신호를 생성합니다. 스마트 색상 시스템: 녹색: ADX와 +DI로 확인
FREE

피벗 포인트(Pivot Points) 지표 는 데이 트레이더와 스윙 트레이더를 위해 핵심적인 지지선과 저항선을 계산합니다. 모든 타임프레임에서 반전 지점을 식별하고, 목표 설정 및 리스크 관리를 하는 데 이상적입니다. 데이 트레이더용
진입 및 청산을 위한 핵심 레벨 식별 손절매 및 목표가 설정 일중 반전 가능성 인식 스윙 트레이더용
주간 / 월간 지지·저항 구간 식별 중기 포지션 계획 추세 분석 보완 스캘퍼용(Scalpers)
빠른 거래를 위한 기준 레벨 더 작은 타임프레임에서의 의사결정 포인트 ....................................................................................................
FREE

MACD divergence indicator finds divergences between price chart and MACD indicator and informs you with alerts (popup, mobile notification or email) . Its main use is to find trend reversals in the chart. Always use the divergence indicators with other technical assets like support resistance zones, candlestick patterns and price action to have a higher possibility to find trend reversals. Three confirmation type for MACD divergences: MACD line cross zero level Price returns to previous H/L Crea
FREE

이 프로젝트를 좋아한다면 5 스타 리뷰를 남겨주세요. 이 지표는 열리고, 높은, 낮은 및 마감 가격을 지정합니다.
기간과 그것은 특정한 시간대를 위해 조정될 수 있습니다. 이들은 많은 기관 및 전문가에 의해 보는 중요한 수준입니다
상인은 당신이 더 많은 것일 수있는 장소를 알고 도움이 될 수 있습니다
이름 * 사용 가능한 기간: 이전 날. 이전 주. 지난 달. 이전 분기. 이전 연도. 또는: 현재 날. 현재 주. 현재 달. 현재 분기. 현재 년.
FREE
가격 행동 거래를 강화하세요. Higher Highs and Lows MT5 지표는 플랙탈 분석을 활용하여 주요 스윙 포인트를 정확히 파악하고, Higher Highs (HH), Lower Highs (LH), Lower Lows (LL), Higher Lows (HL) 같은 트렌드 정의 패턴을 식별하여 시장 방향에 대한 명확한 통찰을 제공합니다. 1900년대 초 다우 이론에 뿌리를 둔 가격 행동의 기본 원칙에 기반하며, 현대 거래에서 Al Brooks의 "Trading Price Action" 시리즈와 같은 전문가에 의해 대중화된 이 지표는 트렌드 지속과 반전을 탐지하는 트레이더에게 필수적입니다. 특히 외환, 주식, 암호화폐 트레이더 사이에서 인기 있으며, 상승 트렌드 (HH/HL) 또는 하락 트렌드 (LL/LH)를 확인하는 능력으로 노이즈를 필터링하고, 풀백 중 입장 타이밍을 정하며, 가짜 브레이크아웃을 피하는 데 도움을 줍니다—변동성 세션에서 정확성을 높이고, 감정적 결정을
FREE

Market Structure CHoCH/BOS Indicator for MT5 Overview
The Market Structure CHoCH/BOS (Fractal) indicator identifies key shifts in market direction based on fractal-based structural analysis. It automatically detects Change of Character (CHoCH) and Break of Structure (BOS) signals, two essential concepts in modern price action and Smart Money trading. How It Works
The indicator analyzes swing highs and lows using a fractal algorithm defined by the Length parameter. When price crosses a previous

Trend Hunter 는 Forex, 암호화폐 및 CFD 시장에서 작업하기 위한 추세 지표입니다. 이 지표의 특별한 특징은 가격이 추세선을 약간 돌파할 때 신호를 변경하지 않고 자신있게 추세를 따른다는 것입니다. 표시기는 다시 그려지지 않으며 막대가 닫힌 후에 시장 진입 신호가 나타납니다.
추세를 따라 이동할 때 표시기는 추세 방향에 대한 추가 진입점을 표시합니다. 이러한 신호를 바탕으로 작은 StopLoss로 거래할 수 있습니다.
Trend Hunter 는 정직한 지표입니다. 표시 신호 위로 마우스를 가져가면 신호의 잠재적 이익과 가능한 중지가 표시됩니다.
새로운 신호가 나타나면 다음 알림을 받을 수 있습니다. 알리다 푸시 알림 이메일로 알림 텔레그램 알림 차트 스크린샷도 텔레그램으로 전송되므로 거래 결정을 내리기 위해 단말기를 열 필요가 없습니다.
표시 신호는 텔레그램 채널 https://www.mql5.com/ko/market/product/11085#!tab=com

Haven HTF Candle — 차트에서 더 높은 타임프레임의 힘 Haven HTF Candle 을 소개합니다 — 더 높은 타임프레임(HTF)의 캔들을 작업 차트에 직접 표시하는 강력한 도구입니다. 더 이상 창을 계속 전환하지 말고, 정보에 입각한 거래 결정을 내리는 기초가 되는 진정한 시장 상황을 파악하세요. 기타 제품 -> 여기 . 주요 기능 및 "Power of 3" 개념 "Power of 3"(AMD) 개념 기반 분석: 이 지표는 이 전략의 핵심 수준인 HTF 캔들의 시가 를 명확하게 표시합니다. 더 낮은 타임프레임에 있으면서 축적(Accumulation), 조작(Manipulation, Judas Swing) 및 분배(Distribution) 단계를 쉽게 식별할 수 있습니다. 즉각적인 추세 평가: 현재 타임프레임의 움직임이 더 큰 그림 안에서 임펄스인지 조정인지 신속하게 파악할 수 있습니다. 시각적 편의성: HTF 캔들의 위치, 색상 및 개수를 완전히 사용자 정의하여 불
FREE

This indicator has been developed to identify and display these trends quickly and easily, allowing you to see instantly, those currency pairs which are trending, and those which are not – and in all timeframes, with just one click. The 28 currency pairs are displayed as a fan as they sweep from strong to weak and back again, and this is why we call it the ‘currency array’. All 28 pairs are arrayed before you, giving an instant visual description of those pairs that are trending strongly, those
SEER SPIKE DETECTOR
The Ultimate Market-Reversal & Spike Forecasting Tool for Crash & Boom Indices, Forex & Synthetic Markets
SPECIAL BONUS (VALID TILL JUNE 2026)- OUR DAILY SCALPER EA for BTCUSD and VIX75 •·································································•

Adaptive Volatility Range [AVR] - is a powerful tool for identifying key trend reversals. AVR - accurately displays the Average True Volatility Range taking into account the Volume Weighted Average price. The indicator allows you to adapt to absolutely any market volatility by calculating the average volatility over a certain period of time - this provides a stable indicator of positive transactions. Thanks to this , Adaptive Volatility Range has a high Winrate of 95% There are two ways t
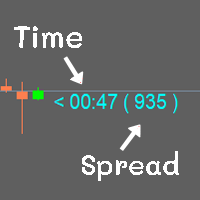
Show the time of candlesticks and spread. All data will be displayed in a rod. Can change color Can fix the size as needed
MT4 : Link https://www.mql5.com/en/market/product/102742 MT5 : Link https://www.mql5.com/en/market/product/102834
Most free code on various websites I didn't write it myself. I only do a little bit.
If you like it, please give 5 stars with it. Thank you.
FREE

** All Symbols x All Timeframes scan just by pressing scanner button ** Discount: The price is $50$, But now it is just $39, Limited time offer is active.
*** Contact me to send you instruction and add you in "Trend Reversal group" for sharing or seeing experiences with other users. Introduction: Trendlines are the most famous technical analysis in trading . Trendlines continually form on the charts of markets across all the different timeframes providing huge opportunities for traders

HiperCube AutoTrend Lines 다윈엑스 제로 20% 할인 코드: DWZ2328770MGM_20 이 지표는 쉽게 지지선과 저항선을 식별하고, 차트에 선을 그리고, 시장에서 중요한 지점이 어디인지 알 수 있도록 도와줍니다. 이 도구는 일부 작업을 대신하여 거래를 반자동화하는 가장 좋은 방법입니다. 저항선 또는 지지선은 때때로 식별하기 어려운 중요한 수준이지만, 이제는 더 이상 혼란스럽지 않습니다.
HiperCube Autotrends는 모든 시간대에 맞게 설계되었습니다. 모든 종류의 전략, 스캘핑, 스윙, 일중... 모든 시장, 외환, 상품, 지수, 암호화폐... XAU, EURUSD, BTC, US30 또는 원하는 곳에서 사용할 수 있습니다. Chat gpt와 AI를 사용하여 개발되었습니다. 계정: 원하는 곳에서 실제 또는 데모로 사용하세요. 모든 종류의 계정은 네팅 또는 헤징에 유효합니다.
기능 사용하기 쉬움 유용한 옵션으로 준비됨 저항선과 지지선을 사용자 정의
FREE
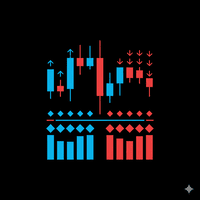
TrendPower All-In-One Strict v1.00 Description TrendPower All-In-One Strict is a comprehensive trend-following trading system designed for MetaTrader 5. It acts as a "confluence detector," meaning it filters market noise by requiring multiple technical indicators to agree before generating a signal. The indicator utilizes a "Strict" logic engine, meaning a signal is only generated when momentum, trend direction, and volatility filters all align perfectly. It displays data in a separate sub-win

Introduction
Reversal Candles is a cutting-edge non-repainting forex indicator designed to predict price reversals with remarkable accuracy through a sophisticated combination of signals.
Signal Buy when the last closed candle has a darker color (customizable) and an up arrow is painted below it Sell when the last closed candle has a darker color (customizable) and a down arrow is painted above it
FREE

왜 대부분의 RSI 다이버전스 인디케이터는 지연되거나 리페인트가 발생하는가 RSI 다이버전스 인디케이터를 충분히 사용해 본 트레이더라면, 보통 다음 두 가지 상황 중 하나를 경험했을 것입니다. 신호가 너무 늦게 나타나거나,
이미 표시된 다이버전스 신호가 나중에 사라지는 경우입니다. 이 문제는 인디케이터가 “잘못 만들어서” 발생하는 것이 아닙니다.
다이버전스 자체의 계산 논리에는 피할 수 없는 트레이드오프 가 존재하기 때문입니다. 다이버전스를 최대한 빠르게 표시하려면 리페인트를 어느 정도 허용해야 하고,
리페인트를 완전히 피하려면 일정한 지연은 불가피합니다. 이 인디케이터는 이 두 극단 사이에서 보다 합리적인 균형점을 찾기 위해 설계되었습니다. 다이버전스가 지연될 수밖에 없는 이유 다이버전스는 본질적으로
두 개의 고점 또는 두 개의 저점을 비교하는 개념입니다. 문제는 고점이나 저점이
가격이 되돌림을 보인 이후에야 비로소 확정될 수 있다 는 점입니다. 되돌림이 발생하기 전까지의 고점·저
FREE
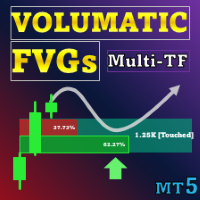
특별 할인 : ALL TOOLS , 개당 $35 . 신규 도구 는 $30 첫 주 또는 처음 3회 구매 에 한해 제공됩니다! Trading Tools Channel on MQL5 : 최신 소식을 받으려면 제 MQL5 채널에 참여하세요 Volumatic Fair Value Gaps (FVG)은 의미 있는 가격 불균형 구역을 식별·유지하고, 각 갭 내부의 방향성 거래량을 분해합니다. 거래량은 하위 시간프레임(기본 M1, 사용자 선택 가능)에서 샘플링되며, 매수/매도 비중으로 나뉘어 합계가 100%인 두 개의 퍼센트 바로 표시됩니다. 각 FVG의 오른쪽에는 총 거래량 라벨도 표시됩니다. 사용자 설정에 따라 가격이 반대 경계를 종가로 돌파(더 엄격)하거나 고가/저가의 심지로 접촉(더 민감)할 때 갭은 완화되어 제거됩니다.
MT5 버전 더보기: Volumatic Fair Value Gaps MT5 Multi Timeframe MT4 버전 더보기: Volumatic F

멀티 타임프레임 추세 분석 도구 차트를 계속 전환하지 않고 여러 타임프레임에서 추세를 추적하고 싶으신가요? Smart Trend Consensus MT5 는 7개의 타임프레임을 동시에 (M1, M5, M15, M30, H1, H4, D1) 데이터를 통합하는 기술적 분석 도구입니다. 이 지표는 7개의 기술적 기준 을 사용하여 각 타임프레임의 추세 상태를 평가하고 모든 정보를 시각적 대시보드에 표시합니다. 트레이더가 시장 모니터링 시간을 절약하는 데 도움이 되는 다차원 분석 도구입니다. User Guide | Other languages 주요 기능 7 타임프레임 실시간 분석 단일 대시보드에서 M1부터 D1까지 모니터링. 여러 타임프레임을 비교하기 위해 차트를 전환하거나 수동으로 계산할 필요가 없습니다. 7기준 평가 시스템 각 타임프레임은 7가지 기술적 요소를 기반으로 분석됩니다: ADX 방향 지수 (+DI vs -DI) EMA50 위치 (가격 vs 빠른 이동평균)

Necessary for traders: tools and indicators Waves automatically calculate indicators, channel trend trading Perfect trend-wave automatic calculation channel calculation , MT4 Perfect trend-wave automatic calculation channel calculation , MT5 Local Trading copying Easy And Fast Copy , MT4 Easy And Fast Copy , MT5 Local Trading copying For DEMO Easy And Fast Copy , MT4 DEMO Easy And Fast Copy , MT5
DEMO
砖图 Renko PRO->>>
The display of the brick map on the main map.
The Renko chart ideally r
FREE

This indicator provides the ability to recognize the SMC pattern, essentially a condensed version of the Wyckoff model. Once the pattern is confirmed by RTO, it represents a significant investment opportunity. There are numerous indicators related to SMC beyond the market, but this is the first indicator to leverage patterns to identify specific actions of BigBoy to navigate the market. The SMC (Smart Money Concept) pattern is a market analysis method used to understand the behavior of "smart

Introducing Indicator for PainX and GainX Indices Traders on Weltrade Get ready to experience the power of trading with our indicator, specifically designed for Weltrade broker's PainX and GainX Indices. Advanced Strategies for Unbeatable Insights Our indicator employs sophisticated strategies to analyze market trends, pinpointing optimal entry and exit points. Optimized for Maximum Performance To ensure optimal results, our indicator is carefully calibrated for 5-minute timeframe charts on

A top-quality implementation of the famous Super Trend indicator, which needs no introduction. It is completely loyal to the original algorithm, and implements many other useful features such as a multi-timeframe dashboard. [ Installation Guide | Update Guide | Troubleshooting | FAQ | All Products ] Easy to trade It implements alerts of all kinds It implements a multi-timeframe dashboard It is non-repainting and non-backpainting Input Parameters
ATR Period - This is the average true range peri
FREE
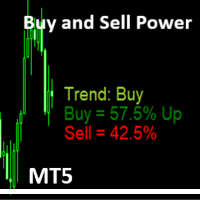
Simple Indicator that shows the Buy and Sell volume in percent. The Buy and Sell Power indicator for MetaTrader 5 calculates and displays estimated buy/sell volume percentages over a user-defined period (default: 14 bars) using tick volume data. It overlays text labels on the chart showing Buy % (with "Up" if >51%), Sell % (with "Dn" if >51%), and a trend signal based on thresholds: Neutral (<55%), Trend: Buy/Sell (55%+), Trend: Strong Buy/Sell (62%+), Trend Max UP/Down (65%+), or Trend change s
FREE

Benefits and Usage of the Volume Bubble Tool This tool, (one of my favorites by Algo Alpha, from Tradingview) provides an advanced method of volume analysis by moving beyond traditional histograms. It leverages statistical normalization (Z-score) on lower-timeframe data to identify and classify statistically significant volume events, visualizing the dynamic between "Smart Money" (institutional) and "Retail" participants. Core Benefits Intuitive On-Chart Visualization: By plotting volume as bub

소개 Quantum Breakout PRO , 브레이크아웃 존 거래 방식을 변화시키는 획기적인 MQL5 지표! 13년 이상의 거래 경험을 가진 숙련된 트레이더 팀이 개발한 퀀텀 브레이크아웃 PRO 혁신적이고 역동적인 브레이크아웃 존 전략으로 거래 여정을 새로운 차원으로 끌어올리도록 설계되었습니다.
Quantum Breakout Indicator는 5개의 이익 목표 영역이 있는 브레이크아웃 영역의 신호 화살표와 브레이크아웃 상자를 기반으로 한 손절 제안을 제공합니다.
초보자 거래자와 전문 거래자 모두에게 적합합니다.
Quantum EA 채널: 여기를 클릭하세요
중요한! 구매 후 설치 매뉴얼을 받으려면 개인 메시지를 보내주십시오. 추천:
기간: M15 통화쌍: GBPJPY, EURJPY, USDJPY,NZDUSD, XAUUSD 계정 유형: 스프레드가 매우 낮은 ECN, Raw 또는 Razor 브로커 시간: GMT +3 중개인 :

After working during many months, with the help of Neural Networks, we have perfected the ultimate tool you are going to need for identifying key price levels (Supports and Resistances) and Supply and Demand zones. Perfectly suitable to trigger your trades, set up your future actions, decide your Take Profit and Stop Loss levels, and confirm the market direction. Price will always move between those levels, bouncing or breaking; from one zone to another, all the remaining movements are just mark

Royal Scalping Indicator is an advanced price adaptive indicator designed to generate high-quality trading signals. Built-in multi-timeframe and multi-currency capabilities make it even more powerful to have configurations based on different symbols and timeframes. This indicator is perfect for scalp trades as well as swing trades. Royal Scalping is not just an indicator, but a trading strategy itself. Features Price Adaptive Trend Detector Algorithm Multi-Timeframe and Multi-Currency Trend Low

피닉스 오토 피보나치 모니터 (MT5)
메타트레이더 5용 전문 피보나치 인텔리전스 및 스윙 분석 도구. 실시간 시각적 대시보드를 통해 주요 시장 스윙을 자동으로 탐지하고 고급 피보나치 되돌림 통찰력을 제공합니다.
개요
피닉스 오토 피보나치 모니터는 상위 시간대의 피벗 및 ATR 검증을 통해 주요 시장 스윙을 자동으로 식별한 후, 차트에 직접 지능형 피보나치 되돌림 수준을 표시합니다. 이 시스템은 0.0%, 23.6%, 38.2%, 50.0%, 61.8%, 100.0% 수준을 지속적으로 추적하며, 새로운 스윙이 형성될 때마다 동적으로 적응합니다.
각 피보나치 레벨은 다섯 가지 핵심 차원에서 분석됩니다: 정확한 가격, 강도 분류(검증된 터치 횟수에 기반한 강함/중간/약함), 거리 분류(현재 가격 대비 가깝음/중간/멀음), 마지막 상호작용 이후 바 수, 역할 상태(활성, 돌파, 미검증). 역할 로직은 가격 구조가 진화함에 따라 레벨이 존중되거나, 돌파되거나, 재점유되는 시점을 자동
FREE
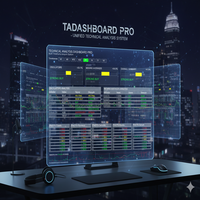
Technical Analysis Dashboard Pro (TADashboard Pro) – 통합 기술 분석 시스템 TADashboard Pro 는 여러 지표와 시간대를 하나의 시각적 인터페이스로 통합한 고급 기술 분석 패널입니다. 정확성과 효율성 을 요구하는 트레이더를 위해 설계된 이 시스템은 8가지 다른 시간대 에 걸쳐 7가지 오실레이터와 4가지 이동 평균 을 동시에 분석하며, 의사 결정을 단순화하는 정규화된 점수를 생성합니다. 주요 특징: 다중 시간대 분석 (Multi-Timeframe Analysis): 통합된 시각적 선택기로 M1, M5, M15, M30, H1, H4, D1, W1 기간을 쉽게 모니터링합니다. 고급 스코어링 시스템 (Advanced Scoring System): 오실레이터, 이동 평균, 그리고 전체 평가에 대한 독립적인 점수 ( $-100$ 에서 $+100$ ). 포함된 지표 (Included Indicators): RSI, MACD, Stochastic
FREE
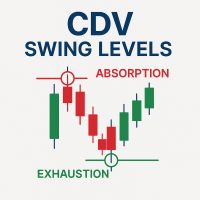
Cumulative Delta Volume (CDV) Swing Level - Absorption & Exhaustion Detector
Full Documentation: [ Download PDF ] CDV Swing Aggressive Score Guide : [ Download PDF ] Free Professional Education Course: After purchasing, contact me to receive access to the complete CDV Professional Training Video Course.
Professional CDV Analysis for Market Reversals This indicator identifies CDV absorption and exhaustion patterns to detect precise market turning points. It analyzes cumulative delta vo
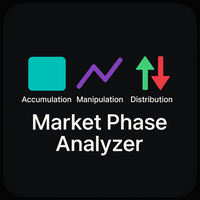
개요
명확한 신호와 간단한 규칙으로 시장의 세 가지 핵심 단계를 식별합니다. 이 지표는 아시아 세션을 기반으로 한 축적(Accumulation) 단계를 실시간으로 감지하고, 조작(Manipulation) 단계에서 유동성 스윕을 식별하며, 분배(Distribution) 단계에서 추세 방향을 확인합니다. 상승 단계에는 녹색 화살표, 하락 단계에는 빨간색 화살표를 표시하며, 아시아 박스의 색상과 테두리를 사용자 정의할 수 있고, 옵션으로 일일 시가 라인을 표시하여 신속한 인트라데이 분석을 지원합니다. 작동 원리
축적 단계에서 지표는 기록된 고점과 저점 사이에 박스를 생성합니다. 조작 단계에서는 가격이 박스 범위를 설정한 핍 수 이상 초과했는지 확인합니다. 분배 단계에서는 ATR 기반 확인 또는 고정 핍 돌파를 통해 단계 변화를 검증합니다. 조건이 충족되면 해당 화살표와 단계 레이블을 차트에 표시합니다. 3단계 거래 로직
축적(Accumulation) – 아시아 세션 시간을 설정하고
FREE

The trend is your friend!
Look at the color of the indicator and trade on that direction. It does not repaint. After each candle is closed, that's the color of the trend. You can focus on shorter faster trends or major trends, just test what's most suitable for the symbol and timeframe you trade. Simply change the "Length" parameter and the indicator will automatically adapt. You can also change the color, thickness and style of the lines. Download and give it a try! There are big movements w
ICONIC SMC Indicator — Trade with Institutional Clarity Finally, objective SMC—without the manual grind. Tired of spending hours marking charts only to miss the entry by a few pips? Doubting your read when real money is on the line? The era of subjective, time-consuming SMC is over. The ICONIC SMC Indicator is not “another tool.” It’s an institutional-grade analysis engine that automates the full Smart Money Concepts workflow and turns your chart into a live dashboard of high-probability opport
FREE

Opening‑Range Sessions (GMT‑Aware) 는 외환 시장의 주요 유동성 구간인 시드니·도쿄·런던·뉴욕 세션에 대해 오프닝 레인지(고점·저점과 색상 박스)를 자동으로 그리는 가벼운 인디케이터입니다. 브로커 서버의 GMT 오프셋을 실시간으로 감지하므로, 서버나 트레이더가 어디에 있든 각 세션이 정확한 현지 시각에 시작됩니다. 핵심 기능 자동 시간대 감지 – 서버 GMT 오프셋을 사용하므로 브로커·VPS를 바꿔도 수동 조정이 필요 없습니다. 네 가지 내장 세션 + 24시간 박스 – 시드니·도쿄·런던·뉴욕 세션과 하루 전체 박스를 개별적으로 켜고 끌 수 있습니다. 핍/퍼센트 모드 – 고정 핍 값 또는 시가 대비 백분율로 레인지를 정의합니다. 자정 교차 처리 – 자정을 넘는 세션(예: 시드니)도 박스가 끊기지 않고 올바르게 표시됩니다. 완전한 그래픽 커스터마이징 – 세션별 박스 색상, 라인 스타일·두께, 중앙 세션 라벨을 자유롭게 설정할 수 있습니다. 즉시 업데이트 – 파
FREE
FREE
+++++++++++++++++++++++++++++++++++++++++++++++++++++++++++++++++++++++++++++++++++++++++++++++++ +++ Link to EURUSD Only Free Version --> https://www.mql5.com/en/market/product/156904?source=Unknown +++++++++++++++++++++++++++++++++++++++++++++++++++++++++++++++++++++++++++++++++++++++++++++++++ Hallo Trader, This is a traditional GANN & FIBONACCI strategy based on detection of an impulsive move in the opposite direction. This is called a Breakout. At the moment of Breakout, the indicator draw
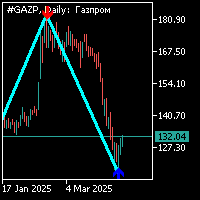
지그자그 표시기는 34 의 주기로 표준으로 추가 화살표 신호가 있습니다. 추가 신호는 지그재그 표시기와 별도로 계산됩니다.이 표시기에 대한 작업은 다음과 같습니다. 지그재그 표시기의 세그먼트를 형성하고 추가 화살표 신호가 나타날 때 화살표 방향으로 위치를 열어야합니다. 이전 팔의 상단에 있는 추가 신호(화살)의 반대 방향으로 지그자그 표시기의 다른 팔을 형성할 때,대기 중인 순서의 위치를 설정하는 것이 가능해집니다.3. 반대쪽 지그재그 어깨에서 추가 신호(화살표)로 형성이 완료되면 이전에 열린 위치에 추가하거나 정지 손실을 이 수준으로 이동할 수 있습니다;4. 보수적 인 거래 모드에서 거래하는 경우 가격 움직임의 첫 번째 철수 전에 추가 포지션을 열 수 없습니다. 정확하게 시장에 진입하려면 지그재그 표시기 세그먼트의 형성과 수석 시간대에 추가 신호의 출현을 기다릴 수 있으며 열린 위치에서 40 점보다 더 가까운 정지를 배치 할 수 있습니다. 6. 당신이 무역에 추가 위치를 추가 한

Ritz Smart Detection BUY & SELL
The Ritz Smart Detection BUY & SELL is a next-generation trading indicator engineered to detect high-probability entry signals by combining ATR-based volatility measurement , trend reversal detection , and smart alerting technology . It delivers real-time BUY/SELL opportunities with adaptive targets and risk levels, making it a versatile tool for both scalpers and swing traders. Core Market Logic ATR-Driven Volatility Analysis Uses multiple ATR methods (SMA, EMA,
FREE

Introducing the MACD Enhanced – an advanced MACD (Moving Average Convergence Divergence) indicator that provides traders with extended capabilities for trend and momentum analysis in financial markets. The indicator uses the difference between the fast and slow exponential moving averages to determine momentum, direction, and strength of the trend, creating clear visual signals for potential entry and exit points. Attention! To achieve the best results, it is recommended to adapt the indicator
FREE

Haven Bands Reversion – 평균 회귀 트레이딩을 위한 전문 지표 평균 회귀 전략을 사용하는 트레이더를 위해 설계된 강력하고 정확한 도구, Haven Bands Reversion 을 소개합니다. 기존의 볼린저 밴드와 달리 이 지표는 거래량 가중 이동 평균(VWMA) 을 기반으로 하여 채널이 실제 시장 활동에 더 민감하게 반응합니다. 가장 중요한 것은 이 지표가 다시 그려지지 않는 신호 를 생성하여 신뢰할 수 있는 진입점을 제공한다는 것입니다. 여기에 제 다른 제품들이 있습니다 -> 여기 . 가격이 '공정한' 가치에서 너무 많이 벗어났을 때를 이해하는 것은 성공적인 반전 및 조정 거래의 핵심입니다. Haven Bands Reversion은 이러한 순간을 자동으로 식별하고 가격이 동적 변동성 채널 내부로 돌아올 때 명확한 신호를 제공합니다. 왜 VWMA가 표준 SMA보다 나은가요? 모든 캔들을 동일하게 고려하는 단순 이동 평균(SMA)과 달리, VWMA는 거래량이 많은

Place price Alerts on extended Rectangles and Trendlines - Risk reward indicator MT5 Extend Rectangles & Trendlines to the right edge Mark your supply demand zones with extended rectangle and draw support resistance lines with extended trendline. Find detailed manuals here . Find contacts on my profile . MT4 Rectangle extender indicator will simplify and make it easier for you to analyze markets and stay notified about important events. When you extend rectangle or trendline the action butt
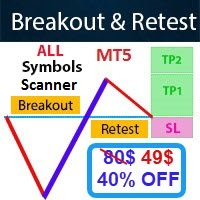
- Real price is 80$ - 40% Discount (It is 49$ now) Contact me for instruction, any questions! - Non-repaint - I just sell my products in Elif Kaya Profile, any other websites are stolen old versions, So no any new updates or support. - Lifetime update free Related product: Bitcoin Expert Introduction The Breakout and Retest strategy is traded support and resistance levels. it involves price breaking through a previous level. The break and retest strategy is designed to help traders do two main

The Volume Profile Fixed Range indicator is a powerful tool designed for MetaTrader 5 (MT5) platforms. It visualizes the distribution of trading volume over a fixed historical range of bars, helping traders identify key price levels where significant volume has accumulated. This aids in spotting support/resistance zones, value areas, and potential reversal or breakout points. Below is a detailed description of its features:
Key Features: - Fixed Range Analysis: Analyzes volume profile based on
FREE

Price Path Zone is a professional signal indicator for MT5, designed to visualize high-probability market movement areas. By identifying critical price action zones, it projects a "Price Path" box where the market is expected to flow, providing traders with clear, actionable trade setups. Core Functionality The indicator scans the market for price exhaustion and reversal patterns based on a customizable Analysis Period . When a potential reversal is detected at a local high or low, it generates
FREE

Special offer : ALL TOOLS , just $35 each! New tools will be $30 for the first week or the first 3 purchases ! Trading Tools Channel on MQL5 : Join my MQL5 channel to update the latest news from me Volumatic VIDYA (Variable Index Dynamic Average) 는 트렌드를 추적하고 각 트렌드 단계에서 매수 및 매도 압력을 분석하기 위해 설계된 고급 지표입니다. 가변 지수 동적 평균(Variable Index Dynamic Average)을 핵심 동적 평활화 기술로 활용하여 이 도구는 주요 시장 구조 수준에서 가격 및 거래량 역학에 대한 중요한 통찰력을 제공합니다. MT4 버전 보기: Volumatic VIDyA MT4 다른 제품 보기: 모든 제품 To use iCustom

Discover the power of harmony in the markets with this advanced harmonic pattern indicator. Designed for demanding technical traders, this indicator automatically detects 11 of the most popular harmonic patterns, including the Gartley, Bat, Crab, Butterfly, Shark, Cypher, and many more.
Thanks to its dynamic dashboard, you can easily manage the visibility of patterns on the chart, activating or deactivating the ones you want in real time without overloading your platform. This flexibility allo
FREE

A scalping indicator based on mathematical patterns, which on average gives signals with relatively small SL, and also occasionally helps to catch big moves in the markets (more information in the video)
This indicator has three main types of notifications: The first type warns of a possible/upcoming signal on the next bar The second type indicates the presence of a ready signal to enter the market/open a position The third type is for SL and TP levels - you will be notified every time price re

핍스 헌터 프로는 수년에 걸쳐 개발되었으며 이전 버전보다 개선된 버전입니다. 이 강력한 지표는 시장과 가격 이력을 분석하여 매수 및 매도 항목을 생성합니다. 이러한 항목의 계산을 위해 함께 작동하는 다양한 지표와 덜 유리한 항목을 필터링하고 제거하는 복잡한 통계 로그를 사용합니다 / MT4 버전 .
특징 다시 칠하지 않음
이 인디케이터는 새 데이터가 도착해도 값이 변경되지 않습니다
지연 없음 이 표시기는 지연되지 않습니다 거래 쌍
모든 외환 쌍 (가급적 EURGBP)
타임프레임
모든 차트주기
매개변수 ===== 표시 =====
화살표 거리 // 신호(화살표)와 캔들스틱 사이의 거리
===== 알림 =====
팝업 알림 // MT4 터미널용 알림
푸시 알림 알림 // 휴대폰용 알림
이메일 알림 // 이메일 알림
===== 차트 설정 =====
차트에서 캔들 스틱의 색상을 변경하는 옵션
경고 저는 MQL5.com에서만 제품을 판매합니다. 누군가
FREE

L'indicatore "Heikin Ashi" è stato progettato per migliorare l'analisi dei grafici finanziari con un sistema di candele Heikin Ashi. Le candele Heikin Ashi sono un metodo avanzato per visualizzare il prezzo, che aiuta a filtrare il rumore del mercato, rendendo più chiara l'interpretazione dei trend e migliorando la qualità delle decisioni di trading. Questo indicatore consente di visualizzare le candele Heikin Ashi al posto delle candele giapponesi tradizionali, rendendo l'analisi grafica più pu
FREE

BUY INDICATOR AND GET NEW EXCLUSIVE EA FOR FREE AS A BONUS! ITALO ARROWS INDICATOR is the best reversal indicator ever created, and why is that? Using extreme reversal zones on the market to show the arrows and Fibonacci numbers for the Take Profit, also with a panel showing all the information about the signals on the chart, the Indicator works on all time-frames and assets, indicator built after 8 years of experience on forex and many other markets. You know many reversal indicators around t

Smart Market Structure Simple is a powerful indicator that helps traders identify market structure based on the Smart Money Concept (SMC) . This indicator automatically detects Break of Structure (BOS), Change of Character (CHoCH), Fair Value Gaps (FVG), Order Blocks (OB), Liquidity Zones (LQZ), and key swing points Higher High (HH), Higher Low (HL), Lower High (LH), Lower Low (LL) . Main Objective: Assist traders in tracking institutional flow ( Smart Money ) and finding high-probability trade
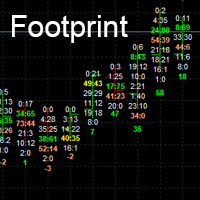
Footprint charts can add a level of depth to your visuals that standard charts cannot achieve.
Footprint charts are a powerful way to visualize the ups and downs of the market, helping you potentially to make better trading decisions. Orderflow Footprint in MT5. show # of market orders at each tick.
Inputs
Point Scale *1 to *10000
Number of candle to show. Font Size Max Bid Color (Top Seller) Max Ask Color (Top Buyer) Max Bid and Ask Color
Normal color

Capture every opportunity: your go-to indicator for profitable trend trading Trend Trading is an indicator designed to profit as much as possible from trends taking place in the market, by timing pullbacks and breakouts. It finds trading opportunities by analyzing what the price is doing during established trends. [ Installation Guide | Update Guide | Troubleshooting | FAQ | All Products ]
Trade financial markets with confidence and efficiency Profit from established trends without getting whip

For those who struggle with overbloated Volume Profile/Market Profile indicators, here is a solution that contains only the Point of Control (POC) information. Super-fast and reliable, the Mini POC indicator presents this vital information visually within your chart. Totally customizable in splittable timeframes, type of Volume, calculation method, and how many days back you need.
SETTINGS Timeframe to split the POCs within the day. Volume type to use: Ticks or Real Volume. Calculation method .
FREE
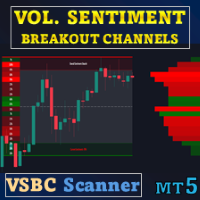
스페셜 오퍼 : ALL TOOLS , 개당 $35 입니다. 새로운 도구 는 첫 일주일 또는 처음 3회 구매 까지 $30 에 제공됩니다! Trading Tools Channel on MQL5 : MQL5 채널에 가입하고 제 최신 소식을 받아 보세요 Volume Sentiment Breakout Channels 는 동적 가격 채널 안에서 거래량 심리에 기반한 돌파 구역을 시각화해 주는 지표입니다. 단순히 가격 돌파를 기술적 이벤트로만 보는 것이 아니라, 매수/매도 거래량이 조정(콘솔리데이션) 구간에서 어떻게 분포하는지에 초점을 맞추어, 가격이 채널을 벗어날 때마다 매수자와 매도자 간의 통제권 이동을 표현합니다. 각 압축 구간 내부에서 이 지표는 영향력이 큰 영역을 식별하고, 매수측과 매도측의 우위 정도를 측정하며, 주문 흐름의 강도를 차트 상에서 실시간으로 지속적으로 업데이트합니다. 거래량 심리로 “가중치”가 부여된 채널을 가격이 상향 또는 하향 돌파할 때,

[ How to use the Demo version ] [ MT4 Version ] AO unpaid divergences MT5 AO unpaid divergences is the first indicator developed to detailed analyze Regular and Hidden Divergences. It uses this analysis to find out possible entry points and targets. Below some of the characteristics of this indicator: Time saving Highly customizable Working for all pairs (Crypto, Forex, Stocks, Indices, Commodities...) Suitable for Scalping or Swing trading Possible reversal swings Alerts and Notifications on M
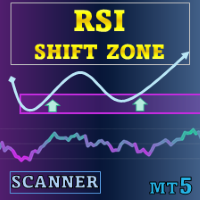
특별 할인 : ALL TOOLS , 각 $35 입니다! 새로운 도구 는 발표 후 첫 주 또는 첫 3회 구매 동안 $30 에 제공합니다! Trading Tools Channel on MQL5 : 최신 소식을 받으려면 채널에 참여하세요 RSI Shift Zone Scanner는 RSI 신호를 가격 행동과 연결하여 시장 심리가 변할 수 있는 순간을 식별합니다. RSI가 설정된 수준(기본값: 과매수 70, 과매도 30)을 상·하단 돌파하면, 지표는 차트에 채널을 그립니다. 이 채널은 심리가 반전되었을 가능성이 있는 구역을 표시하여 잠재적 지지·저항으로 활용될 수 있습니다. MT4 버전 보기: RSI Shift Zone MT4 Scanner 다른 제품: All P roducts RSI가 상단 또는 하단 레벨을 교차하면 새로운 채널이 생성됩니다. 채널 경계는 교차 캔들의 고가와 저가에 고정되며, 중앙선은 평균값을 표시합니다. 각 채널은 사용자 지정 바 수(기본 15)

피닉스 지지선 및 저항선 탐지기 (MT5)
메타트레이더 5용 전문 지지선 및 저항선 탐지 도구입니다. 상위 시간대에서 가장 강력한 지지선 및 저항선을 자동으로 탐지하고 시각적 대시보드를 통해 포괄적인 강도 분석을 표시합니다.
개요
피닉스 지지선 및 저항선 탐지기는 상위 시간대 피벗 분석(기본 H4, 사용자 정의 가능)을 통해 가장 강력한 세 가지 지지선 및 저항선을 식별합니다. 시스템은 테스트 횟수, 통합 바, 현재 가격과의 근접성에 따라 레벨을 순위화한 후, S1, S2, S3, R1, R2, R3을 보여주는 깔끔한 6열 대시보드를 통해 상세한 지표를 표시합니다.
각 레벨은 다섯 가지 핵심 지표를 표시합니다: 현재 가격, 강도 분류(테스트 횟수 기준 강함/중간/약함), 거리 분류(가까움/보통/멀음), 통합 바 수, 극성 상태. 극성 감지 시스템은 가격이 레벨을 통과할 때 저항 레벨이 지지 레벨로 전환되거나 그 반대의 경우를 식별합니다.
지표는 차트에 자동 가격 라벨이 표시
FREE

Price Volume Distribution
가격 수준별 거래량 분포를 분석하는 Volume Profile 지표. MT5용 POC, Value Area, 거래량 급등 및 존 기반 신호 필터링을 표시합니다.
개요
Price Volume Distribution은 MetaTrader 5용 거래량 분석 지표입니다. M1 타임프레임 데이터를 사용하여 가격 수준별 거래량 분포를 계산하고 표시하며, 히스토그램 바와 참조선을 통해 시각적 표현을 제공합니다. 시스템 이해를 위한 사용자 가이드 | 기타 언어 사용자 가이드 주요 기능
지표가 식별하는 항목: - Point of Control (POC): 가장 높은 거래량의 가격 수준 - Value Area High/Low (VAH/VAL): 거래량의 70%를 포함하는 가격 범위 - 거래량 급등: 비정상적으로 높은 활동의 가격 수준 - 거래량 집중에 기반한 지지 및 저항 존
프로파일 모드
세 가지 계산 모드 제공:
1. 세션 모드:

If you like this free tool, check out my EA which is currently on a Launch Sale for only $39 ! https://www.mql5.com/zh/market/product/159451?source=Site Short Description: A specialized technical indicator designed for Gold (XAUUSD) trading. It automatically identifies market swings, plots key 0.382 and 0.618 Fibonacci retracement levels, and sen mobile push nothiations not sat 面紙 面 面 面面 筆/內托are detected. 【Key Features】 Dual Monitoring Mode: Simultaneously tracks the 0.382 (Shallow Retracement)
FREE

This indicator plots the volume profile by Price on the chart
There are 5 ways to view it:
By Total Volume Traded (Premium Version); Volume Ticks(Forex) Separated by Buyers and Sellers (Premium Version); Buyers Only (Premium Version); Sellers Only (Premium Version); Business balance (Buyers - Sellers) (Premium Version); .
It is possible to select how many days the profiles will be calculated.( Premium Version)
On the current day it recalculates the histogram data for each new candlestick.
FREE

Daily VWAP Indicator (Volume Weighted Average Price) Special Deal! Leave a review and get the indicator Long & Short Cointegration Analyzer for free — just send me a message!
Description The Daily VWAP (Volume Weighted Average Price) indicator is an essential tool for traders seeking to identify the true average price of an asset throughout the day, adjusted by traded volume. Primarily used by institutional and professional traders, the daily VWAP serves as a reference point to identify the av
FREE

XAUUSD Heat Map Scalping Indicator Perfect for 1M, 3M, 5M, 15M Scalping on Gold (XAUUSD) Take your scalping to the next level with this exclusive Heat Map indicator , designed and optimized specifically for XAUUSD . This tool is a powerful visual assistant that helps you instantly identify market strength, pressure zones, and potential entry points in real time. Key Features: Optimized for Fast Scalping : Works best on 1-minute, 3-minute, 5-minute, and 15-minute timeframes Specializ

이것은 추측을 멈추고 당신의 전략을 이해할 기회입니다. 281개의 거래 추적 | 64% 승률 | 과거 데이터에서 70% 위험 대비 보상 이것은 단순한 숫자가 아닙니다—이 전략이 어떻게 작동하는지 보여주는 실제 통계입니다. 더 똑똑하게 거래할 방법을 찾고 있다면, 이 도구가 당신을 그곳으로 이끌어 줄 것입니다. 엔골핑 전략의 현실을 보는 것이 마음에 드셨나요? 구매 후 문의해 주세요 , 그러면 저희 다른 제품 중 하나를 무료로 제공해 드리겠습니다.
다른 제품을 확인하세요 에서 더 많은 실제 전략을 확인하고, Real Trades 커뮤니티에 가입하세요 해서 자신 있게 거래하고 진짜 트레이더들과 연결하세요! 캔들 범위 이론(CRT) 에 기반한 검증된 도구로, 유동성 급등을 정밀하고 일관되게 식별하도록 설계되었습니다. 이 전략은 이전 캔들의 범위를 사용해 가격 움직임을 예측하며, 가짜 신호를 걸러내기 위한 추가 확인과 함께 유동성 레이드를 추적합니다. 이 인디케이터가 당신을 어떻게 도울
MetaTrader 마켓은 거래 로봇과 기술 지표들의 독특한 스토어입니다.
MQL5.community 사용자 메모를 읽어보셔서 트레이더들에게 제공하는 고유한 서비스(거래 시그널 복사, 프리랜서가 개발한 맞춤형 애플리케이션, 결제 시스템 및 MQL5 클라우드 네트워크를 통한 자동 결제)에 대해 자세히 알아보십시오.
트레이딩 기회를 놓치고 있어요:
- 무료 트레이딩 앱
- 복사용 8,000 이상의 시그널
- 금융 시장 개척을 위한 경제 뉴스
등록
로그인
계정이 없으시면, 가입하십시오
MQL5.com 웹사이트에 로그인을 하기 위해 쿠키를 허용하십시오.
브라우저에서 필요한 설정을 활성화하시지 않으면, 로그인할 수 없습니다.