YouTube'dan Mağaza ile ilgili eğitici videoları izleyin
Bir alım-satım robotu veya gösterge nasıl satın alınır?
Uzman Danışmanınızı
sanal sunucuda çalıştırın
sanal sunucuda çalıştırın
Satın almadan önce göstergeyi/alım-satım robotunu test edin
Mağazada kazanç sağlamak ister misiniz?
Satış için bir ürün nasıl sunulur?
MetaTrader 5 için teknik göstergeler - 6

The Breakout Finder (BF) is a powerful MetaTrader 5 indicator designed to detect potential breakout and breakdown opportunities in price action. By analyzing pivot highs and lows over a user-defined period, it identifies consolidation zones where price has repeatedly tested resistance or support levels within a narrow channel. When price breaks out of these zones with sufficient confirmation (based on the minimum number of tests and channel width threshold), the indicator visually highlights th
FREE
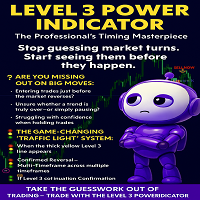
LEVEL 3 POWER INDICATOR
The Professional’s Timing Masterpiece
Stop guessing market turns. Start seeing them before they happen.
---
Are You Missing Out on Big Moves?
Entering trades just before the market reverses?
Unsure whether a trend is truly over—or simply pausing?
Struggling with confidence when holding trades?
You’re not alone. Most traders wrestle with these exact challenges… until they discover the Level 3 Power Indicator.
---
The Game-Changing “Traffic Light” Syst
FREE

Stop calculating lot sizes manually. Stop guessing your Risk/Reward ratio. The Risk Reward Tool brings the intuitive, visual trading style of TradingView directly to your MetaTrader 5 charts. It is designed for traders who value speed, precision, and visual clarity. Whether you trade Forex, Indices (DAX, US30), or Commodities (Gold, Oil), this tool handles the math for you. Simply click "Long" or "Short," drag the lines to your levels, and the tool instantly tells you exactly how many lots to t

Dark Breakout is an Indicator for intraday trading. This Indicator is based on Trend Following strategy, providing an entry signal on the breakout. The signal is provided by the arrow, which confirms the breaking of the level. We can enter in good price with this Indicator, in order to follow the main trend on the current instrument. It is advised to use low spread ECN brokers. This Indicator does Not repaint and N ot lag . Recommended timeframes are M5, M15 and H1. Recommended working pairs

UzFx-Total TP'SL & Timer-MT5 göstergesi, tüm açık ve bekleyen işlemlerde toplam Kar Al (TP) ve Zarar Durdur (SL) değerlerinin gerçek zamanlı olarak izlenmesini sağlamak için tasarlanmıştır. Ayrıca, mevcut mumun kapanmasına kalan süreyi gösteren bir mum geri sayım zamanlayıcısı da içerir.
Temel Özellikler:
Tüm aktif işlemlerden ve bekleyen emirlerden beklenen toplam kar ve zararı otomatik olarak hesaplar. Mevcut mumun kapanmasına kalan süreyi göstererek, yatırımcıların giriş ve çıkışları verim
FREE
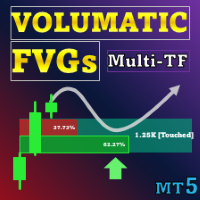
Özel teklif : ALL TOOLS , her biri sadece $35 ! Yeni araçlar $30 olacaktır ve ilk hafta veya ilk 3 satın alma için geçerlidir! Trading Tools Channel on MQL5 : En son haberler için MQL5 kanalıma katılın Volumatic Fair Value Gaps (FVG), anlamlı fiyat dengesizliği bölgelerini belirleyip korur ve her gap içindeki yönlü hacmi ayrıştırır. Hacim, daha düşük zaman diliminden (varsayılan M1, kullanıcı seçilebilir) alınır, Alım/Satım paylarına bölünür ve toplamı %100 olan iki yüzde çubuğu olar

Özel teklif : ALL TOOLS , her biri yalnızca $35 ! Yeni araçlar ilk hafta boyunca veya ilk 3 satın alma için $30 olacaktır! MQL5’te Trading Tools Kanalı : En son haberlerim için MQL5 kanalıma katılın Bu gösterge, volatiliteye göre normalize edilmiş fiyat hareketine dayanan ve “Smart Breakout Channels” olarak adlandırılan kırılma tespit bölgelerini çizer. Bu bölgeler, hacim bindirmeleriyle birlikte dinamik kutular olarak gösterilir. Araç, özel bir normalize volatilite hesabı kullanarak

The Magic Histogram MT5 indicator is a universal tool, suitable for scalping and medium-term trading. This indicator uses an innovative formula and allows you to determine the direction and strength of the trend. Magic Histogram MT5 is not redrawn, so you can evaluate its efficiency using history data. It is most suitable for M15, M30, H1 and H4. Magic Histogram for the MetaTrader 4 terminal : https://www.mql5.com/en/market/product/23610 Indicator Benefits Excellent indicator signals!

What is this indicator? This indicator is for comparing multiple charts and verifying the chart pattern. Synchronize each chart position with the common vertical line. By changing the chart mode, you can also display the chart like a real trade.
How to set up
1. Scroll the chart of the target currency pair to the end in the past direction and download all the historical data of that currency pair. 2. Install this indicator in the main window of each chart. 3. Customize each parameter on the In

MTF WAD Simplified Indicator - Professional Trading Solution Overview The MTF WAD Simplified is a sophisticated multi-timeframe volume-based indicator designed to track smart money flow across financial markets. By monitoring the Williams Accumulation/Distribution (WAD) across 8 different timeframes, this tool provides traders with unprecedented insight into institutional accumulation and distribution patterns. Core Benefits for Traders 1. Smart Money Tracking - Detect Institutional

简介: 六彩神龙指标【MCD Hot Money】进是一种常用的技术指标,被广泛应用于股票交易中。它由六人不同的指标组成,包括均线、相对强弱指标井、移动平均收盘线等。这人指标可以有效地帮助投资者确定股票的买入和卖出时机。 六彩神龙用来看筹码了解庄家动向。看个股买卖少踩炕,少被套;跟庄吃肉,用于判断个股趋势!
指标设置 : hot_money_sensitivity = 0.7; // Hot Money Sensitivity hot_money_period = 40; // Hot Money Period hot_money_base = 30; // Hot Money Base banker_sensitivity = 1.5; // Banker Sensitivity banker_period = 50; // Banker Period banker_base = 50;

The MTF Candlestick Patterns Detector indicator is a comprehensive Momentum & Trend Intelligence System designed to strip away market noise and provide institutional-grade clarity for retail traders. It specializes in high-probability signal detection by merging price action geometry with temporal confluence. Here is why this tool is a game-changer for your trading desk: Core Functionalities · Automated Candlestick Pattern Recognition: The indicator scans for high-alpha patterns (like E

Fiyat Dalga Modeli MT5 --(ABCD Modeli)-- hoş geldiniz ABCD modeli, teknik analiz dünyasında güçlü ve yaygın olarak kullanılan bir ticaret modelidir.
Tüccarların piyasadaki potansiyel alım ve satım fırsatlarını belirlemek için kullandıkları uyumlu bir fiyat modelidir.
ABCD modeliyle, tüccarlar potansiyel fiyat hareketlerini tahmin edebilir ve alım satımlara ne zaman girip çıkacakları konusunda bilinçli kararlar verebilir. EA Sürümü: Price Wave EA MT5
MT4 Sürümü : Price Wave Pattern MT4
FREE

Price Action Suvo - Ultimate SMC & Trend Indicator
Key Features 1. Advanced Market Structure (BOS & CHoCH) Dual Structure Analysis: Automatically identifies both Internal Structure (short-term) and Swing Structure (major trends). BOS & CHoCH: Clearly marks Break of Structure (BOS) and Change of Character (CHoCH) with distinct styles. Visual Perfection: Internal: Dotted lines for minor structure. Swing: Solid lines for major structure. No Overlap: Fixed logic prevent
FREE

Overview The Smart Money Structure Markup Indicator for MetaTrader 5 is a powerful tool designed to help traders identify key market structures based on popular Smart Money Concepts (SMC) strategies. This indicator detects micro-market structures, providing insights into price movements and potential trend changes. It highlights important elements such as valid Break of Structure (BOS), Change of Character (CHoCH), and Inducement (IDM), helping traders to make informed decisions. Key Features Ma
FREE

Gann 9+ Indicator Introduction The "Gann Matrix Chart" is the most simple and clear technical analysis in Gann theory, which is the calculation tool that Gann has always been committed to using. It is the essence of Gann's whole life. The Gann 9+ indicator uses the matrix chart to find the future high or low points of stocks or futures. Indicator Input: The base and step size can be set as 1 by default; When the multiple is -1, the multiple will be automatically obtained, or it can be filled in

Step into the world of Forex trading with confidence, clarity, and precision using Gold Indicator a next-generation tool engineered to take your trading performance to the next level. Whether you’re a seasoned professional or just beginning your journey in the currency markets, Gold Indicator equips you with powerful insights and help you trade smarter, not harder. Built on the proven synergy of three advanced indicators, Gold Indicator focuses exclusively on medium and long-term trends elimina

TALİMATLAR RUS / TALİMATLAR ENG / Sürüm MT4 Ana fonksiyonları: Satıcı ve alıcıların aktif bölgelerini görüntüler! Gösterge, satın alma ve satışlar için tüm doğru ilk dürtü seviyelerini/bölgelerini görüntüler. Giriş noktaları arayışının başladığı bu seviyeler/bölgeler etkinleştirildiğinde, seviyeler renk değiştirir ve belirli renklerle doldurulur. Ayrıca, durumun daha sezgisel bir şekilde algılanması için oklar görünür. LOGIC AI - Bir şablonu etkinleştirirken giriş noktalarını aramak için

For those who struggle with overbloated Volume Profile/Market Profile indicators, here is a solution that contains only the Point of Control (POC) information. Super-fast and reliable, the Mini POC indicator presents this vital information visually within your chart. Totally customizable in splittable timeframes, type of Volume, calculation method, and how many days back you need.
SETTINGS Timeframe to split the POCs within the day. Volume type to use: Ticks or Real Volume. Calculation method .
FREE

This indicator provides several drawing tools to assist in various methods of chart analysis.
The drawings will keep their proportions (according to their handle trendline) across different chart scales, update in real time, and multiple drawings are supported.
#
Drawing Option
Description
1 Grid box draggable boxed grid, user defines rows x colums, diagonal ray option 2 Grid partial or fullscreen grid, sized by handle line 3 Grid flex a diagonal grid, sized and sloped by handle line
4 Cyc
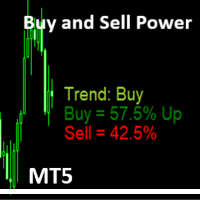
Simple Indicator that shows the Buy and Sell volume in percent. The Buy and Sell Power indicator for MetaTrader 5 calculates and displays estimated buy/sell volume percentages over a user-defined period (default: 14 bars) using tick volume data. It overlays text labels on the chart showing Buy % (with "Up" if >51%), Sell % (with "Dn" if >51%), and a trend signal based on thresholds: Neutral (<55%), Trend: Buy/Sell (55%+), Trend: Strong Buy/Sell (62%+), Trend Max UP/Down (65%+), or Trend change s
FREE

Was: $99 Now: $49 Blahtech Daily Range indicator displays the average daily range alongside the individual session ranges. Using the daily open price as a reference the indicator shows fixed range and dynamic range targets as lines on the charts. These lines clearly show when the average range has been exhausted. Daily and session ranges can be useful for confirming entries or setting targets and is an excellent odds enhancer for many trading systems. Links [ Documentation | Install | U

Smart Structure Concepts MT5 is an all-in-one Smart Money Concepts indicator created to help traders visually read institutional structure and understand why each movement occurs. Unlike most indicators on the Market, this system does not only draw patterns or zones. It teaches.
Every visual element (BOS, CHoCH, OB, FVG, EQH, EQL, PDH, PDL, etc.) includes educational tooltips that explain the concept and the suggested trader action (buy, sell, or wait).
These on-chart explanations make it perfe
FREE

Candle Time CountDown By BokaroTraderFx The Candle Timer Countdown Indicator is a versatile tool designed for the MetaTrader 5 (MT5) trading platform. It provides traders with a visual countdown of the remaining time for the current candle on a chart. The key features include:
Customizable Position: Place the countdown timer in any corner of the chart for optimal visibility. Default Text Color: Set to red for clear visibility, with options for further customization. Minimal Display: Shows only
FREE

Göstergе, herhangi bir noktadan hacmi analiz eder ve bu hacim için piyasanın tükeniş seviyelerini hesaplar. Meravith’in ana çizgileri: Boğa hacim tükeniş çizgisi – hedef olarak kullanılır. Ayı hacim tükeniş çizgisi – hedef olarak kullanılır. Trend çizgisi – piyasa trendini gösterir. Piyasanın boğa mı ayı mı olduğuna bağlı olarak rengi değişir ve trend desteği görevi görür. Nasıl kullanılır: Mor dikey çizgiye çift tıklayın ve istediğiniz konuma taşıyın. Her şeyi analiz edebilirsiniz – trendleri v

YOU CAN NOW DOWNLOAD FREE VERSIONS OF OUR PAID INDICATORS . IT'S OUR WAY OF GIVING BACK TO THE COMMUNITY ! >>> GO HERE TO DOWNLOAD
This system is an Heiken Ashi system based on RSI calculations . The system is a free open source script originally published on TradingView by JayRogers . We have taken the liberty of converting the pine script to Mq4 indicator . We have also added a new feature which enables to filter signals and reduces noise on the arrow signals.
Background
HEIKEN ASHI
Th
FREE

The Quantum VPOC indicator has been developed to expand the two dimensional study of volume and price, to a three dimensional one which embraces time. The volume/price/time relationship then provides real insight to the inner workings of the market and the heartbeat of sentiment and risk which drives the price action accordingly. The Quantum VPOC indicator displays several key pieces of information on the chart as follows: Volume Profile - this appears as a histogram of volume on the vertical pr

ZenTrend — Adaptive Trend Indicator for MetaTrader 5 ZenTrend is an innovative trend indicator for MetaTrader 5 that plots a flexible and informative trend line on the chart, based on adaptive moving average calculations. This tool is ideal for traders seeking precise and timely identification of trend direction on any financial market: forex, stocks, indices, cryptocurrencies, and commodities. Key Features of ZenTrend 1. Four Types of Moving Averages Supported
ZenTrend allows you to choose fro

Overview
The Volume SuperTrend AI is an advanced technical indicator used to predict trends in price movements by utilizing a combination of traditional SuperTrend calculation and AI techniques, particularly the k-nearest neighbors (KNN) algorithm.
The Volume SuperTrend AI is designed to provide traders with insights into potential market trends, using both volume-weighted moving averages (VWMA) and the k-nearest neighbors (KNN) algorithm. By combining these approaches, the indicator
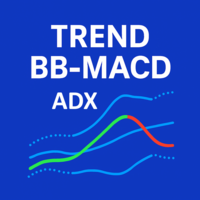
Trend BB MACD ADX Filtreli Göstergesi Trend BB MACD ADX Filtreli Göstergesi , Bollinger Bantları (BB) , MACD ve Ortalama Yönsel Hareket Endeksi (ADX) 'i birleştiren gelişmiş bir teknik araçtır. Artık +DI ve -DI ile eksiksiz bir yön analizi sistemini ve MACD ile çapraz doğrulama seçeneklerini de içermektedir. Bu gösterge, scalping , gün içi ve swing trading için optimize edilmiş, doğru ve filtrelenmiş alım satım sinyalleri sunmak üzere tasarlanmıştır. Yalnızca yönü değil, aynı zamanda trendin gü
FREE

Haven HTF Candle — Grafiğinizdeki Üst Zaman Diliminin Gücü Haven HTF Candle 'ı sunuyoruz — üst zaman dilimi (HTF) mumlarını doğrudan çalışma grafiğinizde gösteren güçlü bir araç. Sürekli olarak pencereler arasında geçiş yapmayı bırakın ve bilinçli alım satım kararları vermenin temeli olan gerçek piyasa bağlamını görmeye başlayın. Diğer ürünler -> BURADA . Temel Özellikler ve "Power of 3" Konsepti "Power of 3" (AMD) konseptine göre analiz: Gösterge, bu strateji için kilit bir seviye olan HTF mum
FREE

The Clean Trading Sessions indicator shows the most significant trading sessions for the Forex market, such as London, New York, Tokyo. The Clean Trading Sessions indicator is a simple and, at the same time, quite functional Forex sessions indicator, developed for the MT5 terminal. It is available to download for free.
How is this Forex market session indicator used? Traders normally use trading sessions to determine the volatile hours throughout the day, since the trading activities vary
FREE

Neden RSI uyumsuzluklarının çoğu ya gecikmeli ya da repaint yapar? Yeterince RSI uyumsuzluk göstergesi kullandıysanız, büyük ihtimalle şu iki durumdan biriyle karşılaşmışsınızdır: ya uyumsuzluk çok geç ortaya çıkar,
ya da daha önce görünen bir uyumsuzluk aniden kaybolur. Bu, göstergenin “kötü yazıldığı” anlamına gelmez.
Bunun nedeni, uyumsuzluk hesaplama mantığının doğası gereği kaçınılmaz bir ödünleşim içermesidir. Anında sinyal istenirse repaint riski artar.
Repaint tamamen önlenmek istenirse
FREE

Entry Point M5 — a complete trading system. Entry Point M5 is a powerful indicator designed as a fully functional trading system suitable for any currency pair. It analyzes the price structure, identifying key moments of market reversals and the emergence of new impulses. The indicator can adapt to different market phases — from strong trending movements to sideways ranges — providing visually clear signals without the need for additional filters or auxiliary tools. Trading with this system is e
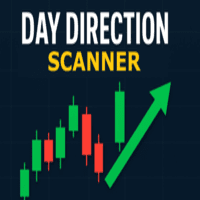
Günlük Yön Tarayıcısı, piyasanın yönünü belirlemek için mevcut mum çubuğunun 1 Günlük, 4 Saatlik, 1 Saatlik, 15 Dakikalık ve 5 Dakikalık periyotlardaki yönünü kullanan bir göstergedir. Tüm mum çubukları tek bir yönde birleştiğinde, gösterge günün yükseliş mi yoksa düşüş mü olduğunu veya net bir yön olup olmadığını gösterir. Gün içinde piyasanın yönü hakkında kolayca fikir edinmek için kullanışlıdır.
Özellikler:
- Tüm döviz çiftlerinde, endekslerde ve emtialarda çalışır.
- Trend analizini kol
FREE

Çoğu “Anlık RSI Diverjansı” sinyali yanlıştır RSI diverjans göstergelerini kullandıysanız, muhtemelen bunu yaşamışsınızdır:
Bir diverjans gerçek zamanlı olarak görünür ve ilk başta güvenilir görünür,
ama birkaç mumdan sonra kaybolur.
Grafiğe daha sonra baktığınızda, geçmiş sinyaller ilk gördüğünüzle artık uyuşmaz. Bu kullanıcı hatası değildir.
Bu bir mantık sorunudur. Onaylanmamış zirve veya diplerden türetilen diverjanslar doğası gereği kararsızdır. Geçmişini değiştirmeyen bir RSI diverjans gös
FREE
Sigma Indicator is used by Sigma Expert advisor for plotting the zones but now its available for members to apply their stratagies on Sigma supply and demand levels.
Instructions:
1- Donot Change time frames instead run several pairs with different time frames with sigma indicator 2- For exness : Search for smaller zone = True
For other brokers keep it False
3- Maximum zone size = 0
4- Minimum zone size = 0
5 - Back candles = 300

Haven Bands Reversion – Ortalamaya Dönüş Ticareti için Profesyonel Bir Gösterge Ortalamaya dönüş stratejileri kullanan yatırımcılar için tasarlanmış güçlü ve hassas bir araç olan Haven Bands Reversion 'ı sunuyoruz. Klasik Bollinger Bantları'nın aksine, bu gösterge Hacim Ağırlıklı Hareketli Ortalama'ya (VWMA) dayanır, bu da kanallarını gerçek piyasa aktivitesine karşı daha duyarlı hale getirir. En önemlisi, gösterge yeniden çizim yapmayan sinyaller üreterek size güvenilir giriş noktaları sağlar.

Çoklu Zaman Dilimi Trend Analizi Aracı Sürekli grafik değiştirmeden birden fazla zaman diliminde trendleri takip etmek ister misiniz? Smart Trend Consensus MT5 , 7 zaman diliminden eş zamanlı olarak (M1, M5, M15, M30, H1, H4, D1) verileri birleştiren bir teknik analiz aracıdır. Gösterge, her zaman diliminde trend durumunu değerlendirmek için 7 teknik kriter kullanır ve tüm bilgileri görsel bir panoda gösterir. Tüccarların piyasa izleme süresinden tasarruf etmesine yardımcı olan çok boyut

Pivot Points Indicator that calculates essential support and resistance levels for day traders and swing traders. Ideal for identifying reversal points, setting targets, and managing risk on any timeframe. For Day Traders
Identifies key levels for entries and exits Defines stop-loss and target levels Recognizes potential intraday reversals For Swing Traders
Identifies weekly/monthly support and resistance zones Plans medium-term positions Complements trend analysis For Scalpers
Fast reference
FREE
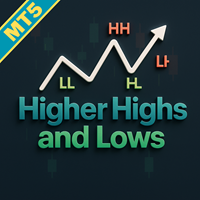
Fiyat eylemi ticaretinizi Higher Highs and Lows MT5 göstergesiyle geliştirin, anahtar salınım noktalarını belirlemek için fraktal analizi kullanan sağlam bir araç, Higher Highs (HH), Lower Highs (LH), Lower Lows (LL) ve Higher Lows (HL) gibi trend tanımlayan pattern'leri tanımlayarak pazar yönüne net içgörüler sağlar. 1900'lerin başındaki Dow Teorisi'nde kök salmış temel fiyat eylemi ilkelerine dayanan ve modern ticarette Al Brooks gibi uzmanlar tarafından "Trading Price Action" serisinde popüle
FREE

non-repaint free MT5 technical indicator works on all timeframes 1 minute to the monthly timeframe the trade vision buy and sell arrow is a multi currency and synthetic indicator Trade vision buy and sell arrow comes with Push Alerts purple arrow look for selling opportunities white arrow look for buying opportunities. wait for candle to close and arrow to appear before taking any trades.
FREE

King Smart Liquidity MT5, forex, altın, endeksler, Bitcoin ve diğer piyasalardaki kurumsal para akışlarını ve büyük bankaları takip etmek için özel olarak tasarlanmış gelişmiş bir analitik göstergedir. Bu gösterge, fiyat hareketi, likidite bölgeleri ve büyük finansal kurumların piyasadaki davranışlarını anlamaya dayanan "Smart Money Concept" metodolojisine dayanarak geliştirilmiştir. Bu gösterge sadece çizgiler veya bölgeler çizmez, aynı zamanda geleneksel gecikmeli göstergelerden uzak, gerçek

Royal Scalping Indicator is an advanced price adaptive indicator designed to generate high-quality trading signals. Built-in multi-timeframe and multi-currency capabilities make it even more powerful to have configurations based on different symbols and timeframes. This indicator is perfect for scalp trades as well as swing trades. Royal Scalping is not just an indicator, but a trading strategy itself. Features Price Adaptive Trend Detector Algorithm Multi-Timeframe and Multi-Currency Trend Low
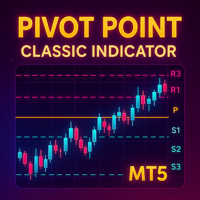
Detailed Description: The Pivot Point Classic Indicator is designed for traders who rely on classic pivot points and midpoints levels for their trading strategies. By automatically calculating and plotting these levels, the indicator provides a clear, visual representation of critical price areas where the market may reverse or break out. Key Features: Automatic Pivot Point Calculations : Automatically calculates pivot points, three support (S1, S2, S3) and resistance (R1, R2, R3) levels bas
FREE

Sentetik Trend AI - Yapay Zeka Destekli Akıllı Bir Trend Göstergesi
Sentetik Trend AI göstergesi, klasik Süper Trend formülünü yapay zeka algoritmaları (k-En Yakın Komşular, KNN) ve hacim analiziyle birleştiren güçlü bir teknik analiz aracıdır. Piyasayı daha derinlemesine incelemek ve daha güvenli kararlar almak isteyenler için tasarlanmıştır.
Sentetik Trend AI'yı benzersiz kılan özellikler: Yapay Zeka trend tahmini: Geçmiş verileri analiz etmek ve fiyat hareketinin yönünü tahmin etmek için K
FREE
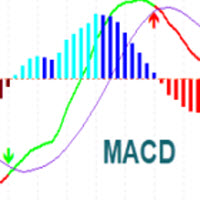
MACD Indicator It has MACD line, Signal line, and Histogram. The Histogram has 4 colors based on Direction Above and Below the Zero Line, showing its movement direction as simple as possible. Allows Show MACD & Signal Line, Show Change In color of MACD Line based on cross of Signal Line. Show Dots at Cross of MacD and Signal Line, Turn on and off Histogram. Enjoy your trading experience, and feel free to share your comments and reviews.
If you are interested in this indicator, you might be i
FREE
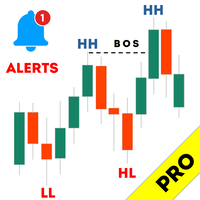
Haven Market Structure PRO - Profesyonel Piyasa Analistiniz Karşınızda Haven Market Structure PRO – bu sadece bir indikatör değil, Fiyat Hareketi (Price Action) ve Akıllı Para Konseptleri (Smart Money Concepts) gibi temel kavramlara dayanan, fiyat hareketi analizini otomatikleştiren eksiksiz bir sistemdir. Bu PRO sürümü, grafik üzerinde maksimum kontrol sahibi olmak ve piyasanın tam resmini görmek isteyen yatırımcılar için oluşturulmuştur. Diğer ürünler -> BURADA Piyasa yapısını anlamak, kâr

If you like this free tool, check out my EA which is currently on a Launch Sale for only $39 ! https://www.mql5.com/zh/market/product/159451?source=Site Short Description: A specialized technical indicator designed for Gold (XAUUSD) trading. It automatically identifies market swings, plots key 0.382 and 0.618 Fibonacci retracement levels, and sen mobile push nothiations not sat 面紙 面 面 面面 筆/內托are detected. 【Key Features】 Dual Monitoring Mode: Simultaneously tracks the 0.382 (Shallow Retracement)
FREE
+++++++++++++++++++++++++++++++++++++++++++++++++++++++++++++++++++++++++++++++++++++++++++++++++ +++ Link to EURUSD Only Free Version --> https://www.mql5.com/en/market/product/156904?source=Unknown +++++++++++++++++++++++++++++++++++++++++++++++++++++++++++++++++++++++++++++++++++++++++++++++++ Hallo Trader, This is a traditional GANN & FIBONACCI strategy based on detection of an impulsive move in the opposite direction. This is called a Breakout. At the moment of Breakout, the indicator draw

trend,trend analizi,trend takibi,sinyaller,uyarılar,işlem paneli,gösterge paneli,piyasa bağlamı,scalping,gün içi işlem,intraday,swing trade,repainte yok,gecikmesiz,risk yönetimi,risk ödül, destek direnç,arz talep bölgeleri,alış satış baskısı,forex,kripto,çoklu zaman dilimi
QuantumTrade Panel, MetaTrader 5 için geliştirilmiş, trend yönü, denge bölgeleri, alım-satım baskısı, birikmiş risk ve işlem projeksiyonlarını tek bir görsel panelde gerçek zamanlı olarak sunan gelişmiş bir göstergedir.
Gö
FREE

SmartScalp M1 – Fast Scalping with Accurate Trends and Clean Signals SmartScalp M1 is a high-speed scalping indicator optimized specifically for the M1 timeframe. It combines Supertrend and Heiken Ashi to identify clear trend reversals and effectively filter market noise. BUY and SELL signals are generated when the Supertrend flips and are confirmed by Heiken Ashi candle colors, significantly reducing false signals in choppy market conditions. The indicator performs best on high-volatility ins

MACD divergence indicator finds divergences between price chart and MACD indicator and informs you with alerts (popup, mobile notification or email) . Its main use is to find trend reversals in the chart. Always use the divergence indicators with other technical assets like support resistance zones, candlestick patterns and price action to have a higher possibility to find trend reversals. Three confirmation type for MACD divergences: MACD line cross zero level Price returns to previous H/L Crea
FREE

Trend Line Map indicator is an addons for Trend Screener Indicator . It's working as a scanner for all signals generated by Trend screener ( Trend Line Signals ) . It's a Trend Line Scanner based on Trend Screener Indicator. If you don't have Trend Screener Pro Indicator, the Trend Line Map Pro will not work. LIMITED TIME OFFER : Trend Line Map Indicator is available for only 50 $ and lifetime. ( Original price 125$ )
By accessing to our MQL5 Blog, you can find all our premium indicat
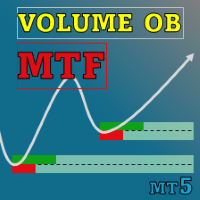
Special offer : ALL TOOLS , just $35 each! New tools will be $30 for the first week or the first 3 purchases ! Trading Tools Channel on MQL5 : Join my MQL5 channel to update the latest news from me Volumetrik Sipariş Blokları Çoklu Zaman Çerçevesi göstergesi, önemli piyasa katılımcılarının siparişleri biriktirdiği kilit fiyat bölgelerini belirleyerek piyasa davranışına daha derin bir içgörü arayan tüccarlar için tasarlanmış güçlü bir araçtır. Bu bölgeler, Volumetrik Sipariş Bloklar

L'indicatore "Heikin Ashi" è stato progettato per migliorare l'analisi dei grafici finanziari con un sistema di candele Heikin Ashi. Le candele Heikin Ashi sono un metodo avanzato per visualizzare il prezzo, che aiuta a filtrare il rumore del mercato, rendendo più chiara l'interpretazione dei trend e migliorando la qualità delle decisioni di trading. Questo indicatore consente di visualizzare le candele Heikin Ashi al posto delle candele giapponesi tradizionali, rendendo l'analisi grafica più pu
FREE

Advanced Stochastic Scalper MT5 , popüler Stokastik Osilatöre dayalı profesyonel bir göstergedir. Advanced Stochastic Scalper, dinamik aşırı alım ve aşırı satım seviyelerine sahip bir osilatör iken, standart Stokastik Osilatörde bu seviyeler statiktir ve değişmez. Bu, Advanced Stochastic Scalper'ın sürekli değişen pazara uyum sağlamasına olanak tanır. Bir al veya sat sinyali göründüğünde, grafikte bir ok çizilir ve zamanında bir pozisyon açmanıza ve her zaman bilgisayarınızın başında oturmaktan

Impulse Trend is an indicator designed to tackle one of the biggest challenges in trading: distinguishing a real trend from simple market noise. It fuses the algorithmic elegance of the Hull Moving Average with the statistical power of Impulse Candles , creating an all-in-one tool for professional traders . The Edge: The Power of Volume Unlike indicators that focus solely on price, Impulse Trend incorporates a Volume RSI directly into the calculation of each candle. Volume is the decisive factor
FREE

Stochastic MTF Dashboard Stochastic MTF Dashboard , verimliliği artırmak amacıyla tasarlanmış görsel bir çözümdür. Mevcut grafiğinizden ayrılmadan, 6 farklı zaman dilimine kadar Stokastik osilatörünün durumunu eş zamanlı olarak izlemenize olanak tanır. Amacı, kafa karışıklığını gidermek ve size piyasa gücü hakkında anlık bir okuma sağlamaktır: Kırmızı: Aşırı Alım Bölgesi: Fiyatta olası yorulma (Satış fırsatı). Yeşil: Aşırı Satım Bölgesi: Fiyatta olası toparlanma (Alış fırsatı). Gri: Nötr Bölge:
FREE
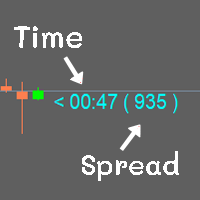
Show the time of candlesticks and spread. All data will be displayed in a rod. Can change color Can fix the size as needed
MT4 : Link https://www.mql5.com/en/market/product/102742 MT5 : Link https://www.mql5.com/en/market/product/102834
Most free code on various websites I didn't write it myself. I only do a little bit.
If you like it, please give 5 stars with it. Thank you.
FREE

The Volume Profile Fixed Range indicator is a powerful tool designed for MetaTrader 5 (MT5) platforms. It visualizes the distribution of trading volume over a fixed historical range of bars, helping traders identify key price levels where significant volume has accumulated. This aids in spotting support/resistance zones, value areas, and potential reversal or breakout points. Below is a detailed description of its features:
Key Features: - Fixed Range Analysis: Analyzes volume profile based on
FREE

This indicator automatically identifies market structure and plots Fibonacci retracement levels in real time.
It detects key swing highs and lows to mark structural points such as higher highs, higher lows, lower highs, and lower lows, helping traders quickly understand trend direction and structural shifts.
Based on the detected structure, the indicator dynamically draws Fibonacci levels, allowing traders to easily spot potential retracement, pullback, and entry zones without manual drawing.
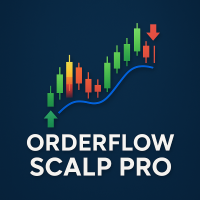
Orderflow Scalp Pro v2.4 delivers institutional-grade trading intelligence through advanced volume analysis, dynamic VWAP calculations, real-time aggressive score monitoring, and precision arrow signals. This complete trading system transforms complex market data into clear, actionable signals for consistent profitability on 3-4 minute timeframes.
Full Documentation: [Download PDF] Four Powerful Components in One System Volume Profile HeatMap with POC/VAH/VAL Transform your charts into inst

The Volume Delta Indicator is a technical analysis tool that combines volume analysis with price action to identify potential trading opportunities. This indicator analyzes the difference between buying and selling pressure through candle structure analysis. Key Features Volume Delta Calculation : Measures buy/sell volume difference using candle structure analysis EMA Smoothing : Applies exponential moving average to smooth volume data Breakout Detection : Identifies price breakouts with volume
FREE

Improved version of the free HMA Trend indicator (for MetaTrader 4) with statistical analysis. HMA Trend is a trend indicator based on the Hull Moving Average (HMA) with two periods. HMA with a slow period identifies the trend, while HMA with a fast period determines the short-term movements and signals in the trend direction.
The main differences from the free version: Ability to predict the probability of a trend reversal using analysis of history data. Plotting statistical charts for analyzi

Introduction
Reversal Candles is a cutting-edge non-repainting forex indicator designed to predict price reversals with remarkable accuracy through a sophisticated combination of signals.
Signal Buy when the last closed candle has a darker color (customizable) and an up arrow is painted below it Sell when the last closed candle has a darker color (customizable) and a down arrow is painted above it
FREE

VWAP, or volume-weighted average price, helps traders and investors observe the average price that major traders consider the "fair price" for that move. VWAP is used by many institutions to set up large operations.
In this indicator, you can enjoy the following features:
Daily VWAP, with option to display your current price next to the chart VWAP Weekly, with option to display your current price next to the chart Monthly VWAP, with option to display your current price next to the chart
FREE
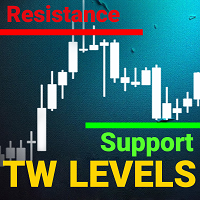
support resistance levels indicator mt5:
Bu araç, insan gözünün aynı doğruluğuyla bir grafikte destek ve direnç çizgilerini, ayrıca Fibonacci seviyelerini tanımlayan ve çizen çok zamanlı bir göstergedir. Forex için TW destek ve direnç seviyeleri, fiyat stabilizasyonu ve sıçramalarının önceki seviyelerini belirlemek için grafiği tarayan karmaşık bir algoritmaya sahiptir ve dokunuş sayısını kaydeder.
Destek ve direnç seviyelerini ve Fibonacci geri çekilmelerini manuel olarak çizmeye mi yoruldun

Daily VWAP Indicator (Volume Weighted Average Price) Special Deal! Leave a review and get the indicator Long & Short Cointegration Analyzer for free — just send me a message!
Description The Daily VWAP (Volume Weighted Average Price) indicator is an essential tool for traders seeking to identify the true average price of an asset throughout the day, adjusted by traded volume. Primarily used by institutional and professional traders, the daily VWAP serves as a reference point to identify the av
FREE
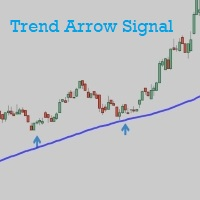
Trend Arrow Signal gives buy/sell signals and alerts with up and down arrow at potential reversal of a pullback or a trend continuation pattern. As the name indicated, this is an indicator which gives signals based on trend => It works best in trend market with the principle is to ride on the trend not trade against the trend. The main trend is determined by EMA 50 and can be changed manually to suit your preference. Trend arrow signal can work on all time frames. It gives signal at close of th
FREE
MetaTrader platformunun uygulama mağazası olan MetaTrader mağazasından bir alım-satım robotunun nasıl satın alınacağını öğrenin.
MQL5.community ödeme sistemi, PayPal, banka kartları ve popüler ödeme sistemleri aracılığıyla yapılan işlemleri destekler. Daha iyi bir müşteri deneyimi için satın almadan önce alım-satım robotunu test etmenizi şiddetle tavsiye ederiz.
Alım-satım fırsatlarını kaçırıyorsunuz:
- Ücretsiz alım-satım uygulamaları
- İşlem kopyalama için 8.000'den fazla sinyal
- Finansal piyasaları keşfetmek için ekonomik haberler
Kayıt
Giriş yap
Gizlilik ve Veri Koruma Politikasını ve MQL5.com Kullanım Şartlarını kabul edersiniz
Hesabınız yoksa, lütfen kaydolun
MQL5.com web sitesine giriş yapmak için çerezlerin kullanımına izin vermelisiniz.
Lütfen tarayıcınızda gerekli ayarı etkinleştirin, aksi takdirde giriş yapamazsınız.