Indicadores técnicos para MetaTrader 5 - 6

Cuenta atrás de la hora de las velas Por BokaroTraderFx El Indicador de Cuenta Atrás del Tiempo de Velas es una herramienta versátil diseñada para la plataforma de operaciones MetaTrader 5 (MT5). Proporciona a los operadores una cuenta atrás visual del tiempo restante para la vela actual en un gráfico. Las características clave incluyen:
Posición personalizable: Coloque el temporizador de cuenta atrás en cualquier esquina del gráfico para una visibilidad óptima. Color del texto por defecto: Se
FREE

Bienvenido a nuestro patrón de onda de precios MT5 --(Patrón ABCD)-- El patrón ABCD es un patrón comercial poderoso y ampliamente utilizado en el mundo del análisis técnico.
Es un patrón de precio armónico que los comerciantes utilizan para identificar oportunidades potenciales de compra y venta en el mercado.
Con el patrón ABCD, los operadores pueden anticipar posibles movimientos de precios y tomar decisiones informadas sobre cuándo ingresar y salir de las operaciones. Versión EA: Pri
FREE

El Buscador de rupturas (BF) es un potente indicador de MetaTrader 5 diseñado para detectar posibles rupturas y oportunidades de ruptura en la acción del precio. Analizando los pivotes máximos y mínimos durante un periodo definido por el usuario, identifica zonas de consolidación en las que el precio ha probado repetidamente niveles de resistencia o soporte dentro de un canal estrecho. Cuando el precio rompe estas zonas con suficiente confirmación (en función del número mínimo de pruebas y el u
FREE

El indicador MTF Candlestick Patterns Detector es un completo sistema de inteligencia de tendencias y momentos diseñado para eliminar el ruido del mercado y proporcionar claridad de nivel institucional a los operadores minoristas. Se especializa en la detección de señales de alta probabilidad mediante la fusión de la geometría de la acción del precio con la confluencia temporal. A continuación le explicamos por qué esta herramienta cambiará las reglas del juego de su mesa de negociación: Funcion

Visión general El indicador Smart Money Structure Markup para MetaTrader 5 es una potente herramienta diseñada para ayudar a los operadores a identificar estructuras de mercado clave basadas en las populares estrategias Smart Money Concepts (SMC). Este indicador detecta micro-estructuras de mercado, proporcionando información sobre los movimientos de precios y los posibles cambios de tendencia. Destaca elementos importantes como la ruptura válida de la estructura (BOS), el cambio de carácter (CH
FREE
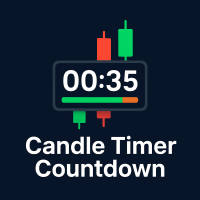
Candle Timer Countdown v2.5 es un indicador MQL5 avanzado diseñado para mejorar la precisión de sus operaciones. Proporciona una cuenta atrás en tiempo real para cada vela mientras analiza simultáneamente múltiples marcos temporales para detectar la dirección de la tendencia y posibles reversiones tempranas. Sus principales características son: Cuenta atrás de velas y barra de progreso: Controle el tiempo exacto restante para cada vela con una clara visualización del progreso. Detección avanzada
FREE

Si te gusta este proyecto, deja una revisión de 5 estrellas. Este indicador dibuja los precios abiertos, altos, bajos y finales para los
especificados
período y se puede ajustar para una zona horaria específica. Estos son niveles importantes considerados por muchos institucionales y
profesionales
comerciantes y puede ser útil para que usted sepa los lugares donde podrían ser
más
activo. Los períodos disponibles son: Día previo. Semana anterior. Mes anterior. Barrio anterior. Año anterior. O:
FREE

Opening‑Range Sessions (GMT‑Aware) es un indicador ligero que dibuja automáticamente el rango de apertura — máximo, mínimo y un rectángulo coloreado — para las principales ventanas de liquidez del mercado Forex: Sídney, Tokio, Londres y Nueva York . El indicador detecta de forma automática la zona horaria del servidor del bróker, por lo que cada sesión comienza a la hora correcta, independientemente de dónde se encuentre el servidor o el trader. Funciones clave Detección automática de la zona ho
FREE
Descripción general
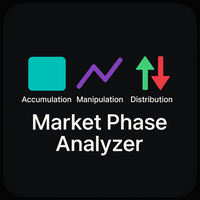
Señales claras y reglas simples para identificar las tres fases clave del mercado. Este indicador detecta en tiempo real una fase de acumulación basada en la sesión asiática, identifica posibles barridas de liquidez durante la fase de manipulación y confirma la fase direccional en la distribución. Muestra flechas verdes para la fase alcista y rojas para la fase bajista, dibuja la caja asiática con color y borde personalizables, y opcionalmente la línea de apertura diaria par
FREE

Descripción detallada:
El indicador de puntos pivote está diseñado para los operadores que se basan en puntos pivote, puntos medios y niveles de soporte/resistencia para sus estrategias de negociación. Al calcular y trazar automáticamente estos niveles (basándose en los precios máximo, mínimo y de cierre del periodo anterior) , el indicador proporciona una representación visual clara de las zonas de precios críticas en las que el mercado puede invertirse o romperse. La herramienta es especialme
FREE

Este indicador se ha desarrollado para identificar y mostrar estas tendencias de forma rápida y sencilla, permitiéndole ver al instante los pares de divisas que están en tendencia y los que no, y en todos los plazos, con un solo clic. Los 28 pares de divisas se muestran como un abanico que va de fuerte a débil y viceversa, y por eso lo llamamos "matriz de divisas". Los 28 pares se despliegan ante usted, ofreciéndole una descripción visual instantánea de los pares que tienen una tendencia fuerte,

ZenTrend - Indicador de Tendencia Adaptativo para MetaTrader 5 ZenTrend es un innovador indicador de tendencia para MetaTrader 5 que traza una línea de tendencia flexible e informativa en el gráfico, basada en cálculos de medias móviles adaptativas. Esta herramienta es ideal para los operadores que buscan una identificación precisa y oportuna de la dirección de la tendencia en cualquier mercado financiero: divisas, acciones, índices, criptomonedas y materias primas. Características principales d

¡Bienvenido al indicador EPo-CreW Forex Super ORB-H4!
Esta guía le enseñará cómo utilizar esta poderosa herramienta para identificar oportunidades de trading de alta probabilidad, basadas en el primer rango de apertura de 4 horas del mercado. Tanto si es principiante como si es un trader experimentado, este sistema le ayudará a operar con mayor confianza y consistencia. ESTE ES UN PRODUCTO DEMO. CADUCARÁ 30 DÍAS DESPUÉS DE LA FECHA DE INSTALACIÓN. Versión completa disponible aquí: https://www.mq
FREE

** Todos los símbolos x Todos los plazos escanean con sólo pulsar el botón del escáner ** Descuento: El precio es de $ 50, pero ahora es sólo $ 39, oferta por tiempo limitado está activo.
*** Ponte en contacto conmigo para enviarte instrucciones y añadirte en "Trend Reversal group" para compartir o ver experiencias con otros usuarios. Introducción: Las líneas de tendencia son el análisis técnico más famoso en el trading . Las líneas de tendencia se forman continuamente en los gráficos de los me

Synthetic Trend AI: un indicador de tendencia inteligente impulsado por inteligencia artificial
El indicador Synthetic Trend AI es una potente herramienta de análisis técnico que combina la fórmula clásica SuperTrend con algoritmos de inteligencia artificial (k-Vecinos Más Cercanos, KNN) y análisis de volumen. Está diseñado para quienes desean profundizar en el mercado y tomar decisiones más acertadas.
¿Qué hace único a Synthetic Trend AI? Pronóstico de tendencias con IA: Utiliza el algoritmo
FREE
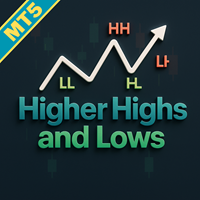
Mejore su trading de acción del precio con el indicador Higher Highs and Lows MT5, una herramienta robusta que aprovecha el análisis fractal para identificar puntos de swing clave y patrones que definen tendencias como Higher Highs (HH), Lower Highs (LH), Lower Lows (LL) y Higher Lows (HL) para obtener insights claros sobre la dirección del mercado. Basado en principios fundamentales de acción del precio arraigados en la Teoría de Dow de principios del siglo XX y popularizados en el trading mod
FREE

Por qué la mayoría de los indicadores de divergencia RSI tienen retraso o repintan Si has probado suficientes indicadores de divergencia, seguramente te has encontrado con uno de estos dos problemas: o la divergencia aparece demasiado tarde,
o la señal de divergencia desaparece de repente. Esto no ocurre porque el indicador esté “mal programado”.
La razón está en la propia lógica del cálculo de la divergencia: existe un compromiso inevitable. Si quieres señales inmediatas, normalmente tendrás qu
FREE

DRX Smart Risk | Planificador de Trading Profesional Deje de adivinar. Empiece a planificar con precisión. Calcular manualmente los lotes y el ratio riesgo/beneficio es lento y propenso a errores. DRX Smart Risk trae el flujo de trabajo intuitivo de las plataformas profesionales (como TradingView) directamente a su MetaTrader 5. El Problema: Las líneas estándar de MT5 son torpes. Desaparecen al cambiar de timeframe y le obligan a calcular el R:R mentalmente. La Solución: DRX Smart Risk es una he
FREE
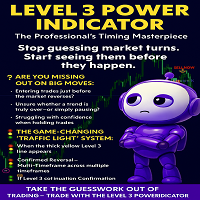
INDICADOR DE POTENCIA NIVEL 3
La obra maestra del cronometraje profesional
Deje de adivinar los giros del mercado. Empiece a verlos antes de que ocurran.
---
¿Se está perdiendo los grandes movimientos?
¿Inicia operaciones justo antes de que el mercado se invierta?
¿No está seguro de si una tendencia ha terminado de verdad o simplemente se ha detenido?
¿Le cuesta confiar en sus operaciones?
No es el único. La mayoría de los operadores luchan con estos desafíos exactos... hasta que desc
FREE

Herramienta de Análisis de Tendencia Multi-Temporal ¿Quieres seguir tendencias en múltiples marcos temporales sin cambiar constantemente de gráficos? Smart Trend Consensus MT5 es una herramienta de análisis técnico que consolida datos de 7 marcos temporales simultáneamente (M1, M5, M15, M30, H1, H4, D1). El indicador utiliza 7 criterios técnicos para evaluar el estado de la tendencia en cada marco temporal y muestra toda la información en un panel visual. Una herramienta de análisis m

Pips Hunter PRO ha sido desarrollado durante varios años y es una versión mejorada de su predecesor. Este poderoso indicador analiza el mercado y el histórico de precios para generar entradas de compra y venta. Para el cálculo de estas entradas utiliza diferentes indicadores que funcionan en conjunto así como un complejo logaritmo estadístico que filtra las entradas menos favorables y las elimina / Versión MT4 .
Características No repinta
Este indicador no cambia sus valores cuando llegan n
FREE

Este indicador proporciona la capacidad de reconocer el patrón SMC, esencialmente una versión condensada del modelo Wyckoff. Una vez que el patrón es confirmado por RTO, representa una oportunidad de inversión significativa. Existen numerosos indicadores relacionados con el SMC más allá del mercado, pero este es el primer indicador que aprovecha los patrones para identificar acciones específicas de BigBoy para navegar en el mercado. El patrón SMC (Smart Money Concept) es un método de análisis de

Dark Oscillator es un indicador para el comercio intradía. Este indicador se basa en la estrategia de Contratendencia , tratando de interceptar los cambios en la dirección, por adelantado en comparación con los indicadores de seguimiento de tendencia. Podemos entrar en buen precio con este indicador, con el fin de seguir la inversión de la tendencia en el instrumento actual. Se aconseja utilizar brokers ECN de bajo spread. Este indicador no repinta y no lag . Los plazos recomendados son M5, M15
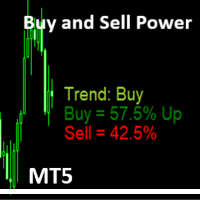
Sencillo indicador que muestra el volumen de compra y venta en porcentaje. El indicador Potencia de Compra y Venta para MetaTrader 5 calcula y muestra los porcentajes estimados de volumen de compra/venta durante un periodo definido por el usuario (por defecto: 14 barras) utilizando datos de volumen de ticks. Superpone etiquetas de texto en el gráfico mostrando Buy % (con "Up" si >51%), Sell % (con "Dn" si >51%), y una señal de tendencia basada en umbrales: Neutral (<55%), Tendencia: Compra/Venta
FREE

Vela HTF de Haven: el poder del marco de tiempo superior en su gráfico Presentamos la vela HTF de Haven , una potente herramienta que muestra las velas de un marco de tiempo superior (HTF) directamente en su gráfico de trabajo. Deje de cambiar constantemente de ventana y empiece a ver el verdadero contexto del mercado, que es la base para tomar decisiones de trading bien fundamentadas. Otros productos -> AQUÍ . Características clave y el concepto "Power of 3" Análisis basado en el concepto "Pow
FREE

Introduciendo Quantum Breakout PRO , el innovador indicador MQL5 que está transformando la forma en que comercia con Breakout Zones. Desarrollado por un equipo de comerciantes experimentados con experiencia comercial de más de 13 años, Desglose cuántico PRO está diseñado para impulsar su viaje comercial a nuevas alturas con su innovadora y dinámica estrategia de zona de ruptura.
El indicador de ruptura cuántica le dará flechas de señal en las zonas de ruptura con 5 zonas ob
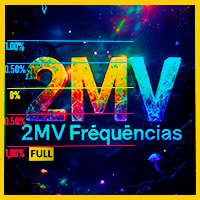
Muestra AUTOMÁTICAMENTE los NIVELES DE VARIACIÓN porcentual del día en forma de SOPORTES y RESISTENCIAS — este es el indicador 2MV Frequencies Full. Identifique rápidamente las zonas de soporte y resistencia a través de los niveles porcentuales (por ejemplo: 0,50%, 1%, 1,50%) — totalmente personalizables para anticipar reversiones, rupturas y zonas de congestión con precisión y claridad visual, basados en la metodología exclusiva de Evandro Soares. Identifique rápidamente zonas de s

Introducción
Reversal Candles es un vanguardista indicador de Forex sin repintado, diseñado para predecir los retrocesos del precio con notable precisión mediante una sofisticada combinación de señales.
Señal Comprar cuando la última vela cerrada tiene un color más oscuro (personalizable) y una flecha hacia arriba está pintado debajo de ella Vender cuando la última vela cerrada tiene un color más oscuro (personalizable) y una flecha hacia abajo está pintado por encima de ella
FREE

Necesario para los operadores: herramientas e indicadores Ondas calcular automáticamente los indicadores, el comercio de tendencia del canal Perfecta tendencia de onda de cálculo automático de cálculo de canales , MT4 Perfecta tendencia de onda de cálculo automático de cálculo de canales , MT5 Copia local de trading Copia fácil y rápida , MT4 Copia fácil y rápida , MT5 Copia Local Trading Para DEMO Copia fácil y rápida , MT4 DEMO Copia fácil y rápida , MT5
DEMO
Renko PRO->>>
La visualización
FREE

¡La tendencia es tu amiga!
Fíjate en el color del indicador y opera en esa dirección. No se repinta. Después de que cada vela se cierra, ese es el color de la tendencia. Puedes centrarte en tendencias más cortas y rápidas o en tendencias mayores, sólo tienes que probar qué es lo más adecuado para el símbolo y el marco temporal en el que operas. Simplemente cambie el parámetro "Longitud" y el indicador se adaptará automáticamente. También puede cambiar el color, el grosor y el estilo de las lín

Royal Scalping Indicator es un indicador avanzado de adaptación de precios diseñado para generar señales de trading de alta calidad. Incorpora capacidades multi-marco de tiempo y multi-moneda que lo hacen aún más potente para tener configuraciones basadas en diferentes símbolos y marcos de tiempo. Este indicador es perfecto para las operaciones de scalping, así como para las operaciones swing. Royal Scalping no es sólo un indicador, sino una estrategia de trading en sí misma. Características Alg

Para aquellos que luchan con indicadores de Perfil de Volumen/Perfil de Mercado sobrecargados, aquí tienen una solución que contiene sólo la información del Punto de Control (POC). Súper rápido y fiable, el indicador Mini POC presenta esta información vital visualmente dentro de su gráfico. Totalmente personalizable en plazos divisibles, tipo de Volumen, método de cálculo y cuántos días atrás necesita.
AJUSTES Marco temporal para dividir los POC dentro del día. Tipo de Volumen a utilizar: Ticks
FREE
Indicador ICONIC SMC — Opera con claridad de nivel institucional Por fin, SMC objetivo, sin trabajo manual tedioso . ¿Cansado de pasar horas marcando gráficos para luego perder la entrada por unos pocos pips? ¿Dudas de tu lectura cuando hay dinero real en juego? La era del SMC subjetivo y lento ha terminado. El Indicador ICONIC SMC no es “otra herramienta más”. Es un motor de análisis de nivel institucional que automatiza todo el flujo de trabajo de Smart Money Concepts y convierte tu gráfico en
FREE

Institutional Tick Engine Lite: Herramienta de Velocidad de Ticks y Reversión Institutional Tick Engine Lite es un indicador técnico diseñado para analizar la velocidad del mercado y la lógica de la microestructura utilizando datos de ticks en bruto. Como versión de entrada de la suite profesional, procesa datos en tiempo real para proporcionar métricas para scalping y trading intradía. Características Incluidas Monitor de Velocidad de Ticks: Histograma en tiempo real que muestra "Ticks Por Segu
FREE
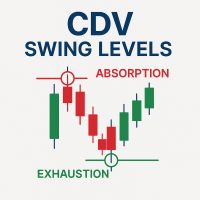
Nivel de oscilación del volumen delta acumulado (CDV) - Detector de absorción y agotamiento
Full Documentation: [ Download PDF ] CDV Swing Aggressive Score Guide : [ Download PDF ] Free Professional Education Course: After purchasing, contact me to receive access to the complete CDV Professional Training Video Course.
Análisis profesional de CDV para inversiones de mercado Este indicador identifica patrones de absorción y agotamiento de CDV para detectar con precisión los puntos de in

¡Si te gusta esta herramienta gratuita, echa un vistazo a mi EA que está actualmente en una venta de lanzamiento por sólo $ 39 ! https://www.mql5.com/zh/market/product/159451?source=Site Descripción breve: Un indicador técnico especializado diseñado para operar con Oro (XAUUSD). Identifica automáticamente las oscilaciones del mercado, traza clave 0,382 y 0,618 niveles de retroceso de Fibonacci, y sen móvil push nothiations no sat 面紙 面 面面 筆/內托 son detectados. 【Características principales】 Modo d
FREE

Ritz Smart Detection COMPRA Y VENTA
El Ritz Smart Detection BUY & SELL es un indicador de negociación de nueva generación diseñado para detectar señales de entrada de alta probabilidad mediante la combinación de la medición de la volatilidad basada en ATR , la detección de inversión de tendencia y la tecnología de alerta inteligente . Ofrece oportunidades de COMPRA/VENTA en tiempo real con objetivos y niveles de riesgo adaptables, lo que lo convierte en una herramienta versátil tanto para scalp
FREE

El VWAP, o precio medio ponderado por volumen, ayuda a los operadores e inversores a observar el precio medio que los grandes operadores consideran el "precio justo" para ese movimiento. Muchas instituciones utilizan el VWAP para establecer grandes operaciones.
En este indicador, puede disfrutar de las siguientes características:
VWAP Diario, con opción de mostrar su precio actual junto al gráfico VWAP Semanal, con opción de mostrar su precio actual junto al gráfico VWAP mensual, con la opci
FREE
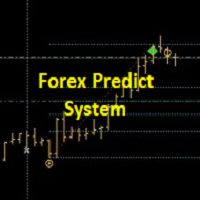
+++++++++++++++++++++++++++++++++++++++++++++++++++++++++++++++++++++++++++++++++++++++++++++++++ +++ Enlace a la versión gratuita de EURUSD --> https://www.mql5.com/en/market/product/156904?source=Unknown +++++++++++++++++++++++++++++++++++++++++++++++++++++++++++++++++++++++++++++++++++++++++++++++++ Hola Trader, Esta es una estrategia tradicional de GANN & FIBONACCI basada en la detección de un movimiento impulsivo en la dirección opuesta. Esto se llama Breakout. En el momento de la ruptura,

SmartScalp M1 - Scalping Rápido con Tendencias Precisas y Señales Limpias SmartScalp M 1 es un indicador de scalping de alta velocidad optimizado específicamente para el marco temporal M1. Combina Supertrend y Heiken Ashi para identificar claros cambios de tendencia y filtrar eficazmente el ruido del mercado. Las señales de COMPRA y VENTA se generan cuando la Supertendencia se invierte y son confirmadas por los colores de las velas Heiken Ashi, reduciendo significativamente las señales falsas en

indicador técnico MT5 sin repintado funciona en todos los marcos temporales desde 1 minuto hasta el marco temporal mensual la flecha de compra y venta de trade vision es un indicador sintético y multidivisa Trade vision flecha de compra y venta viene con alertas Push la flecha púrpura busca oportunidades de venta la flecha blanca busca oportunidades de compra. espere a que se cierre la vela y aparezca la flecha antes de realizar cualquier operación.
FREE

El indicador Volume Profile Fixed Range es una potente herramienta diseñada para las plataformas MetaTrader 5 (MT5). Visualiza la distribución del volumen de negociación en un rango histórico fijo de barras, ayudando a los operadores a identificar los niveles de precios clave en los que se ha acumulado un volumen significativo. Esto ayuda a detectar zonas de soporte/resistencia, áreas de valor y posibles puntos de reversión o ruptura. A continuación se ofrece una descripción detallada de sus ca
FREE

AHORA PUEDE DESCARGAR VERSIONES GRATUITAS DE NUESTROS INDICADORES DE PAGO . ES NUESTRA FORMA DE RETRIBUIR A LA COMUNIDAD. >>> IR AQUÍ PARA DESCARGAR
Este sistema es un sistema Heiken Ashi basado en cálculos RSI. El sistema es un script gratuito de código abierto publicado originalmente en TradingView por JayRogers . Nos hemos tomado la libertad de convertir la secuencia de comandos de pino a Mq4 indicador. También hemos añadido una nueva característica que permite filtrar las señales y reduce
FREE

El indicador Trend Line Map es un complemento para Trend Screener Indicator. Funciona como un escáner para todas las señales generadas por el evaluador de tendencias (Trend Line Signals).
Es un escáner de líneas de tendencia basado en el indicador de evaluación de tendencias. Si no tiene el indicador Trend Screener Pro, Trend Line Map Pro no funcionará. It's a Trend Line Scanner based on Trend Screener Indicator. If you don't have Trend Screener Pro Indicator, the Trend Line Map Pro will n

Haven Bands Reversion – Indicador profesional para operar el retorno a la media Presentamos Haven Bands Reversion – una herramienta potente y precisa, creada para traders que utilizan estrategias de retorno a la media. A diferencia de las Bandas de Bollinger clásicas, este indicador se basa en la Media Móvil Ponderada por Volumen (VWMA) , lo que hace que sus canales sean más sensibles a la actividad real del mercado. Lo más importante: el indicador genera señales que no se repintan , proporcioná
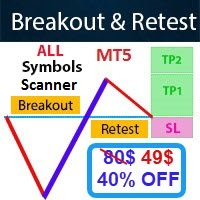
- Precio real es de 80 $ - 40% de descuento (Es 49 $ ahora) ¡Póngase en contacto conmigo para la instrucción, cualquier pregunta! - No repintado - Yo sólo vendo mis productos en Elif Kaya Perfil, cualquier otro sitio web son robados versiones antiguas, Así que no hay nuevas actualizaciones o apoyo. - Actualización de por vida libre Producto relacionado: Bitcoin Experto Introducción La estrategia Breakout and Retest se negocia con niveles de soporte y resistencia. implica que el precio rompa un

Descubre el poder de la armonía en los mercados con este avanzado indicador de patrones armónicos. Diseñado para traders técnicos exigentes, este indicador detecta automáticamente 11 de los patrones armónicos más conocidos, entre ellos el Gartley, Bat, Crab, Butterfly, Shark, Cypher y muchos más.
Gracias a su panel dinámico, puedes gestionar fácilmente la visibilidad de los patrones en el gráfico, activando o desactivando los que desees en tiempo real sin recargar tu plataforma. Esta flexibili
FREE

Indicador Lion Arrow Super Arrow para MetaTrader 5
El indicador Lion Arrow Super Arrow para MetaTrader 5 es un sistema híbrido de negociación que integra múltiples herramientas avanzadas de análisis técnico para generar señales de negociación de alta calidad. Mediante la combinación de indicadores basados en la tendencia, el impulso y la presión, su objetivo es reducir las señales falsas y mejorar la precisión de entrada. Componentes principales del indicador El indicador Lion Arrow Super Arrow
FREE

Una implementación de alta calidad del famoso indicador Super Trend , que no necesita presentación. Es completamente fiel al algoritmo original, e implementa muchas otras características útiles, como un cuadro de mandos multi-marco de tiempo. [ Guía de Instalación | Guía de Actualización | Solución de Problemas | FAQ | Todos los Productos ] Fácil de operar Implementa alertas de todo tipo Implementa un panel de control multi-marco de tiempo No repinta ni retropinta Parámetros de entrada
Periodo
FREE

RiskKILLER_AI Navigator es un Asistente de Dirección del Mercado y Estrategia Multi-timeframe basado en IA. El rendimiento en el trading consiste en entender el mercado como lo hacen los profesionales. Eso es exactamente lo que ofrece el RiskKILLER_AI Navigator : Obtén perspectivas a nivel institucional con análisis de tendencia, sentimiento y macro impulsado por IA externo a MQL5 , adaptado a tu estilo de trading. Después de la compra, para obtener el Manual de Usuario: 1. publica un comentario
Indicador Trend BB MACD con Filtro ADX El Trend BB MACD con Filtro ADX es una herramienta técnica avanzada que combina Bandas de Bollinger (BB) , MACD y el Índice de Movimiento Direccional (ADX) , incorporando ahora un sistema completo de análisis direccional con +DI y -DI , así como opciones de confirmación cruzada con MACD. Está diseñado para ofrecer señales de trading precisas y filtradas, optimizadas para scalping, intradía y swing trading , ayudando a identificar no solo la dirección, sino
FREE

Volumes with Moving Average es un indicador de volumen simple y directo complementado con una media móvil.
¿Cómo se utiliza?
Es muy adecuado para filtrar señales al entrar en una operación tanto desde niveles de soporte/resistencia como en rupturas de volatilidad de canales de tendencia. También puede ser una señal para cerrar una posición por volumen.
Parámetros de entrada:
Volumes - volumen real o tick. MA_period - periodo de la media móvil.
FREE

Trend Trading es un indicador diseñado para sacar el máximo provecho posible de las tendencias que tienen lugar en el mercado, mediante el cronometraje de retrocesos y rupturas. Encuentra oportunidades comerciales al analizar qué está haciendo el precio durante las tendencias establecidas. [ Guía de instalación | Guía de actualización | Solución de problemas | FAQ | Todos los productos ]
Opere en los mercados financieros con confianza y eficiencia Aproveche las tendencias establecidas sin ser

Price Volume Distribution
Indicador de Volume Profile que analiza la distribución del volumen de negociación por nivel de precio. Muestra POC, Value Area, picos de volumen y filtrado de señales basado en zonas para MT5.
Descripcion
Price Volume Distribution es un indicador de análisis de volumen para MetaTrader 5. Calcula y muestra la distribución del volumen en los niveles de precio utilizando datos del marco temporal M1, proporcionando representación visual mediante barras de histograma y l

HiperCube AutoTrend Lines Código del -20% de descuento en Darwinex Zero: DWZ2328770MGM_20 Este indicador le ayuda a identificar fácilmente soportes y resistencias, dibujar líneas en el gráfico y saber dónde se encuentra un punto importante en el mercado. Esta herramienta es la mejor manera de semiautomatizar sus operaciones, haciendo parte del trabajo por usted. La resistencia o el soporte son niveles importantes que a veces son difíciles de identificar, pero ahora eso no le causará más confusi
FREE

Presentamos el MACD Enhanced , un indicador MACD (Moving Average Convergence Divergence) avanzado que proporciona a los operadores capacidades ampliadas para el análisis de tendencias e impulso en los mercados financieros. El indicador utiliza la diferencia entre las medias móviles exponenciales rápida y lenta para determinar el impulso, la dirección y la fuerza de la tendencia, creando señales visuales claras para posibles puntos de entrada y salida. Atención. Para obtener los mejores resultado
FREE
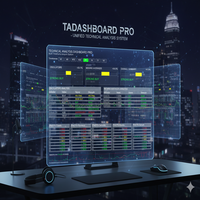
Technical Analysis Dashboard Pro ( TADashboard Pro) – Sistema Unificado de Análisis Técnico TADashboard Pro es un panel de análisis técnico avanzado que consolida múltiples indicadores y timeframes en una única interfaz visual. Diseñado para traders que requieren precisión y eficiencia, el sistema analiza simultáneamente 7 osciladores y 4 medias móviles across 8 timeframes diferentes, generando puntuaciones normalizadas que simplifican la toma de decisiones. Características Principales: Análisis
FREE

BlueBoat - Prime Cycle es un indicador técnico para MetaTrader 5 que visualiza ciclos de mercado basados en el modelo de ciclos de Fimathe (Marcelo Ferreira) . Identifica y muestra estructuras de ciclo históricas y en vivo, como CA, C1, C2, C3, etc., ayudando a los operadores a entender el ritmo y el momento del movimiento de los precios a través de múltiples sesiones. Esta herramienta es ideal para el análisis manual o como señal de apoyo en estrategias discrecionales. Características principal
Asistente inteligente para entradas precisas y oportunas al mercado. El indicador emite un pitido y alertas cuando el precio alcanza niveles. Puede establecer los niveles de soporte y resistencia manualmente o confiar esto a un algoritmo. En el momento en que el precio alcanza el nivel, los patrones de velas se marcan adicionalmente. Los patrones únicos de velas son una simbiosis de patrones clásicos y patrones de ruptura y caída de niveles. Para el comercio altamente rentable en la bolsa de val
FREE

Este indicador traza el perfil de volumen por Precio en el gráfico
Hay 5 maneras de verlo:
Por Volumen Total Operado (Versión Premium); Ticks de Volumen(Forex) Separado por Compradores y Vendedores (Versión Premium); Sólo Compradores (Versión Premium); Sólo Vendedores (Versión Premium); Balance comercial (Compradores - Vendedores) (Versión Premium); .
Es posible seleccionar cuántos días se calcularán los perfiles. (Versión Premium)
En el día actual recalcula los datos del histograma para
FREE

Indicador diario VWAP (Precio medio ponderado por volumen) Oferta especial Deje un comentario y obtenga el indicador Long & Short Cointegration Analyzer gratis - ¡sólo envíeme un mensaje!
Descripción El indicador diario VWAP (Precio medio ponderado por volumen) es una herramienta esencial para los operadores que buscan identificar el verdadero precio medio de un activo a lo largo del día, ajustado por el volumen negociado. Utilizado principalmente por operadores institucionales y profesionales,
FREE

Bienvenido al indicador de reconocimiento de patrones avanzado de Gartley Este indicador detecta el patrón Gartley basado en HH y LL de la estructura de precios y los niveles de Fibonacci, y cuando se alcanzan ciertos niveles de fib, el indicador mostrará el patrón en el gráfico. Versión MT4: WH Advanced Gartley Pattern MT4 **Este indicador es parte del combo Ultimate Harmonic Patterns MT5 , que incluye todo el reconocimiento de patrones.**
Características : Algoritmo avanzado para det
FREE

TickFlow es una herramienta de análisis de datos de ticks y de resaltado visual de zonas significativas en el gráfico. La utilidad agrega los ticks actuales e históricos, muestra el balance de compra/venta y ayuda a identificar los niveles de soporte/resistencia y las zonas de cluster. Esta es la versión para MetaTrader 4. Cómo funciona (breve) TickFlow recoge datos de ticks y los agrega por pasos de precios y velas. Basándose en los datos recogidos, el indicador construye capas visuales: conta

Es una herramienta de dibujo integrada en MetaTrader 5 inspirada en el software "Pointofix". Puede pintar, hacer anotaciones y dibujos en el gráfico en tiempo real. Funciona en múltiples marcos temporales, es decir, los dibujos se pueden visualizar en diferentes marcos temporales. Los dibujos también se guardan en archivos y se pueden restaurar incluso al reiniciar MetaTrader.
Simple y Práctico
Chart Pen está diseñado como una forma sencilla, bonita e innovadora de crear y gestionar todos sus
FREE
Engulfing Zone Sniper MT5 - Indicador de Señales y Zonas Multi-Tiempo El Engulfing Zone Sniper MT5 es una herramienta de análisis técnico diseñada para resaltar patrones de velas envolventes en combinación con zonas de soporte/resistencia adaptables. Proporciona marcadores visuales y alertas opcionales para ayudar a los operadores a identificar las reacciones de la estructura del mercado en múltiples marcos temporales. Características principales Detección Multi-Timeframe - Opción de escanear c

¿Está cansado de ser perseguido por picos y látigos?
No sea víctima de los movimientos erráticos del mercado. ¡Haga algo al respecto!
Tome decisiones más inteligentes al instante con el equilibrio preciso de filtros y estadísticas exactas de Impulse Pro.
El momento oportuno lo es todo en el trading
Para obtener más información, visite www.mql5.com/en/blogs/post/718212 ¡Anticipe el próximo gran movimiento antes de que se desarrolle en 3 sencillos pasos!
Ventajas que obtiene
Algoritmo de det
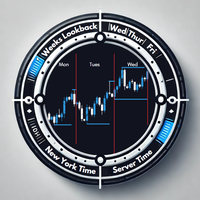
Visión general El indicador Separador de sesiones diarias es una potente herramienta diseñada para mejorar su experiencia de negociación marcando claramente las sesiones de negociación diarias en su gráfico. Ayuda a los operadores a visualizar los límites diarios, los máximos y mínimos de la sesión y los datos esenciales específicos del día para tomar decisiones informadas. Gracias a su perfecta integración en cualquier gráfico y a su adaptabilidad dinámica, este indicador es imprescindible para
FREE

Ekom Spike Detector Pro
Lleva tu trading al siguiente nivel con el Ekom Boom y Crash Spike Detector Indicator Pro, diseñado para traders serios que exigen más. Esta versión avanzada proporciona:
Características Clave: - Detección de Picos Precisa : Identifica patrones de picos de alta probabilidad en tiempo real utilizando la acción del precio. - Señales Visuales Claras: Muestra flechas de compra y venta claras en el gráfico para una fácil toma de decisiones. - Opciones de Alerta : - Ale
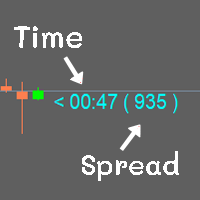
Muestra el tiempo de las velas y el spread. Todos los datos se mostrarán en una barra. Puede cambiar el color Puede fijar el tamaño según sea necesario
MT4 : Enlace https://www.mql5.com/en/market/product/102742 MT5 : Enlace https://www.mql5.com/en/market/product/102834
La mayoría de código libre en varios sitios web No lo escribí yo mismo. Sólo hago un poco.
Si te gusta, por favor, dar 5 estrellas con él. Gracias.
FREE

El indicador Advanced Trend Scalper MT5 está diseñado para ayudar tanto a los operadores principiantes como a los profesionales. El indicador analiza el mercado y le da señales de compra y venta. No utiliza ningún otro indicador, funciona sólo con las acciones del mercado. La señal aparece justo después del cierre de la vela y no se vuelve a pintar. El algoritmo eficiente proporciona un alto grado de fiabilidad de tales señales. Advanced Trend Scalper para el terminal MetaTrader 4 : https://www.
El Mercado MetaTrader es una plataforma única y sin análogos en la venta de robots e indicadores técnicos para traders.
Las instrucciones de usuario MQL5.community le darán información sobre otras posibilidades que están al alcance de los traders sólo en nuestro caso: como la copia de señales comerciales, el encargo de programas para freelance, cuentas y cálculos automáticos a través del sistema de pago, el alquiler de la potencia de cálculo de la MQL5 Cloud Network.
Está perdiendo oportunidades comerciales:
- Aplicaciones de trading gratuitas
- 8 000+ señales para copiar
- Noticias económicas para analizar los mercados financieros
Registro
Entrada
Si no tiene cuenta de usuario, regístrese
Para iniciar sesión y usar el sitio web MQL5.com es necesario permitir el uso de Сookies.
Por favor, active este ajuste en su navegador, de lo contrario, no podrá iniciar sesión.