适用于MetaTrader 5的技术指标 - 6

Overview The Smart Money Structure Markup Indicator for MetaTrader 5 is a powerful tool designed to help traders identify key market structures based on popular Smart Money Concepts (SMC) strategies. This indicator detects micro-market structures, providing insights into price movements and potential trend changes. It highlights important elements such as valid Break of Structure (BOS), Change of Character (CHoCH), and Inducement (IDM), helping traders to make informed decisions. Key Features Ma
FREE

The MTF Candlestick Patterns Detector indicator is a comprehensive Momentum & Trend Intelligence System designed to strip away market noise and provide institutional-grade clarity for retail traders. It specializes in high-probability signal detection by merging price action geometry with temporal confluence. Here is why this tool is a game-changer for your trading desk: Core Functionalities · Automated Candlestick Pattern Recognition: The indicator scans for high-alpha patterns (like E

Haven HTF Candle — 在您的图表上展现更高时间周期的力量 隆重推出 Haven HTF Candle — 一款强大的工具,可将更高时间周期 (HTF) 的K线直接显示在您的主图表上。无需再频繁切换窗口,即可洞察真实的市场背景,这是做出明智交易决策的基础。 其他产品 -> 此处 。 核心功能与“Power of 3”概念 基于“Power of 3” (AMD) 概念的分析: 该指标清晰地显示 更高时间周期K线的开盘价 — 这是此策略的一个关键水平。让您在较低时间周期上轻松识别吸筹 (Accumulation)、操纵 (Manipulation, Judas Swing) 和派发 (Distribution) 阶段。 即时趋势评估: 快速判断您当前时间周期上的走势在全局背景下是推动浪还是回调浪。 视觉便利性: 完全自定义更高时间周期K线的位置、颜色和数量,打造无干扰的理想工作区。 主要设置: Higher Timeframe – 选择要显示的更高时间周期。 Number of candles to display – 要显示的K线数量。 Bullish candle c
FREE
总体介绍
清晰的信号与简单的规则,帮助识别市场的三个关键阶段。本指标基于亚洲交易时段实时识别累积阶段,侦测操纵阶段中的流动性扫单,并在分配阶段确认趋势方向。上涨阶段显示绿色箭头,下跌阶段显示红色箭头,可自定义亚洲箱体的颜色与边框,并可选择显示当日开盘线以提供快速的日内参考。 工作原理
在累积阶段,指标会根据记录的最高点与最低点绘制价格箱体。在操纵阶段,检查价格是否突破箱体范围超过设定的点数。在分配阶段,通过 ATR 确认或固定点数突破来验证趋势方向。一旦条件满足,会在图表上绘制相应的箭头和阶段标签。 三阶段交易逻辑
累积(Accumulation)– 设置亚洲交易时段的时间范围,并绘制价格区间。
操纵(Manipulation)– 检测价格向上或向下突破箱体,识别扫单和假突破。
分配(Distribution)– 使用 ATR 动态阈值或固定点数确认突破方向。 图表显示内容
可自定义颜色和边框的亚洲箱体,可选择显示在K线的上方或下方。
经过优化的上涨与下跌阶段箭头,便于日内交易读取。
当日开盘线(Daily Open)帮助判断日内方向,并清晰区分不同交易日。 主要参数
Ses
FREE

The Breakout Finder (BF) is a powerful MetaTrader 5 indicator designed to detect potential breakout and breakdown opportunities in price action. By analyzing pivot highs and lows over a user-defined period, it identifies consolidation zones where price has repeatedly tested resistance or support levels within a narrow channel. When price breaks out of these zones with sufficient confirmation (based on the minimum number of tests and channel width threshold), the indicator visually highlights th
FREE

DRX Smart Risk | 专业交易规划工具 停止猜测。开始精准规划。 手动绘制线条或计算手数既缓慢又容易出错。 DRX Smart Risk 将专业图表平台(如 TradingView)的直观工作流程带入您的 MetaTrader 5 终端——而且更快、更智能、完全集成。 问题: MT5 的标准线条很笨拙。难以抓取,切换周期时会消失,而且您必须在脑海中计算盈亏比 (R:R)。 解决方案: DRX Smart Risk 是一款高端视觉覆盖工具。它在图表上绘制专业的风险/回报框,实时计算 所有数据 。只需拖动线条,工具就会确切告诉您风险金额和潜在利润。 核心功能: "Smart Drag" 智能拖拽技术: 独特的“锚点逻辑”确保止盈和止损框同步移动。无延迟,极度流畅。 一键切换 (One-Click Switch): 入场线附带智能按钮,让您瞬间从 做多 (LONG) 切换到 做空 (SHORT) 。 自动翻转 (Auto-Flip): 只需将止盈目标拖到入场线下方,工具就会自动检测到您想做空,并为您翻转设置。 实时资金管理: 在面板中输入手数,工具即显示: "TP: +$4
FREE
Candle Timer Countdown v2.5 is an advanced MQL5 indicator designed to enhance your trading precision. It provides a live countdown for each candle while simultaneously analyzing multiple timeframes to detect trend direction and potential early reversals. Key features include: Candle Countdown & Progress Bar: Monitor the exact time remaining for each candle with a clear progress visualization. Advanced Trend Detection: Analyze both fast and slow trends with configurable sensitivity and multi-time
FREE

合成趨勢 AI-一款由人工智慧驅動的智慧趨勢指標
合成趨勢 AI 指標是一款強大的技術分析工具,它將經典的超級趨勢公式與人工智慧演算法(k-最近鄰,KNN)和成交量分析相結合。它專為那些希望深入了解市場並做出更自信決策的人而設計。
合成趨勢 AI 的獨特之處: AI 趨勢預測:使用 KNN 演算法分析歷史資料並預測價格走勢方向。 成交量分析:內建的 VWMA(成交量加權移動平均線)讓您可以考慮走勢的強度,而不僅僅是其方向。 靈活的靈敏度設定:您可以調整相鄰點的數量 (k) 和資料量 (n),以精確適應您的交易風格。 視覺化趨勢訊號:價格下方的綠線表示看漲趨勢,價格上方的紅線表示看跌趨勢。 動態追蹤停損:此指標可用作智慧止損,根據價格和成交量做出反應。
該指標適用於哪些人? 尋求更精准入場和出場點的交易者 重視可靠訊號的投資者 任何希望將傳統方法和技術方法結合在一個工具中的人
FREE

This indicator has been developed to identify and display these trends quickly and easily, allowing you to see instantly, those currency pairs which are trending, and those which are not – and in all timeframes, with just one click. The 28 currency pairs are displayed as a fan as they sweep from strong to weak and back again, and this is why we call it the ‘currency array’. All 28 pairs are arrayed before you, giving an instant visual description of those pairs that are trending strongly, those

ZenTrend — Adaptive Trend Indicator for MetaTrader 5 ZenTrend is an innovative trend indicator for MetaTrader 5 that plots a flexible and informative trend line on the chart, based on adaptive moving average calculations. This tool is ideal for traders seeking precise and timely identification of trend direction on any financial market: forex, stocks, indices, cryptocurrencies, and commodities. Key Features of ZenTrend 1. Four Types of Moving Averages Supported
ZenTrend allows you to choose fro

如果你象这个项目一样,就有5个饥饿审查。 这项指标采用了既定价格的公开、高、低价和关闭价格
可以对特定时间区加以调整。 许多机构和专业人士都认为这些是重要的。
贸易商可以为你了解他们可能更进一步的地点,
积极。 现有期间为: 前一日。 前一星期。 曾任Month。 曾任。 前一年。 或: 目前日。 目前周。 目前 Month。 目前配额。 今年。
FREE
ICONIC SMC 指标 — 以机构级清晰度交易 终于实现 客观化的 SMC ——告别繁琐手工。 花上数小时标注图表,结果入场却差了几个点?资金上阵时开始怀疑自己的判断? 主观、耗时的 SMC 已成过去式。 ICONIC SMC 指标 并非“又一个工具”。它是 机构级分析引擎 ,可自动化完整的 Smart Money Concepts(SMC) 工作流,把你的图表变成 实时高概率机会仪表盘 。停止猜测,用 数据驱动的清晰度 开始执行。 为什么选择 ICONIC?一体化优势 抛弃零散的五个工具。 ICONIC SMC 将专业分析的所有关键要素,统一到 一套一致的系统 中。 核心引擎(Core Engines) 自动化市场结构(Automated Market Structure) 以手术刀般的精度 即时标绘 BOS 与 CHOCH ——一眼看清谁在掌控市场。 精准 POI 识别(Precision POI Detection) 自动识别并绘制 Order Blocks(OB) 与 Fair Value Gaps(FVG) ; 实时 标记已**缓释/兑现(mitigated)**的区域。
FREE

提升您的价格行动交易,使用 Higher Highs and Lows MT5 指标,这是一个强大的工具,利用分形分析来精确定位关键摆动点,并识别定义趋势的模式,如 Higher Highs (HH)、Lower Highs (LH)、Lower Lows (LL) 和 Higher Lows (HL),以清晰洞察市场方向。源于 1900 年代初的道氏理论基础价格行动原则,并在现代交易中由专家如 Al Brooks 在其 "Trading Price Action" 系列中推广,这个指标已成为交易者识别趋势延续和反转的必备工具。它特别受欢迎于外汇、股票和加密交易者,因为它能够确认上升趋势 (HH/HL) 或下降趋势 (LL/LH),帮助过滤噪音、在回撤期间定时入场,并避免假突破——在波动会话中提高准确性,减少情绪决策,并在从剥头皮到持仓交易的策略中改善整体盈利能力。 Higher Highs and Lows MT5 在图表上直接叠加可自定义的箭头和文本标签,HH 用红色 (向下箭头符号 234),LH 用珊瑚色,LL 用绿色 (向上箭头 233),HL 用石灰绿色,允许在不杂乱的情
FREE
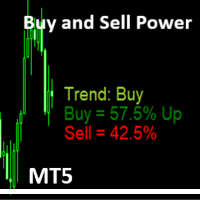
Simple Indicator that shows the Buy and Sell volume in percent. The Buy and Sell Power indicator for MetaTrader 5 calculates and displays estimated buy/sell volume percentages over a user-defined period (default: 14 bars) using tick volume data. It overlays text labels on the chart showing Buy % (with "Up" if >51%), Sell % (with "Dn" if >51%), and a trend signal based on thresholds: Neutral (<55%), Trend: Buy/Sell (55%+), Trend: Strong Buy/Sell (62%+), Trend Max UP/Down (65%+), or Trend change s
FREE

Detailed Description:
The Pivot Points Indicator is designed for traders who rely on pivot points, midpoints and support/resistance levels for their trading strategies. By automatically calculating and plotting these levels (based on the previous period's high, low, and close prices) , the indicator provides a clear, visual representation of critical price areas where the market may reverse or break out.The tool is particularly useful for day traders and swing traders looking to base th
FREE

** All Symbols x All Timeframes scan just by pressing scanner button ** Discount: The price is $50$, But now it is just $39, Limited time offer is active.
*** Contact me to send you instruction and add you in "Trend Reversal group" for sharing or seeing experiences with other users. Introduction: Trendlines are the most famous technical analysis in trading . Trendlines continually form on the charts of markets across all the different timeframes providing huge opportunities for traders

多时间框架趋势分析工具 想要在多个时间框架上追踪趋势,而无需不断切换图表? Smart Trend Consensus MT5 是一款技术分析工具,可同时整合 7个时间框架 的数据(M1、M5、M15、M30、H1、H4、D1)。该指标使用 7项技术标准 评估每个时间框架的趋势状态,并在可视化仪表板上显示所有信息。 一款多维分析工具,帮助交易者节省市场监控时间。 User Guide | Other languages 核心功能 7时间框架实时分析 在单一仪表板上监控M1到D1。无需切换图表或手动计算来比较多个时间框架。 7项标准评估系统 每个时间框架基于7个技术因素进行分析: ADX方向指数(+DI对比-DI) EMA50位置(价格相对于快速均线) EMA200对齐(快速MA与慢速MA的关系) MACD动量(MACD线对比信号线) RSI振荡(相对于50水平的位置) 更高高点形态(更高的波动结构) 更高低点形态(更高的波动结构) 每个标准等于一"票"。结果被汇总并分类:强趋势、弱趋势或横盘。 汇聚分数(0-100%) 衡量7个时间框架之间的对齐程度。高汇聚度

This indicator provides the ability to recognize the SMC pattern, essentially a condensed version of the Wyckoff model. Once the pattern is confirmed by RTO, it represents a significant investment opportunity. There are numerous indicators related to SMC beyond the market, but this is the first indicator to leverage patterns to identify specific actions of BigBoy to navigate the market. The SMC (Smart Money Concept) pattern is a market analysis method used to understand the behavior of "smart

LEVEL 3 POWER INDICATOR
The Professional’s Timing Masterpiece
Stop guessing market turns. Start seeing them before they happen.
---
Are You Missing Out on Big Moves?
Entering trades just before the market reverses?
Unsure whether a trend is truly over—or simply pausing?
Struggling with confidence when holding trades?
You’re not alone. Most traders wrestle with these exact challenges… until they discover the Level 3 Power Indicator.
---
The Game-Changing “Traffic Light” Syst
FREE

Dark Oscillator is an Indicator for intraday trading. This Indicator is based on Counter Trend strategy, trying to intercept changes in direction, in advance compared trend following indicators. We can enter in good price with this Indicator, in order to follow the inversion of the trend on the current instrument. It is advised to use low spread ECN brokers. This Indicator does Not repaint and N ot lag . Recommended timeframes are M5, M15 and H1. Recommended working pairs: All. I nst

介绍 Quantum Breakout PRO ,突破性的 MQL5 指标,正在改变您交易突破区域的方式!由拥有超过13年交易经验的资深交易员团队开发, 量子突破 PRO 旨在通过其创新和动态的突破区域策略将您的交易之旅推向新的高度。
量子突破指标将为您提供带有 5 个利润目标区域的突破区域的信号箭头,以及基于突破框的止损建议。
它既适合新手交易者,也适合专业交易者。
量子 EA 通道: 点击这里
重要的!购买后请私信我领取安装手册。 建议:
时间范围:M15 货币对:GBPJPY、EURJPY、USDJPY、NZDUSD、XAUUSD 账户类型:ECN、Raw 或 Razor,点差极低 经纪商时间:GMT +3 经纪商:IC Markets、Pepperstone with Raw 和 Razor 的点差最低
规格:
不重漆! 最多 5 个建议利润目标区域 建议止损水平 可定制的盒子。您可以设置自己的 Box Time Start 和 Box Time End。
接触
如果您有任何疑问或需要帮助,请通过私人消息与我联系。
Автоматически отображает УРОВНИ ДНЕВНЫХ ПРОЦЕНТНЫХ ИЗМЕНЕНИЙ в виде УРОВНЕЙ ПОДДЕРЖКИ и СОПРОТИВЛЕНИЯ — это индикатор 2MV Frequencies Full. Быстро определяйте зоны поддержки и сопротивления с помощью процентных уровней (например: 0,50%, 1%, 1,50%) — полностью настраиваемых, чтобы заранее видеть развороты, пробои и зоны консолидации с высокой точностью и визуальной ясностью, основанных на эксклюзивной методике Эвандро Соареса. Быстро определяйте зоны поддержки и сопротивления .
Пре

交易实用必备工具指标 波浪自动计算指标,通道趋势交易 完美的趋势-波浪自动计算通道计算 , MT4版本 完美的趋势-波浪自动计算通道计算 , MT5版本 本地跟单复制交易 Easy And Fast Copy , MT4版本 Easy And Fast Copy , MT5版本 本地跟单复制交易 模拟试用 Easy And Fast Copy , MT4 模拟账号运行 Easy And Fast Copy , MT5 模拟账号运行 砖图PRO->>>
砖图在主图上的显示 .
砖形图因为比较理想地剔除掉了价格毛刺,因此,看上去令人感觉非常舒服。特别是, 在其上建立基于形态的交易系统看起来非常理想。 比如,如果我们打算使用趋势线,我们会经常发现,有些趋势线的突破并没有多大的意义,它不过是在震荡而已。荡着荡着,趋势线就突破了。而使用砖形图就可以有效地避免类似的尴尬。
FREE

Opening‑Range Sessions(自动 GMT 版) 是一款轻量级指标,可为主要外汇交易时段—— 悉尼、东京、伦敦、纽约 ——自动绘制开盘区间(高点、低点及彩色箱体)。指标会自动读取经纪商服务器的时区,无论服务器或交易者身处何地,都会在正确的本地时间开始对应会话。 主要功能 自动时区检测 – 利用服务器的 GMT 偏移,无需手动调整时间,换服务器或 VPS 也不用重新设置。 四大内置会话 + 全日区间 – 您可单独启用/停用悉尼、东京、伦敦、纽约或 24 小时全日箱体。 点数 / 百分比两种区间模式 – 区间可设定为固定点数,或按开盘价百分比计算。 跨午夜完美处理 – 像悉尼这类跨越 00:00 的会话能完整显示,无箱体断裂。 丰富的图形自定义 – 各会话箱体独立配色,可调线型及粗细,自动居中标注会话名称。 实时更新 – 调整任意参数,效果即时呈现,无需刷新图表。 纯 MQL5 代码 – 无外部库,CPU/RAM 占用极低,VPS 环境也可安心运行。 快速上手 将指标拖入任意图表(任何周期)。 按策略选择 模式 (点数 / 百分比)并设置 区间数值 。 启用所需会话,调整颜
FREE

The trend is your friend!
Look at the color of the indicator and trade on that direction. It does not repaint. After each candle is closed, that's the color of the trend. You can focus on shorter faster trends or major trends, just test what's most suitable for the symbol and timeframe you trade. Simply change the "Length" parameter and the indicator will automatically adapt. You can also change the color, thickness and style of the lines. Download and give it a try! There are big movements w

Royal Scalping Indicator is an advanced price adaptive indicator designed to generate high-quality trading signals. Built-in multi-timeframe and multi-currency capabilities make it even more powerful to have configurations based on different symbols and timeframes. This indicator is perfect for scalp trades as well as swing trades. Royal Scalping is not just an indicator, but a trading strategy itself. Features Price Adaptive Trend Detector Algorithm Multi-Timeframe and Multi-Currency Trend Low

【为什么大多数 RSI 背离不是延迟,就是重绘?】 如果你用过足够多的背离指标,你一定遇到过这两种情况之一: 要么背离出现得很晚,要么背离会突然消失。 这并不是某个指标 “写得不好”,而是背离本身的计算逻辑,天然就存在取舍问题。 如果你想要 “立刻提示”,往往就要承受重绘; 如果你想要 “完全不重绘”,就一定会有延迟。 这个指标,正是试图在这两者之间,找到一个更合理的平衡点。 ———————————————————— 【背离为什么一定会有延迟?】 背离,本质上是在比较两个高点或两个低点之间的关系。 但问题在于:一个高点或低点,只有在行情出现反向回调之后,才能被确认是真正成立的。 在回调发生之前,任何所谓的 “高点 / 低点”,都只是暂时的价格位置,而不是一个已经确认的极值。 因此,传统背离算法通常采用的逻辑是:先等待价格走出一段回调,再回头确认前面的高点或低点,最后才判断是否构成背离。这一步 “等待确认”的过程,就必然带来了时间上的延迟。 ———————————————————— 【那重绘又是怎么来的?】 重绘,通常出现在追求 “提
FREE

For those who struggle with overbloated Volume Profile/Market Profile indicators, here is a solution that contains only the Point of Control (POC) information. Super-fast and reliable, the Mini POC indicator presents this vital information visually within your chart. Totally customizable in splittable timeframes, type of Volume, calculation method, and how many days back you need.
SETTINGS Timeframe to split the POCs within the day. Volume type to use: Ticks or Real Volume. Calculation method .
FREE
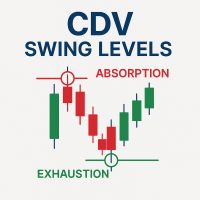
Cumulative Delta Volume (CDV) Swing Level - Absorption & Exhaustion Detector
Full Documentation: [ Download PDF ] CDV Swing Aggressive Score Guide : [ Download PDF ] Free Professional Education Course: After purchasing, contact me to receive access to the complete CDV Professional Training Video Course.
Professional CDV Analysis for Market Reversals This indicator identifies CDV absorption and exhaustion patterns to detect precise market turning points. It analyzes cumulative delta vo

Pips Hunter PRO 历经数年开发,是其前身的改进版。这个功能强大的指标分析市场和价格历史,生成买入和卖出条目。在计算这些条目时,它使用了不同的协同工作指标以及复杂的统计对数,可过滤并消除不利条目/ MT4 版本 。
功能特点 无重绘
当新数据到来时,该指标不会改变其数值
无滞后 该指标无滞后 交易货币对
所有外汇货币对 (最好是 EURGBP)
时间框架
所有时间框架
参数 ===== 显示 =====
箭头距离 // 信号(箭头)与蜡烛图之间的距离
===== 警报 =====
弹出式警报 // MT4 终端警报
推送通知警报 // 用于手机的警报
电子邮件警报 // 电子邮件警报
===== 图表设置 =====
更改图表上烛台颜色的选项
警告 我只在 MQL5.com 上销售我的产品。如果有人联系您向您推销我的产品,那么他们就是骗子,只想要您的钱。
此外,如果您从外部网站购买我的产品,我向您保证,这些产品都是假冒版本,与正版产品效果不同。
FREE

If you like this free tool, check out my EA which is currently on a Launch Sale for only $39 ! https://www.mql5.com/zh/market/product/159451?source=Site 簡短介紹: 這是一套專為黃金(XAUUSD) 交易設計的技術分析指標。它能自動識別市場波段,標記0.382 與0.618 斐波那契回調位,並在檢測到潛在的價格反轉形態(如W底/M頭)時發送通知。 【主要功能】 雙重監測模式: 同時追蹤0.382(淺層回調)與0.618(深層回調)水平位。 自動波段識別: 基於Lookback 區間自動計算高低點,無需手動繪製。 價格行為過濾: 結合Price Action 邏輯,僅在價格觸及關鍵位並出現特定形態時觸發提示,以過濾市場雜訊。 即時運算邏輯: 即使在休市期間加載,也能立即顯示歷史計算結果,以便於復盤分析。 多端警報通知: 支援MetaTrader 5 桌面彈窗、聲音警報及手機App 推播通知。 ️ 核心技術特點 1. 動態斐波那契水平
FREE

YOU CAN NOW DOWNLOAD FREE VERSIONS OF OUR PAID INDICATORS . IT'S OUR WAY OF GIVING BACK TO THE COMMUNITY ! >>> GO HERE TO DOWNLOAD
This system is an Heiken Ashi system based on RSI calculations . The system is a free open source script originally published on TradingView by JayRogers . We have taken the liberty of converting the pine script to Mq4 indicator . We have also added a new feature which enables to filter signals and reduces noise on the arrow signals.
Background
HEIKEN ASHI
Th
FREE

简体中文(Chinese – Simplified)
欢迎使用 EPo-CreW Forex Super ORB-H4 指标!
本指南将教您如何使用这一强大的工具,根据市场第一个 4 小时开盘区间来识别高概率交易机会。无论您是初学者还是经验丰富的交易者,该系统都将帮助您以更高的信心和一致性进行交易。
交易策略. 这是一个演示产品,将在安装之日起 30 天后到期。 完整版在此: https://www.mql5.com/en/market/product/160926?source=Site OR https://t.me/Fundamental_fx 交易:所有货币、黄金和BTCUSD 注意:确保切换到 M5 时间框架。这是使用此指标的最佳时间框架
策略 1:突破与回调(主要策略)
SELL(卖出)设置:
价格向上突破蓝线(高点突破)
出现金色 BREAKOUT(突破)箭头
等待价格收盘回到蓝线下方
出现红色 SELL 箭头(回调入场)
在指示的入场价位卖出(SELL)
止损(SL) 设置在红点处(区间高点上方)
止盈(TP) 设置在蓝点处(TP1、TP2、TP3)
BUY(买入)设
FREE
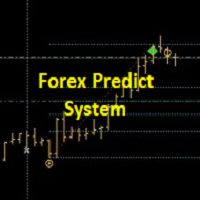
+++++++++++++++++++++++++++++++++++++++++++++++++++++++++++++++++++++++++++++++++++++++++++++++++ +++ Link to EURUSD Only Free Version --> https://www.mql5.com/en/market/product/156904?source=Unknown +++++++++++++++++++++++++++++++++++++++++++++++++++++++++++++++++++++++++++++++++++++++++++++++++ Hallo Trader, This is a traditional GANN & FIBONACCI strategy based on detection of an impulsive move in the opposite direction. This is called a Breakout. At the moment of Breakout, the indicator draw

SmartScalp M1 – Fast Scalping with Accurate Trends and Clean Signals SmartScalp M1 is a high-speed scalping indicator optimized specifically for the M1 timeframe. It combines Supertrend and Heiken Ashi to identify clear trend reversals and effectively filter market noise. BUY and SELL signals are generated when the Supertrend flips and are confirmed by Heiken Ashi candle colors, significantly reducing false signals in choppy market conditions. The indicator performs best on high-volatility ins

non-repaint free MT5 technical indicator works on all timeframes 1 minute to the monthly timeframe the trade vision buy and sell arrow is a multi currency and synthetic indicator Trade vision buy and sell arrow comes with Push Alerts purple arrow look for selling opportunities white arrow look for buying opportunities. wait for candle to close and arrow to appear before taking any trades.
FREE

趋势线图指标是趋势筛选器指标的插件。它用作趋势筛选器(趋势线信号)生成的所有信号的扫描仪。
它是基于趋势筛选器指标的趋势线扫描仪。如果您没有 Trend Screener Pro Indicator,Trend Line Map Pro 将无法使用。 It's a Trend Line Scanner based on Trend Screener Indicator. If you don't have Trend Screener Pro Indicator, the Trend Line Map Pro will not work .
通过访问我们的 MQL5 博客,您可以下载趋势线图指标的免费版本。购买前试用,不受 Metatrader Tester 限制。 : 点击这里
1. 容易获得的优势 根据货币和时间范围显示买入和卖出信号。 评估自图表中出现箭头以来价格上涨或下跌的点数。 (趋势筛选指标箭头) 显示信号的时序。 获取多时间范围和多货币警报以购买和出售警报。
2. 如何使用趋势线图 如何显示买卖信号仪表板?
如果您有任何问题或需要帮助,请通过私

Haven Bands Reversion – 专业均值回归交易指标 隆重推出 Haven Bands Reversion – 一款功能强大且精准的工具,专为使用均值回归策略的交易者设计。与传统的布林带不同,该指标基于 成交量加权移动平均线 (VWMA) ,这使其通道对真实的市场活动更加敏感。最重要的是,该指标生成 不重绘的信号 ,为您提供可靠的入场点。 我的其他产品在这里 -> 这里 . 理解价格何时过度偏离其“公允”价值,是成功进行反转和回调交易的关键。Haven Bands Reversion 会自动识别这些时刻,并在价格返回动态波动通道内时发出明确信号。 为什么 VWMA 优于标准 SMA? 与同等对待所有蜡烛线的简单移动平均线 (SMA) 不同, VWMA 对高成交量的蜡烛线赋予更大权重 。这意味着该指标能更快地响应由“聪明钱”支持的走势,并忽略低成交量下的价格噪音。因此,中线及其构建的通道能更准确地反映市场的真实力量平衡。 Haven Bands Reversion 的主要优势: 基于 VWMA 的动态通道: 通过更精确和自适应的波动性检测获得优势。 可靠的回归信号(不重

Lion Arrow Super Arrow Indicator for MetaTrader 5
The Lion Arrow Super Arrow Indicator for MetaTrader 5 is a hybrid trading system that integrates multiple advanced technical analysis tools to generate high-quality trading signals. By combining trend, momentum, and pressure-based indicators, it aims to reduce false signals and improve entry accuracy. Core Components of the Indicator The Lion Arrow Super Arrow indicator is built on several key analytical elements: Fast Moving Average: Reacts qui
FREE
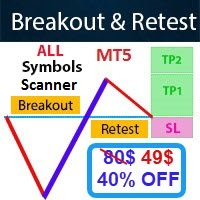
- Real price is 80$ - 40% Discount (It is 49$ now) Contact me for instruction, any questions! - Non-repaint - I just sell my products in Elif Kaya Profile, any other websites are stolen old versions, So no any new updates or support. - Lifetime update free Related product: Bitcoin Expert Introduction The Breakout and Retest strategy is traded support and resistance levels. it involves price breaking through a previous level. The break and retest strategy is designed to help traders do two main

趋势型BB MACD指标与ADX过滤器 趋势型BB MACD指标与ADX过滤器 是一款结合了 布林带 (BB) 、 MACD 和 平均趋向指数 (ADX) 的高级技术工具。该指标现在整合了完整的方向分析系统,包括 +DI 和 -DI ,以及 MACD 交叉确认选项。它旨在提供经过优化的精确过滤交易信号,适用于 超短线交易 (scalping) 、 日内交易 (intraday) 和 波段交易 (swing trading) ,帮助交易者不仅识别趋势方向,还能判断其强度和可靠性。 核心组成部分 布林带 (BB) BB Middle (中轨): 简单移动平均线 (SMA)。 BB Upper / BB Lower (上轨/下轨): SMA ± (标准差 × 乘数)。 完全自定义: 可调整颜色、粗细和线条样式。 混合信号 (Hybrid Signal) 将 MACD 线 (非柱状图) 与 BB 中轨结合,通过调整其数值来生成动态信号。 智能颜色系统: 绿色: ADX 和 +DI 确认看涨动量。 红色: ADX 和 -DI 确认看跌动量。 黄色: 趋势疲弱或指标之间存在冲突。 高级 ADX 过
FREE

Ritz Smart Detection BUY & SELL
The Ritz Smart Detection BUY & SELL is a next-generation trading indicator engineered to detect high-probability entry signals by combining ATR-based volatility measurement , trend reversal detection , and smart alerting technology . It delivers real-time BUY/SELL opportunities with adaptive targets and risk levels, making it a versatile tool for both scalpers and swing traders. Core Market Logic ATR-Driven Volatility Analysis Uses multiple ATR methods (SMA, EMA,
FREE

The Volume Profile Fixed Range indicator is a powerful tool designed for MetaTrader 5 (MT5) platforms. It visualizes the distribution of trading volume over a fixed historical range of bars, helping traders identify key price levels where significant volume has accumulated. This aids in spotting support/resistance zones, value areas, and potential reversal or breakout points. Below is a detailed description of its features:
Key Features: - Fixed Range Analysis: Analyzes volume profile based on
FREE

Introduction
Reversal Candles is a cutting-edge non-repainting forex indicator designed to predict price reversals with remarkable accuracy through a sophisticated combination of signals.
Signal Buy when the last closed candle has a darker color (customizable) and an up arrow is painted below it Sell when the last closed candle has a darker color (customizable) and a down arrow is painted above it
FREE

VWAP, or volume-weighted average price, helps traders and investors observe the average price that major traders consider the "fair price" for that move. VWAP is used by many institutions to set up large operations.
In this indicator, you can enjoy the following features:
Daily VWAP, with option to display your current price next to the chart VWAP Weekly, with option to display your current price next to the chart Monthly VWAP, with option to display your current price next to the chart
FREE

RiskKILLER_AI Navigator 是一款基于人工智能的多时间框架市场方向与策略助手。 交易表现的关键在于像专业人士一样理解市场。这正是 RiskKILLER_AI Navigator 所提供的: 通过 AI 驱动的趋势、情绪和宏观分析( 独立于 MQL5 ),获得机构级别的洞察,并适应您的交易风格。 购买后,如需获取用户手册,请:1. 发布一条 评论 索要 2. 给我发送 私信 。 [ 专属群组 | MT5 版本 - MT4 版本 ]
核心优势 跨多个时间框架和资产的实时市场方向 AI 驱动的宏观指标、新闻和情绪分析 根据您的交易风格(手动或自动)提供定制建议 与 RiskKILLER_AI 专家顾问 (EA) 直接协同工作
主要特性 AI 驱动的全球趋势仪表板 - 即时查看 M1 到 D1 时间框架下主要外汇货币对和 BTCUSD 的市场偏向(盘整、看涨、看跌)。 策略感知型 AI 助手 - RiskKILLER_AI Navigator 适应您的策略并突出机会: 马丁格尔 / 网格 / 均价定投 (DCA) - 提示风险和波动性陷阱 均值回归 - 识别有利的盘整条

许多盈利交易者不仅知道如何识别市场趋势,而且也能把握趋势建立后的交易机会。 Pz 趋势交易 指标设计用来在趋势行情中尽可能的赚取利润。 已建立的趋势提供了一揽子交易机会,但大多数趋势交易指标完全忽视了它们,让交易者在趋势行情时完全不知道该如何做!一般趋势指标只通知有关的趋势变化,但根本不足以得到卓越的回报. Pz 趋势交易 指标比一般趋势指标显示多达 20 倍的交易 , 因为它注重所谓的市场时机。它不仅显示当前的市场趋势,也有回调,内柱线的突破和调整。它令您在趋势回调之后介入,安全的柱线内突破金字塔加仓,以及发现潜在的反转,和已知的调整。
趋势改变 一个趋势改变在市场方向变化时发生。趋势变化在图表上用带数字的彩色圆圈显示。蓝色 (1) 信号为上涨开始, 而红色 (1) 信号为下跌开始。趋势变化并非评估当前价格动作的结果, 它意味着交易设置是不定时地。如果您正确使用本指标, 在趋势变化时, 您将将已经入场 (参看下面的调整)。
回调 但凡趋势在运动中,行情上下抖动,盈利者收割利润,且其它参与者入场。趋势回调代表好的买入机会,通常是由主力获利离场导致。如果行情在回调后回归上行, 指标将

A top-quality implementation of the famous Super Trend indicator, which needs no introduction. It is completely loyal to the original algorithm, and implements many other useful features such as a multi-timeframe dashboard. [ Installation Guide | Update Guide | Troubleshooting | FAQ | All Products ] Easy to trade It implements alerts of all kinds It implements a multi-timeframe dashboard It is non-repainting and non-backpainting Input Parameters
ATR Period - This is the average true range peri
FREE

This indicator automatically identifies market structure and plots Fibonacci retracement levels in real time.
It detects key swing highs and lows to mark structural points such as higher highs, higher lows, lower highs, and lower lows, helping traders quickly understand trend direction and structural shifts.
Based on the detected structure, the indicator dynamically draws Fibonacci levels, allowing traders to easily spot potential retracement, pullback, and entry zones without manual drawing.

Discover the power of harmony in the markets with this advanced harmonic pattern indicator. Designed for demanding technical traders, this indicator automatically detects 11 of the most popular harmonic patterns, including the Gartley, Bat, Crab, Butterfly, Shark, Cypher, and many more.
Thanks to its dynamic dashboard, you can easily manage the visibility of patterns on the chart, activating or deactivating the ones you want in real time without overloading your platform. This flexibility allo
FREE

Volumes with Moving Average (带移动平均线的成交量)是一个简单明了的成交量指标,并辅以移动平均线。
如何使用?
它非常适合在从支撑/阻力位以及趋势通道的波动突破口进入交易时过滤信号。它也可以作为通过成交量平仓的信号。
输入参数:
Volumes - 真实或刻度线成交量。 MA_period - 移动平均周期。
Volumes with Moving Average(带移动平均线的成交量)是一个简单明了的成交量指标,并辅以移动平均线。
如何使用?
它非常适合在从支撑/阻力位以及趋势通道的波动突破口进入交易时过滤信号。它也可以作为通过成交量平仓的信号。
输入参数:
Volumes - 真实或刻度线成交量。 MA_period - 移动平均周期。
FREE

欢迎使用高级加特利模式识别指标 该指标根据价格结构的 HH 和 LL 以及斐波那契水平检测加特利模式,当满足某些斐波那契水平时,指标将在图表上显示该模式。 MT4 版本 : WH Advanced Gartley Pattern MT4 **该指标是 组合 Ultimate Harmonic Patterns MT5 的一部分,其中包括所有模式识别。**
特征 : 用于 高精度 检测伽利形态的先进算法。 非常 快 且资源 少 (对机器的要求较低)。 没有 延迟 ,也没有 重画 。 自定义 斐波那契水平 调整(您可以根据您的首选设置更改斐波那契水平)。 同时显示 看跌 和 看涨 模式(能够显示看跌或看涨设置的多种模式)。 显示 交易 水平线(具有可调整止损以及目标 1 和目标 2)。 适用于任何 交易品种 和任何 时间范围 。 未来还会有更多 功能 !
参数:
MaxBars - 选择要回顾的最大条数。 XlegBarDepth - 调整 HH 和 LL 深度。 ShowBearish - 显示看跌加特利形态(True、False)。 ShowBullish
FREE
一个智能助手,准确和及时的市场进入. 当价格达到水平时,指示器发出蜂鸣声和警报. 您可以手动设置支撑和阻力水平或将其委托给算法。 在价格达到水平的那一刻,蜡烛图案被额外标记。 独特的蜡烛模式是经典模式和模式的崩溃和反弹水平的共生。 对于证券交易所的高利润交易,在大多数情况下,下订单是不够的,交易者需要亲自查看和分析价格在接近重要水平时的表现。 我认为所有交易者都遇到过这样一种情况:我们在交易日开始时设定了重要目标,然后错过了价格达到它们的那一刻。 结果,入场的那一刻被错过了,我们得到了额外的负面情绪,看着价格完全按照我们的计划移动。 但你不在那里,也没有利润。 交易愉快和舒适! 不要再连续几天盯着显示器看了。 确定对你来说很重要的级别,然后去做你的生意,其他的工作,或者只是放松一下。 当价格达到设定水平时,您将收到通知,并可以立即开始交易。 有了这个指标,你将不再错过进入市场的最佳时机。 今天开始使用警报级别,看看它如何简化交易过程并提高其效率。 您可以下载指标的试用版。 在试用版中,您只能设置一个警报级别。 否则,功能没有什么不同。 下载MetaTrader5的指标: https:/
FREE

Price Volume Distribution
分析价格水平交易量分布的成交量分布指标。显示POC、价值区域、成交量突破和基于区域的MT5信号过滤。
概述
Price Volume Distribution是MetaTrader 5的成交量分析指标。使用M1时间框架数据计算并显示各价格水平的成交量分布,通过直方图柱和参考线提供可视化展示。 系统使用指南 | 其他语言使用指南 核心功能
该指标识别: - 控制点(POC):交易量最高的价格水平 - 价值区域高/低点(VAH/VAL):包含70%成交量的价格范围 - 成交量突破:异常高活跃度的价格水平 - 基于成交量集中度的支撑和阻力区域
分析模式
提供三种计算模式:
1. 交易时段模式:在日线(D1)柱边界内分析成交量 2. 固定范围模式:在用户指定的起止时间之间计算成交量 3. 可见范围模式:根据图表可见区域动态更新
时段模板
预配置的常用交易时段时间范围: - D1:全天分析(00:00-23:59 GMT) - 伦敦时段:08:00-16:30 GMT - 纽约时段:13:30-22:00 GMT -

Gold Venamax - 這是最好的股票技術指標。 此指標演算法分析資產的價格變動並反映波動性和潛在的進入區域。
指標特點: 這是一個帶有 Magic 和兩個趨勢箭頭塊的超級指標,可實現舒適且有利可圖的交易。 圖表上顯示用於切換方塊的紅色按鈕。 Magic 在指標設定中進行設置,以便您可以將指標安裝在顯示不同區塊的兩個圖表上。 Gold Venamax 可以放置在具有不同箭頭緩衝區(GV 和 SD)的兩個圖表上。 為此,您需要在設定中選擇不同的 Magic,例如,一個具有 Magic = 999,另一個具有 Magic = 666。接下來,您可以使用圖表上的紅色按鈕選擇箭頭緩衝區。 指標設定中的每個箭頭緩衝區(GV и SD)都有一個單獨的箭頭過濾器,以實現舒適且有利可圖的交易(UseFiltrGV = true; 和 UseFiltrSD = true;)。 進入的最佳訊號 = 遵循兩個緩衝區的訊號箭頭(GV 和 SD)+ 所有三個 MA 線(紅色或藍色)的方向 + TMA 通道邊界(下或上)。 TMA 通道邊界(下限或上限)也可用於鎖定利潤和/或以較短的停損位進行逆勢風險交

HiperCube AutoTrend 线 Darwinex Zero 20% 折扣码: DWZ2328770MGM_20 该指标可帮助您轻松识别支撑位和阻力位,在图表中绘制线条并了解市场中的重要点。 此工具是半自动化交易的最佳方式,可为您完成部分工作。 阻力位或支撑位是重要的水平,有时很难识别,但现在不会给您带来更多困惑
HiperCube Autotrends 适用于任何时间范围 所有类型的策略,剥头皮、波动、日内... 所有市场,外汇、商品、指数、加密货币...您可以在 XAU、EURUSD、BTC、US30 或您想要的地方使用它 Chatgpt 和 AI 被用于开发它 帐户: 在真实或演示中使用它,无论您希望在哪里。 任何类型的账户都是有效的净额结算或对冲
特点 易于使用 提供有用的选项 自定义您的阻力线和支撑线
建议 将其与其他指标和分析相结合,这只是确认良好市场模式的基本工具
FREE
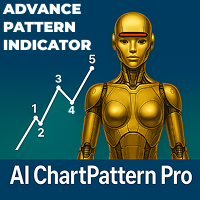
AI ChartPattern Pro AI ChartPattern Pro 是一款高精度指标,旨在帮助交易者客观识别高级图表形态,避免主观偏差和人为干预。版本 1.0 包含两种强大的图形模式: 沃尔夫波浪 和 头肩形态 。 这个指标不仅显示图形模式,还提供可执行的交易信号: 入场价格 止损(SL) 第一目标位(TP1) 第二目标位(TP2) 所有功能都经过简化,用户几乎无需配置。无需处理大量设置,该工具即装即用,让您专注于交易本身。 主要功能 自动识别沃尔夫波浪与头肩形态 清晰显示入场点、止损和目标位(TP1 和 TP2) 客观识别图形(无主观判断,无人为干预) 用户配置最小化,即插即用 早期用户价格,后续添加更多高级图形后价格将会上涨 后续计划 未来版本将根据用户反馈与市场需求增加更多高级图表形态。每增加一种新图形,工具功能将更强大,价格也会随之上涨。 沃尔夫波浪(Wolfe Wave) 沃尔夫波浪是一种由五个波段组成的自然价格形态,反映了市场中的供需关系。它常用于预测价格反转和未来目标位的位置。特别是在第 5 浪形成时,该形态对未来价格的预测精度较高。 参数设置 1. 是否显示
FREE

Introducing the MACD Enhanced – an advanced MACD (Moving Average Convergence Divergence) indicator that provides traders with extended capabilities for trend and momentum analysis in financial markets. The indicator uses the difference between the fast and slow exponential moving averages to determine momentum, direction, and strength of the trend, creating clear visual signals for potential entry and exit points. Attention! To achieve the best results, it is recommended to adapt the indicator
FREE

This indicator plots the volume profile by Price on the chart
There are 5 ways to view it:
By Total Volume Traded (Premium Version); Volume Ticks(Forex) Separated by Buyers and Sellers (Premium Version); Buyers Only (Premium Version); Sellers Only (Premium Version); Business balance (Buyers - Sellers) (Premium Version); .
It is possible to select how many days the profiles will be calculated.( Premium Version)
On the current day it recalculates the histogram data for each new candlestick.
FREE

Order Flow Lite is a technical analysis utility designed to visualize synthetic Order Flow, Footprint Charts, and Tick Analysis using standard broker data. It assists traders in analyzing Delta logic and Volume Profiling based on recent price action. Key Features: Synthetic Footprint: Visualizes volume data for the most recent 3 closed candles, offering a clear view of immediate market sentiment. Tick Delta: Displays basic Buy/Sell delta visualization to identify potential reversals. Volume Pro
FREE

Desenvolvido por smart2trader.com Smart Super Trend é um indicador avançado de identificação de tendências, desenvolvido para detectar com alta precisão movimentos de alta e baixa do mercado . O indicador Super Trend da Smart utiliza algoritmos adaptativos combinados com filtros de volatilidade , proporcionando sinais mais limpos e alinhados à dinâmica real do preço. Conta ainda com um sistema inteligente de monitoramento que notifica, em tempo real, sempre que ocorre uma mudança de tendência ,
FREE

Daily VWAP Indicator (Volume Weighted Average Price) Special Deal! Leave a review and get the indicator Long & Short Cointegration Analyzer for free — just send me a message!
Description The Daily VWAP (Volume Weighted Average Price) indicator is an essential tool for traders seeking to identify the true average price of an asset throughout the day, adjusted by traded volume. Primarily used by institutional and professional traders, the daily VWAP serves as a reference point to identify the av
FREE

TickFlow 是一个用于分析 tick 数据并在图表上可视化重要区域的工具。该工具会聚合当前与历史的 tick 数据,显示买卖双方的力量对比,并帮助识别支撑/阻力位和簇状(cluster)区域。 这是适用于 MetaTrader 4 的版本。 工作原理(简要) TickFlow 收集 tick 数据,并按价格步长和蜡烛(柱)对其进行聚合。
基于累计的数据构建可视化层:向上/向下 tick 计数器(up/down tick counters)、买/卖比例(buy/sell ratio)、历史支撑/阻力位与簇(clusters)。
用户可在设置中调整灵敏度与分析周期。该工具不代替交易者决策——仅提供用于分析的数据。 特性 每根蜡烛的 tick 活动显示(tick counters)。 买/卖双方的百分比比率。 基于 tick 成交量构建的历史支撑与阻力位。 价格区域的簇分析(cluster analysis)。 针对不同交易周期(剥头皮、日内、中期)的灵敏度可调。 可开启/关闭 tick 历史显示以减少图表干扰。 数据本地保存;不依赖外部 DLL,也不向外部服务发送数据。 优化呈
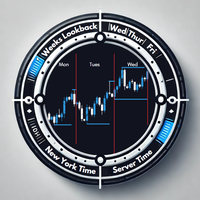
Overview The Daily Session Separator indicator is a powerful tool designed to enhance your trading experience by clearly marking daily trading sessions on your chart. It helps traders visualize daily boundaries, session highs and lows, and essential day-specific data to make informed decisions. With its seamless integration into any chart and dynamic adaptability, this indicator is a must-have for traders who rely on precision and clarity. Key Features Daily Session Separators Automatically adds
FREE

Technical Analysis Dashboard Pro (TADashboard Pro) – 统一技术分析系统 TADashboard Pro 是一个先进的技术分析面板,将多个指标和时间周期整合到一个统一的视觉界面中。该系统专为追求 精确性与高效率 的交易者设计,能同时分析 7 个震荡指标和 4 个移动平均线 ,涵盖 8 个不同时间周期 ,生成标准化评分,从而简化决策过程。 主要特点 (Key Features): 多时间周期分析 (Multi-Timeframe Analysis): 通过集成的可视化选择器,轻松监控 M1、M5、M15、M30、H1、H4、D1 和 W1 周期。 高级评分系统 (Advanced Scoring System): 震荡指标、移动平均线和综合评估的独立评分( $-100$ 至 $+100$ )。 包含的指标 (Included Indicators): RSI、MACD、Stochastic、CCI、ADX、Williams %R、Momentum、EMA 10/20/50、SMA 200。 分析表格 (Analysis Tables):
FREE

Engulfing Zone Sniper MT5 — Multi-Timeframe Signal & Zone Indicator The Engulfing Zone Sniper MT5 is a technical analysis tool designed to highlight engulfing candlestick patterns in combination with adaptive support/resistance zones. It provides visual markers and optional alerts to assist traders in identifying market structure reactions across multiple timeframes. Key Features Multi-Timeframe Detection – Option to scan higher timeframe engulfing setups with lower timeframe confirmation. Su

【你看到的“即时 RSI 背离”,大多数都是错的】 如果你用过 RSI 背离指标,大概率遇到过这种情况:
当下看着是背离,几根 K 线之后却消失了,
回头一看,历史图形被改得面目全非。 这不是你用错了方法,
而是“不确认高低点的背离”,本身就站不住逻辑。 如果你在找一个不会事后推翻自己的 RSI 背离指标,
请继续往下看。 ———————————————————— 【指标功能简介】 这是一个 RSI 背离识别指标,用于自动标出价格与 RSI 之间的顶背离与底背离。 主要特性包括: 自动识别 RSI 背离结构
在 RSI 指标窗口中清晰标出背离段
不重绘、不回撤历史信号
适合与 MACD、趋势线、均线等工具配合使用
更适合用于结构确认,而非抢最低或最高点 ———————————————————— 【为什么背离信号会延迟 5 根 K 线显示】 这是本指标最重要、也最容易被误解的一点,请务必理解。 所有“真实有效”的背离判断,都必须先确认一个已经成立的高点或低点。 而确认高点或低点,必然需要一个前提条件:
行情已经发生了反向回调。 在没有回调之前,任何所谓的“高点”或“低点”,都只是暂时的猜
FREE

Ekom Spike Detector Pro
Take your trading to the next level with the Ekom Boom and Crash Spike Detector Indicator Pro, designed for serious traders who demand more. This advanced version provides: Key Features: Accurate Spike Detection: Identify high-probability spike patterns in real-time using price action Clear Visual Signals: Displays clear buy and sell arrows on the chart for easy decision-making Alert options : MT5 Alert/Notification to receive alerts on your mobile when signal

该指标是一款用于 MetaTrader 4 和 5 的交互式艾略特波浪标注工具。
它允许用户通过图表上的菜单选择标注大小、颜色和波浪类型(ABC 修正浪、五浪推动浪或 WXY 结构),并直接在图表上手动放置波浪标注。
只需在图表上单击一次,指标就会在所选的价格和时间位置依次放置相应的波浪标注,帮助交易者直观地绘制和整理艾略特波浪结构。 如果您喜欢,请为它评分! 该指标是一款用于 MetaTrader 4 和 5 的交互式艾略特波浪标注工具。
它允许用户通过图表上的菜单选择标注大小、颜色和波浪类型(ABC 修正浪、五浪推动浪或 WXY 结构),并直接在图表上手动放置波浪标注。
只需在图表上单击一次,指标就会在所选的价格和时间位置依次放置相应的波浪标注,帮助交易者直观地绘制和整理艾略特波浪结构。 如果您喜欢,请为它评分!
FREE

The Advanced Trend Scalper MT5 indicator is designed to help both novices and professional traders. The indicator analyses the market and gives you buy and sell signals. It does not use any other indicators, it works only with the market actions. The signal appears right after the candle close and it does not repaint. The efficient algorithm provides a high degree of reliability of such signals. Advanced Trend Scalpe r for the MetaTrader 4 terminal : https://www.mql5.com/en/market/product/
学习如何在MetaTrader AppStore上购买EA交易,MetaTrader平台的应用程序商店。
MQL5.community支付系统支持通过PayPay、银行卡和热门付款系统进行交易。为更好的客户体验我们强烈建议您在购买前测试EA交易。
您错过了交易机会:
- 免费交易应用程序
- 8,000+信号可供复制
- 探索金融市场的经济新闻
注册
登录