YouTubeにあるマーケットチュートリアルビデオをご覧ください
ロボットや指標を購入する
仮想ホスティングで
EAを実行
EAを実行
ロボットや指標を購入前にテストする
マーケットで収入を得る
販売のためにプロダクトをプレゼンテーションする方法
MetaTrader 5のためのテクニカル指標 - 6

Overview The Smart Money Structure Markup Indicator for MetaTrader 5 is a powerful tool designed to help traders identify key market structures based on popular Smart Money Concepts (SMC) strategies. This indicator detects micro-market structures, providing insights into price movements and potential trend changes. It highlights important elements such as valid Break of Structure (BOS), Change of Character (CHoCH), and Inducement (IDM), helping traders to make informed decisions. Key Features Ma
FREE

このプロジェクトが好きなら、5つ星レビューを残してください。 このインジケータは、指定されたためのオープン、ハイ、ロー、クローズ価格を描画します
特定のタイムゾーンの期間と調整が可能です。 これらは、多くの機関や専門家によって見られた重要なレベルです
トレーダーは、彼らがより多くのかもしれない場所を知るために有用であり、
アクティブ。 利用可能な期間は次のとおりです。 前の日。 前週。 前の月。 前の四半期。 前年。 または: 現在の日。 現在の週。 現在の月。 現在の四半期。 現年。
FREE

価格波形パターン MT5へようこそ --(ABCD パターン)-- ABCD パターンは、テクニカル分析の世界で強力で広く使用されている取引パターンです。
これは、トレーダーが市場での潜在的な売買機会を特定するために使用する調和的な価格パターンです。
ABCD パターンを使用すると、トレーダーは潜在的な価格変動を予測し、いつ取引を開始および終了するかについて十分な情報に基づいた決定を下すことができます。 EA バージョン: Price Wave EA MT5
MT4バージョン: Price Wave Pattern MT4
特徴 :
ABCDパターンの自動検出。
強気パターンと弱気パターン。
任意のシンボルと任意の時間枠で機能します。 主要なレベルと価格目標。
カスタマイズ可能な設定と繊維レベルの調整。 アラートと通知。 今後 さらに多くの 機能が追加される 予定です 。
FREE
Candle Timer Countdown v2.5 is an advanced MQL5 indicator designed to enhance your trading precision. It provides a live countdown for each candle while simultaneously analyzing multiple timeframes to detect trend direction and potential early reversals. Key features include: Candle Countdown & Progress Bar: Monitor the exact time remaining for each candle with a clear progress visualization. Advanced Trend Detection: Analyze both fast and slow trends with configurable sensitivity and multi-time
FREE
HTF Power of Three (ICT) - MT5 Indicator Overview The HTF Power of Three indicator is a professional implementation of the Inner Circle Trader's (ICT) Power of Three concept, inspired by Larry Williams. This indicator visualizes higher timeframe (HTF) candle development in real-time on any lower timeframe chart, making it an essential tool for ICT traders who study institutional price movement patterns. What is Power of Three (PO3)? Power of Three represents a three-staged Smart Money campaign

Trend Hunter は、外国為替、仮想通貨、CFD 市場におけるトレンド指標です。 このインジケーターの特別な特徴は、価格がトレンドラインをわずかに突き抜けたときにシグナルを変更することなく、自信を持ってトレンドに従うことです。 インジケーターは再描画されず、バーが閉じた後に市場に参入するシグナルが表示されます。
トレンドに沿って移動すると、インジケーターにはトレンドの方向に追加のエントリーポイントが表示されます。 これらのシグナルに基づいて、小さなストップロスで取引できます。
トレンドハンターは正直な指標です。 インジケーター信号の上にマウスを置くと、信号の潜在的な利益と可能なストップが表示されます。
新しい信号が表示されると、次の通知を受け取ることができます。 アラート プッシュ通知 メールによる通知 電報での通知 チャートのスクリーンショットも Telegram に送信されるため、取引を決定するために端末を開く必要はありません。
インジケーターシグナルは、電報チャネル https://www.mql5.com/ja/market/product/11085#!ta

This indicator has been developed to identify and display these trends quickly and easily, allowing you to see instantly, those currency pairs which are trending, and those which are not – and in all timeframes, with just one click. The 28 currency pairs are displayed as a fan as they sweep from strong to weak and back again, and this is why we call it the ‘currency array’. All 28 pairs are arrayed before you, giving an instant visual description of those pairs that are trending strongly, those

ZenTrend — Adaptive Trend Indicator for MetaTrader 5 ZenTrend is an innovative trend indicator for MetaTrader 5 that plots a flexible and informative trend line on the chart, based on adaptive moving average calculations. This tool is ideal for traders seeking precise and timely identification of trend direction on any financial market: forex, stocks, indices, cryptocurrencies, and commodities. Key Features of ZenTrend 1. Four Types of Moving Averages Supported
ZenTrend allows you to choose fro

Ultimate SMC: Professional Smart Money Concepts Indicator Unlock the hidden movements of the market. Trade with the institutions, not against them. The Ultimate SMC indicator is designed for serious traders who want to apply Smart Money Concepts (SMC) to their charts automatically. Manual SMC analysis is time-consuming and prone to subjective error. This tool removes the guesswork by algorithmically detecting Order Blocks, Fair Value Gaps, and Structural breaks in real-time. Whether you are a s
FREE

** All Symbols x All Timeframes scan just by pressing scanner button ** Discount: The price is $50$, But now it is just $39, Limited time offer is active.
*** Contact me to send you instruction and add you in "Trend Reversal group" for sharing or seeing experiences with other users. Introduction: Trendlines are the most famous technical analysis in trading . Trendlines continually form on the charts of markets across all the different timeframes providing huge opportunities for traders

non-repaint free MT5 technical indicator works on all timeframes 1 minute to the monthly timeframe the trade vision buy and sell arrow is a multi currency and synthetic indicator Trade vision buy and sell arrow comes with Push Alerts purple arrow look for selling opportunities white arrow look for buying opportunities. wait for candle to close and arrow to appear before taking any trades.
FREE

このオールインワントレーディングインジケーターは、ブレイクアウトシグナル、高値・安値水準、トレーリングストップとアラートを単一の強力なツールに集約したものです。チャートに多数のインジケーターを重ねて圧倒された経験がある方でも、このツールは全てを簡素化し、市場で鋭い優位性を提供します。3つの必須要素をクリーンで直感的な表示に統合し、エントリー機会の発見、リスク管理、市場の全体の流れを即座に把握するのに役立ちます。ブレイクアウトを取引するトレンドフォロワー、特に古典的なタートルズ取引手法のようなスタイルの方に特にお勧めです。
この伝統的なトレンドフォロー手法では、勝率は約30〜40%、シャープレシオは控えめですが、真の利益は稀に発生する5〜10%の異常値トレードからもたらされます。全ては日足チャート上で展開され、5分、15分、30分、1時間、4時間といった短い時間軸の駆け引きを避けます。これにより管理が容易になり、ストレスなく複数のポジションを監視できます。ストップロスには、日次ATR(平均トゥルーレンジ)の2倍または3倍の水準を考慮してください。また、手動での注文作業が煩わしい場合は、
FREE

For those who struggle with overbloated Volume Profile/Market Profile indicators, here is a solution that contains only the Point of Control (POC) information. Super-fast and reliable, the Mini POC indicator presents this vital information visually within your chart. Totally customizable in splittable timeframes, type of Volume, calculation method, and how many days back you need.
SETTINGS Timeframe to split the POCs within the day. Volume type to use: Ticks or Real Volume. Calculation method .
FREE

Necessary for traders: tools and indicators Waves automatically calculate indicators, channel trend trading Perfect trend-wave automatic calculation channel calculation , MT4 Perfect trend-wave automatic calculation channel calculation , MT5 Local Trading copying Easy And Fast Copy , MT4 Easy And Fast Copy , MT5 Local Trading copying For DEMO Easy And Fast Copy , MT4 DEMO Easy And Fast Copy , MT5
DEMO
砖图 Renko PRO->>>
The display of the brick map on the main map.
The Renko chart ideally r
FREE

マルチタイムフレーム・トレンド分析ツール チャートを常に切り替えることなく、複数のタイムフレームでトレンドを追跡したいですか? Smart Trend Consensus MT5 は、 7つのタイムフレームを同時に (M1、M5、M15、M30、H1、H4、D1)データを統合するテクニカル分析ツールです。このインジケーターは 7つの技術的基準 を使用して各タイムフレームのトレンド状態を評価し、すべての情報をビジュアルダッシュボードに表示します。 トレーダーが市場監視の時間を節約するのに役立つ多次元分析ツールです。 User Guide | Other languages 主な機能 7タイムフレームのリアルタイム分析 単一のダッシュボードでM1からD1まで監視。複数のタイムフレームを比較するためにチャートを切り替えたり、手動で計算したりする必要はありません。 7基準評価システム 各タイムフレームは7つの技術的要因に基づいて分析されます: ADX方向性指数 (+DI対-DI) EMA50ポジション (価格対高速移動平均) EMA200アライメント (高速MA対低速MAの関係
概要
明確なシグナルとシンプルなルールで、市場の3つの主要フェーズを識別します。本インジケーターは、アジアセッションに基づく蓄積(アキュムレーション)フェーズをリアルタイムで検出し、操作(マニピュレーション)フェーズでの流動性スイープを特定し、分配(ディストリビューション)フェーズで方向性を確認します。上昇フェーズには緑の矢印、下降フェーズには赤の矢印を表示し、アジアボックスの色や枠線をカスタマイズ可能。さらに、日足の始値ラインをオプションで表示し、日中取引のコンテキストを即座に把握できます。 動作原理
蓄積フェーズでは、記録された高値と安値の間にボックスを描画します。操作フェーズでは、価格がボックスの範囲を設定したpips数以上ブレイクしたかを確認します。分配フェーズでは、ATRに基づく確認、または固定pipsの延長によってフェーズの変化を検証します。条件が満たされると、対応する矢印とフェーズラベルをチャート上に表示します。 3フェーズのトレードロジック
蓄積(Accumulation)– アジアセッションの時間を設定し、価格レンジを描く。
操作(Manipulation)–
FREE

The Volume Profile Fixed Range indicator is a powerful tool designed for MetaTrader 5 (MT5) platforms. It visualizes the distribution of trading volume over a fixed historical range of bars, helping traders identify key price levels where significant volume has accumulated. This aids in spotting support/resistance zones, value areas, and potential reversal or breakout points. Below is a detailed description of its features:
Key Features: - Fixed Range Analysis: Analyzes volume profile based on
FREE

This indicator provides the ability to recognize the SMC pattern, essentially a condensed version of the Wyckoff model. Once the pattern is confirmed by RTO, it represents a significant investment opportunity. There are numerous indicators related to SMC beyond the market, but this is the first indicator to leverage patterns to identify specific actions of BigBoy to navigate the market. The SMC (Smart Money Concept) pattern is a market analysis method used to understand the behavior of "smart
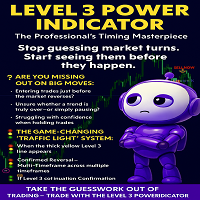
LEVEL 3 POWER INDICATOR
The Professional’s Timing Masterpiece
Stop guessing market turns. Start seeing them before they happen.
---
Are You Missing Out on Big Moves?
Entering trades just before the market reverses?
Unsure whether a trend is truly over—or simply pausing?
Struggling with confidence when holding trades?
You’re not alone. Most traders wrestle with these exact challenges… until they discover the Level 3 Power Indicator.
---
The Game-Changing “Traffic Light” Syst
FREE

Pips Hunter PRO は数年かけて開発され、前作の改良版です。この強力なインジケーターは、マーケットと価格の履歴を分析し、売買エントリーを生成します。これらのエントリーの計算には、複雑な統計的対数だけでなく、連動する様々なインジケーターを使用し、不利なエントリーをフィルタリングして排除します / MT4バージョン 。
特徴 リペイントなし
このインディケータは、新しいデータが到着してもその値を変更しません
ラグなし このインディケータはラグがありません 取引ペア
すべてのFXペア (できればEURGBP)
時間枠
すべての時間枠
パラメータ ===== 表示
矢印の距離 // シグナル(矢印)とローソク足の距離
===== アラート
ポップアップアラート // MT4ターミナル用のアラート
プッシュ通知 // 携帯電話向けアラート
メールアラート // メールアラート
===== チャート設定
チャート上のローソク足の色を変更するオプション。
警告 私はMQL5.comでのみ製品を販売しています。もし誰かが私の製品を売りたいと連絡
FREE

Dark Oscillator is an Indicator for intraday trading. This Indicator is based on Counter Trend strategy, trying to intercept changes in direction, in advance compared trend following indicators. We can enter in good price with this Indicator, in order to follow the inversion of the trend on the current instrument. It is advised to use low spread ECN brokers. This Indicator does Not repaint and N ot lag . Recommended timeframes are M5, M15 and H1. Recommended working pairs: All. I nst

ご紹介 Quantum Breakout PRO は 、ブレイクアウト ゾーンの取引方法を変革する画期的な MQL5 インジケーターです。 13年以上の取引経験を持つ経験豊富なトレーダーのチームによって開発されました。 クォンタム ブレイクアウト プロ は、革新的でダイナミックなブレイクアウト ゾーン戦略により、あなたのトレーディングの旅を新たな高みに押し上げるように設計されています。
クォンタム ブレイクアウト インジケーターは、5 つの利益ターゲット ゾーンを備えたブレイクアウト ゾーン上のシグナル矢印と、ブレイクアウト ボックスに基づいたストップロスの提案を提供します。
初心者トレーダーにもプロのトレーダーにも適しています。
量子EAチャネル: ここをクリック
重要!購入後、インストールマニュアルを受け取るためにプライベートメッセージを送ってください。
推奨事項:
時間枠: M15 通貨ペア: GBPJPY、EURJPY、USDJPY、NZDUSD、XAUUSD アカウントの種類: ECN、Raw、またはスプレッドが非常に低い R
日中のパーセンテージ変動レベルを自動的にサポートおよびレジスタンスとして表示します — これは 2MV Frequencies Full インジケーターです。 Evandro Soares の独自手法に基づき、 サポートとレジスタンスゾーン を パーセンテージレベル (例: 0.50%、1%、1.50%) によってすばやく特定できます。これらは完全にカスタマイズ可能で、 反転、ブレイクアウト、レンジゾーン を高い精度と視覚的な明確さで予測します。 サポートとレジスタンスゾーン をすばやく特定。
市場が反応する前に 反転やブレイクアウト を予測。
複数のインジケーター を同じチャートに制限なく追加可能。
パーセンテージレベル を戦略に合わせて調整可能。 MetaTrader 5 に対応しており、 すべてのアカウントタイプ 、 ストラテジーテスター 、および Forex 、 株式 、 指数 、 B3 - ブラジル証券取引所 市場で完全に動作します。 ️ 使用のヒント: 無料デモ版 をダウンロードして、取引している 銘柄 でインジ

The trend is your friend!
Look at the color of the indicator and trade on that direction. It does not repaint. After each candle is closed, that's the color of the trend. You can focus on shorter faster trends or major trends, just test what's most suitable for the symbol and timeframe you trade. Simply change the "Length" parameter and the indicator will automatically adapt. You can also change the color, thickness and style of the lines. Download and give it a try! There are big movements w

Detailed Description:
The Pivot Points Indicator is designed for traders who rely on pivot points, midpoints and support/resistance levels for their trading strategies. By automatically calculating and plotting these levels (based on the previous period's high, low, and close prices) , the indicator provides a clear, visual representation of critical price areas where the market may reverse or break out.The tool is particularly useful for day traders and swing traders looking to base th
FREE

YOU CAN NOW DOWNLOAD FREE VERSIONS OF OUR PAID INDICATORS . IT'S OUR WAY OF GIVING BACK TO THE COMMUNITY ! >>> GO HERE TO DOWNLOAD
This system is an Heiken Ashi system based on RSI calculations . The system is a free open source script originally published on TradingView by JayRogers . We have taken the liberty of converting the pine script to Mq4 indicator . We have also added a new feature which enables to filter signals and reduces noise on the arrow signals.
Background
HEIKEN ASHI
Th
FREE

Royal Scalping Indicator is an advanced price adaptive indicator designed to generate high-quality trading signals. Built-in multi-timeframe and multi-currency capabilities make it even more powerful to have configurations based on different symbols and timeframes. This indicator is perfect for scalp trades as well as swing trades. Royal Scalping is not just an indicator, but a trading strategy itself. Features Price Adaptive Trend Detector Algorithm Multi-Timeframe and Multi-Currency Trend Low

なぜ多くの RSI ダイバージェンス指標は「遅延」または「リペイント」するのか 十分な数のダイバージェンス指標を使ったことがある方なら、次のどちらかを経験しているはずです。 ダイバージェンスの表示が遅い、
または、ダイバージェンスのシグナルが突然消える。 これは指標の出来が悪いからではありません。
ダイバージェンスの計算ロジック自体に、避けられないトレードオフが存在するためです。 シグナルをできるだけ早く表示しようとすれば、リペイントを避けることはできません。
一方、完全にリペイントを防ごうとすると、どうしても遅延が発生します。 このインジケーターは、その両極端の間に、より現実的なバランスを見つけることを目的としています。 なぜダイバージェンスには遅延が発生するのか ダイバージェンスとは、本質的に2つの高値、または2つの安値を比較するものです。 問題は、高値や安値が「本当に確定した」と判断できるのは、 価格が反転や押し戻しを示した後 だけだという点です。 反転が起きる前の高値や安値は、あくまで一時的な価格位置であり、確定した極値ではありません。 そのため、従来のダイバージェンスアルゴリ
FREE

VWAP, or volume-weighted average price, helps traders and investors observe the average price that major traders consider the "fair price" for that move. VWAP is used by many institutions to set up large operations.
In this indicator, you can enjoy the following features:
Daily VWAP, with option to display your current price next to the chart VWAP Weekly, with option to display your current price next to the chart Monthly VWAP, with option to display your current price next to the chart
FREE

EPo-CreW Forex Super ORB-H4 インジケーターへようこそ!
本ガイドでは、市場の最初の4時間のオープニングレンジに基づいて、高確率のトレード機会を特定するためのこの強力なツールの使い方を解説します。
初心者の方から経験豊富なトレーダーまで、このシステムはより高い自信と一貫性を持って取引する手助けとなります。 これはデモ製品です。インストール日から30日後に有効期限が切れます。 NB: M5 タイムフレームに切り替えることを確認してください。このインジケーターを使うのに最適なタイムフレームです。
トレーディング戦略
戦略1:ブレイクアウト & リトレースメント(メイン)
SELL(売り)セットアップ:
価格が青いラインを上にブレイクする(高値ブレイク)
ゴールドの BREAKOUT 矢印が表示される
価格が再び青いラインの下でクローズするのを待つ
赤い SELL 矢印が表示される(押し戻しエントリー)
表示された価格で SELL エントリー
SL は赤い点(レンジ高値の上)
TP は青い点(TP1、TP2、TP3)
BUY(買い)セットアップ:
価格が赤いライン
FREE
価格アクション取引を強化するHigher Highs and Lows MT5インジケーターは、フラクタル分析を活用して重要なスイングポイントを特定し、Higher Highs (HH)、Lower Highs (LH)、Lower Lows (LL)、Higher Lows (HL) などのトレンド定義パターンを識別し、市场方向の明確な洞察を提供します。1900年代初頭のダウ理論に根ざした価格アクションの基礎原則に基づき、現代取引でAl Brooksの "Trading Price Action" シリーズのような専門家により普及したこのインジケーターは、トレンド継続と反転を検出するトレーダーの必需品となっています。特に外汇、株式、暗号通貨トレーダー間で人気があり、上昇トレンド (HH/HL) または下降トレンド (LL/LH)を確認する能力により、ノイズをフィルタリングし、プルバック中のエントリータイミングを決め、偽ブレイクを避ける—ボラティルセッションでの精度を高め、感情的な決定を減らし、スカルピングからポジショントレーディングまでの戦略で全体的な収益性を向上させます。 Hig
FREE
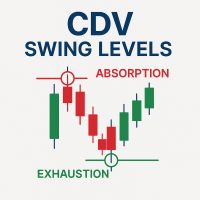
Cumulative Delta Volume (CDV) Swing Level - Absorption & Exhaustion Detector
Full Documentation: [ Download PDF ] CDV Swing Aggressive Score Guide : [ Download PDF ] Free Professional Education Course: After purchasing, contact me to receive access to the complete CDV Professional Training Video Course.
Professional CDV Analysis for Market Reversals This indicator identifies CDV absorption and exhaustion patterns to detect precise market turning points. It analyzes cumulative delta vo
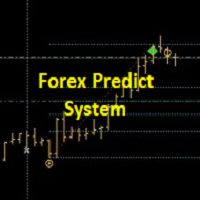
+++++++++++++++++++++++++++++++++++++++++++++++++++++++++++++++++++++++++++++++++++++++++++++++++ +++ Link to EURUSD Only Free Version --> https://www.mql5.com/en/market/product/156904?source=Unknown +++++++++++++++++++++++++++++++++++++++++++++++++++++++++++++++++++++++++++++++++++++++++++++++++ Hallo Trader, This is a traditional GANN & FIBONACCI strategy based on detection of an impulsive move in the opposite direction. This is called a Breakout. At the moment of Breakout, the indicator draw

Introduction
Reversal Candles is a cutting-edge non-repainting forex indicator designed to predict price reversals with remarkable accuracy through a sophisticated combination of signals.
Signal Buy when the last closed candle has a darker color (customizable) and an up arrow is painted below it Sell when the last closed candle has a darker color (customizable) and a down arrow is painted above it
FREE

SmartScalp M1 – Fast Scalping with Accurate Trends and Clean Signals SmartScalp M1 is a high-speed scalping indicator optimized specifically for the M1 timeframe. It combines Supertrend and Heiken Ashi to identify clear trend reversals and effectively filter market noise. BUY and SELL signals are generated when the Supertrend flips and are confirmed by Heiken Ashi candle colors, significantly reducing false signals in choppy market conditions. The indicator performs best on high-volatility ins

Synthetic Trend AI - 人工知能を搭載したスマートなトレンドインジケーター
Synthetic Trend AIインジケーターは、定番のSuperTrendの公式に人工知能アルゴリズム(k近傍法、KNN)と出来高分析を組み合わせた強力なテクニカル分析ツールです。市場をより深く理解し、より自信を持って意思決定を行いたい方のために設計されています。
Synthetic Trend AIの特徴: AIトレンド予測:KNNアルゴリズムを用いて過去のデータを分析し、価格変動の方向を予測します。 出来高分析:VWMA(出来高加重移動平均)を搭載しており、動きの方向だけでなく、その強さも考慮できます。 柔軟な感度設定:近傍数(k)とデータ量(n)を調整することで、取引スタイルに正確に適応できます。 視覚的なトレンドシグナル:価格の下側に緑色の線が表示されている場合は強気トレンド、上側に赤色の線が表示されている場合は弱気トレンドを示します。 ダイナミックトレーリングストップ:このインジケーターは、価格と出来高に反応するスマートなストップロスとして使用できます。
このインジケー
FREE

Opening‑Range Sessions(GMT 対応版) は、主要な外国為替市場セッション—— シドニー、東京、ロンドン、ニューヨーク ——のオープニングレンジ(高値・安値とカラーボックス)を自動で描画する軽量インジケーターです。
ブローカーサーバーのタイムゾーンを自動検出するため、サーバーやトレーダーがどこにいても各セッションが正しいローカル時刻で開始されます。 主な機能 自動タイムゾーン検出 – サーバーの GMT オフセットを取得し、サーバー変更や VPS 移行時の手動調整が不要。 4 つの組み込みセッション + 24 時間ボックス – シドニー、東京、ロンドン、ニューヨーク、または 24 時間レンジを個別にオン/オフ可能。 ピップス / パーセントモード – オープン価格からの固定ピップ幅または%でレンジを指定。 深夜跨ぎを自動処理 – 0:00 を跨ぐセッション(例: シドニー)でもボックスが途切れず正しく表示。 高いカスタマイズ性 – セッションごとにボックス色を設定、ラインのスタイル・太さも自由、中央にセッション名を自動表示。 即時反映 – パラメータ変更がリアルタ
FREE

トレンドラインマップインジケーターは、トレンドスクリーナーインジケーターのアドオンです。トレンドスクリーナー(トレンドラインシグナル)によって生成されたすべてのシグナルのスキャナーとして機能します。
これは、トレンドスクリーナーインジケーターに基づくトレンドラインスキャナーです。 Trend Screener Pro インジケーターがない場合、Trend Line Map Proは機能しません。
It's a Trend Line Scanner based on Trend Screener Indicator. If you don't have Trend Screener Pro Indicator, the Trend Line Map Pro will not work .
ブログにアクセスすると、トレンドラインマップインジケーターの無料バージョンをダウンロードできます。 Metatrader Testerの制限なしで、購入する前に試してみてください。 : ここをクリック
1.簡単になる利点 通貨と時間枠に基づいて売買シグナルを表示します。 チャー

Haven Bands Reversion – 平均回帰トレーディングのためのプロフェッショナルインジケーター 平均回帰戦略を使用するトレーダーのために設計された、強力で正確なツール Haven Bands Reversion をご紹介します。従来のボリンジャーバンドとは異なり、このインジケーターは 出来高加重移動平均線(VWMA) に基づいており、チャネルが実際の市場活動により敏感に反応します。最も重要なのは、このインジケーターが リペイントしないシグナル を生成し、信頼性の高いエントリーポイントを提供することです。 私の他の製品はこちら -> こちら . 価格がその「公正な」価値からどれだけ逸脱したかを理解することは、反転や調整での取引を成功させるための鍵です。Haven Bands Reversionはこれらの瞬間を自動的に特定し、価格が動的なボラティリティチャネル内に戻ったときに明確なシグナルを発します。 なぜVWMAは標準のSMAより優れているのか? すべてのローソク足を平等に扱う単純移動平均線(SMA)とは異なり、 VWMAは出来高の多いローソク足に大きな重み を置きます
ICONIC SMC Indicator — Trade with Institutional Clarity Finally, objective SMC—without the manual grind. Tired of spending hours marking charts only to miss the entry by a few pips? Doubting your read when real money is on the line? The era of subjective, time-consuming SMC is over. The ICONIC SMC Indicator is not “another tool.” It’s an institutional-grade analysis engine that automates the full Smart Money Concepts workflow and turns your chart into a live dashboard of high-probability opport
FREE

HiperCube AutoTrend Lines Darwinex Zero 20%割引コード: DWZ2328770MGM_20 このインジケーターは、サポートとレジスタンスを簡単に識別し、チャートにラインを描画して、市場の重要なポイントがどこにあるかを知るのに役立ちます。 このツールは、取引を半自動化し、作業の一部をあなたに代わって行うための最良の方法です。 レジスタンスまたはサポートは、識別が難しい場合がある重要なレベルですが、これで混乱がなくなります。
HiperCube Autotrends は、あらゆる時間枠向けに設計されています。 あらゆる種類の戦略、スキャルピング、スイング、日中取引... すべての市場、Forex、コモディティ、インデックス、暗号通貨... XAU、EURUSD、BTC、US30 など、お好きな場所で使用できます。 ChatgptとAIが開発に使用されました アカウント: お好きな場所で、リアルまたはデモで使用できます。 どのような種類のアカウントでもネットまたはヘッジが有効です
機能 使いやすい 便利なオプションが揃っています レジスタンスラ
FREE
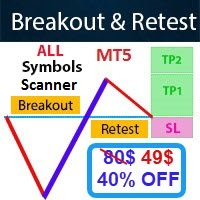
- Real price is 80$ - 40% Discount (It is 49$ now) Contact me for instruction, any questions! - Non-repaint - I just sell my products in Elif Kaya Profile, any other websites are stolen old versions, So no any new updates or support. - Lifetime update free Related product: Bitcoin Expert Introduction The Breakout and Retest strategy is traded support and resistance levels. it involves price breaking through a previous level. The break and retest strategy is designed to help traders do two main

今の価格で入手できるうちに、ぜひ手に入れてください。価格はいつでも変更される可能性があります。 "Black Horse" インディケーターの目的は、価格アクションとVWAPインディケーターとの間のダイバージェンスを特定することです。これは潜在的な誤ったダイバージェンスを取り除き、高品質で正確なアラートを生成するためにフィルターを使用します。
ベアリッシュなダイバージェンスは、キャンドルの上に表示される赤いドットで示され、ブルリッシュなダイバージェンスはキャンドルの下に緑のドットで表示されます。
ダイバージェンスの主なフィルターは、ATR(平均真のレンジ)および見直し期間内の前のキャンドルの価格変動を中心にしています。ダイバージェンスは、見直し期間内の価格変動が十分に鋭いことで、ATR倍数とATRをかけたものを上回ると判定されます。
計算の特性から、より高いタイムフレームで作業する際には、ATR倍数と見直し期間により低い値を設定することが望ましいです。より高いタイムフレームでは、価格変動がより平滑化されるため、15分足のようなシャープな価格変動はより頻繁に発生せず、通常はより少
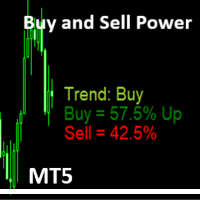
Simple Indicator that shows the Buy and Sell volume in percent. The Buy and Sell Power indicator for MetaTrader 5 calculates and displays estimated buy/sell volume percentages over a user-defined period (default: 14 bars) using tick volume data. It overlays text labels on the chart showing Buy % (with "Up" if >51%), Sell % (with "Dn" if >51%), and a trend signal based on thresholds: Neutral (<55%), Trend: Buy/Sell (55%+), Trend: Strong Buy/Sell (62%+), Trend Max UP/Down (65%+), or Trend change s
FREE

Haven HTF Candle — あなたのチャートに上位足のパワーを Haven HTF Candle のご紹介 — 上位足(HTF)のローソク足をメインチャートに直接表示する強力なツールです。ウィンドウを常に切り替えるのをやめ、真の市場コンテキストを把握し始めましょう。これは、十分な情報に基づいた取引決定を下すための基盤となります。 その他の製品 -> こちら 。 主な機能と「Power of 3」コンセプト 「Power of 3」(AMD)コンセプトに基づく分析: インジケーターは HTFローソク足の始値 を明確に表示します。これはこの戦略の重要なレベルです。下位足にいながら、アキュムレーション(Accumulation)、マニピュレーション(Manipulation, Judas Swing)、ディストリビューション(Distribution)の各フェーズを簡単に特定できます。 トレンドの即時評価: 現在のタイムフレームでの動きが、より大きな全体像の中で推進波なのか調整波なのかを素早く理解できます。 視覚的な利便性: HTFローソク足の位置、色、数を完全にカスタマイズして
FREE

A top-quality implementation of the famous Super Trend indicator, which needs no introduction. It is completely loyal to the original algorithm, and implements many other useful features such as a multi-timeframe dashboard. [ Installation Guide | Update Guide | Troubleshooting | FAQ | All Products ] Easy to trade It implements alerts of all kinds It implements a multi-timeframe dashboard It is non-repainting and non-backpainting Input Parameters
ATR Period - This is the average true range peri
FREE

Discover the power of harmony in the markets with this advanced harmonic pattern indicator. Designed for demanding technical traders, this indicator automatically detects 11 of the most popular harmonic patterns, including the Gartley, Bat, Crab, Butterfly, Shark, Cypher, and many more.
Thanks to its dynamic dashboard, you can easily manage the visibility of patterns on the chart, activating or deactivating the ones you want in real time without overloading your platform. This flexibility allo
FREE

Institutional Liquidity Sweep & Stop Hunt Detector The FAKEOUT MATRIX PRO is a professional-grade analytical tool designed to identify the exact moments when institutional players "trap" retail traders. By monitoring session extremes and detecting high-probability Liquidity Sweeps, this indicator provides the technical edge needed to trade reversals with precision. The Institutional Logic Large financial institutions require significant liquidity to fill their orders. They often find this liquid
FREE

トレンドBB MACD ADXフィルターインジケーター トレンドBB MACD ADXフィルター は、 ボリンジャーバンド(BB) 、 MACD 、そして 方向性移動指数(ADX) を組み合わせた高度なテクニカルツールです。今回は、 +DI と**-DI**による完全な方向性分析システムと、MACDとのクロス確認オプションを新たに組み込みました。このツールは、正確でフィルターされたトレードシグナルを提供するために設計されており、 スキャルピング 、 デイトレード 、 スイングトレード に最適化されています。トレンドの方向性だけでなく、その強さと信頼性も特定するのに役立ちます。 主要コンポーネント ボリンジャーバンド(BB) BBミドル(中央線) : 単純移動平均線(SMA)。 BBアッパー / BBロウアー : SMA ± (標準偏差 × 乗数)。 完全なカスタマイズ : 色、線の太さ、スタイルの調整が可能です。 ハイブリッドシグナル(Hybrid Signal) MACDライン(ヒストグラムではない)とBBミドルを組み合わせ、その値をスケーリングしてダイナミックなシグナルを生成します
FREE

Ritz Smart Detection BUY & SELL
The Ritz Smart Detection BUY & SELL is a next-generation trading indicator engineered to detect high-probability entry signals by combining ATR-based volatility measurement , trend reversal detection , and smart alerting technology . It delivers real-time BUY/SELL opportunities with adaptive targets and risk levels, making it a versatile tool for both scalpers and swing traders. Core Market Logic ATR-Driven Volatility Analysis Uses multiple ATR methods (SMA, EMA,
FREE

RiskKILLER_AI Navigatorは、AIベースのマルチタイムフレーム市場方向性&戦略アシスタントです。 トレーディングのパフォーマンスは、プロのように市場を理解することにかかっています。それを実現するのが、 RiskKILLER_AI Navigator です: MQL5の 外部 で動作するAI駆動のトレンド、センチメント、マクロ分析により、あなたのトレードスタイルに合わせた機関レベルの洞察を得られます。 購入後、ユーザーマニュアルを入手するには:1. マニュアルを要求する コメント を投稿 2. 私に ダイレクトメッセージ を送信してください。 [ 専用グループ | バージョン MT5 - MT4 ]
核心的な利点 複数のタイムフレームと資産にわたるリアルタイムの市場方向性 マクロ指標、ニュース、センチメントのAI駆動分析 あなたのトレードスタイル(手動または自動)に基づいた tailored なアドバイス RiskKILLER_AI エキスパートアドバイザー (EA) との直接的な相乗効果
主な機能 AI駆動グローバルトレンドダッシュボード - 主要通貨ペアとBT

Smart Market Structure Simple is a powerful indicator that helps traders identify market structure based on the Smart Money Concept (SMC) . This indicator automatically detects Break of Structure (BOS), Change of Character (CHoCH), Fair Value Gaps (FVG), Order Blocks (OB), Liquidity Zones (LQZ), and key swing points Higher High (HH), Higher Low (HL), Lower High (LH), Lower Low (LL) . Main Objective: Assist traders in tracking institutional flow ( Smart Money ) and finding high-probability trade

トレンドトレーディング は、タイミングのプルバックとブレイクアウトにより、市場で起こっているトレンドから可能な限り利益を得るように設計された指標です。確立されたトレンドの中で価格が何をしているかを分析することにより、取引の機会を見つけます。 [ インストールガイド | 更新ガイド | トラブルシューティング | よくある質問 | すべての製品 ]
自信を持って効率的に金融市場を取引する むち打ちにならずに確立されたトレンドから利益を得る 収益性の高いプルバック、ブレイクアウト、早期の逆転を認識する この指標は、独自の品質とパフォーマンスを分析します 複数時間枠のダッシュボードを実装します インジケーターは再描画されていません 電子メール/音声/視覚アラートを実装します 確立されたトレンドは多くの取引機会を提供しますが、ほとんどのトレンド指標はそれらを完全に無視しています。インジケーターの解釈はかなり簡単です:
(1) トレンドの変化
(2) トレンドの方向への後退 (3) トレンドの方向へのブレイクアウト 赤いダッシュ は下降トレンド中の修正です 青いダッシュ は上昇トレンド中

Lion Arrow Super Arrow Indicator for MetaTrader 5
The Lion Arrow Super Arrow Indicator for MetaTrader 5 is a hybrid trading system that integrates multiple advanced technical analysis tools to generate high-quality trading signals. By combining trend, momentum, and pressure-based indicators, it aims to reduce false signals and improve entry accuracy. Core Components of the Indicator The Lion Arrow Super Arrow indicator is built on several key analytical elements: Fast Moving Average: Reacts qui
FREE

Price Volume Distribution
価格レベル別の取引量分布を分析するVolume Profileインジケーター。MT5向けにPOC、Value Area、出来高スパイク、ゾーンベースのシグナルフィルタリングを表示。
概要
Price Volume DistributionはMetaTrader 5用の出来高分析インジケーターです。M1タイムフレームデータを使用して価格レベル別の出来高分布を計算・表示し、ヒストグラムバーと参照線による視覚的表現を提供します。 システムを理解するためのユーザーガイド | 他の言語のユーザーガイド 主要機能
インジケーターが特定するもの: - Point of Control (POC):最も取引量の多い価格レベル - Value Area High/Low (VAH/VAL):出来高の70%を含む価格帯 - 出来高スパイク:異常に高い活動のある価格レベル - 出来高集中に基づくサポートとレジスタンスゾーン
プロファイルモード
3つの計算モードが利用可能:
1. セッションモード:日足(D1)バー境界内の出来高を分析

If you like this free tool, check out my EA which is currently on a Launch Sale for only $39 ! https://www.mql5.com/zh/market/product/159451?source=Site Short Description: A specialized technical indicator designed for Gold (XAUUSD) trading. It automatically identifies market swings, plots key 0.382 and 0.618 Fibonacci retracement levels, and sen mobile push nothiations not sat 面紙 面 面 面面 筆/內托are detected. 【Key Features】 Dual Monitoring Mode: Simultaneously tracks the 0.382 (Shallow Retracement)
FREE

Introducing the MACD Enhanced – an advanced MACD (Moving Average Convergence Divergence) indicator that provides traders with extended capabilities for trend and momentum analysis in financial markets. The indicator uses the difference between the fast and slow exponential moving averages to determine momentum, direction, and strength of the trend, creating clear visual signals for potential entry and exit points. Attention! To achieve the best results, it is recommended to adapt the indicator
FREE

これがあなたの推測をやめて戦略を理解するチャンスです。 281の取引を追跡 | 64%の勝率 | 過去データで70%のリスク対リワード これらは単なる数字ではありません—この戦略がどのように機能するかを示す実際の統計です。より賢く取引する方法を探しているなら、これがあなたをそこに導くツールです。 エンゴルフィング戦略の現実を見るのが好きでしたか?購入後、 お問い合わせください 、他の製品の1つを無料で提供します。
他の製品をご覧ください でさらに実際の戦略を確認し、 Real Tradesコミュニティに参加 して自信を持って取引し、本物のトレーダーとつながりましょう! キャンドルレンジ理論(CRT) に基づいて構築された実証済みのツールで、流動性の急増を正確かつ一貫して特定するよう設計されています。この戦略は、前のキャンドルのレンジを使用して価格変動を予測し、偽のシグナルをフィルタリングするための追加の確認とともに、流動性の襲撃を追跡します。 このインジケーターがあなたを助ける方法: 流動性に基づく取引を特定 – ストップロスとテイクプロフィット付きの買い/売りシグナル。 エントリー前

Spline Searcher MT5 — 価格スプラインと関心ポイントの早期検出のためのマルチ通貨インジケータ 複雑な価格フォーメーションの初期段階を自動検出し、可視化する補助ツールです。本インジケータは**完全に手動取引専用**であり、より複雑な市場フォーメーションやトレンド(その一部としてシンプルなフォーメーションが含まれる可能性あり)を早期に検出しようとする取引者に適しています。最大6種類の初期フォーメーション(遠隔足または近接足に頂点を持つ放物線、減衰が調整可能な調和振動、線形ブレイクなど)を検出します。すべてのフォーメーションは、精度、サイズ、持続時間、頑健性といった基準で評価されます。外観の柔軟なカスタマイズと高度な検索ロジックが提供されています。 追加機能やサポートをご利用になるためのリンク もし以下の目的をお持ちの場合: MetaTrader 4 用のインジケータバージョンを入手する 質問する、またはサポートを受ける 本インジケータは誰向けですか? 興味深い市場状況を早期に検出し、多様なアプローチを試したい取引者向けです。 放物線、調和波、エリオット波などを分析し、

Channel Searcher MT5 — 複数通貨対応の価格チャネル検出インジケータ フラクタルピークと幾何学的分析に基づき、価格チャネルを自動検出して可視化する補助ツールです。本インジケータは**完全に手動取引専用**であり、市場の構造的アプローチを重視するトレーダーに最適です。チャネルは、タッチ回数、傾き、充填度、ブレイクの深さ、フラクタルの相対位置など、複数の基準に基づいて検出されます。任意の価格チャートに柔軟にカスタマイズできます。 追加機能やサポートをご利用になるためのリンク もし以下の目的をお持ちの場合: MetaTrader 4 用のバージョンを入手する 質問する、またはサポートを受ける このインジケータは誰向けですか? 明確な価格構造を探しており、「ノイズ」やランダムなラインではなく、十分な品質のチャネルを表示したいトレーダー向けです。 多数のチャートを視覚的に監視することなく、より多くの注目ポイントを得たいトレーダー向けです。通知システムが用意されています。 柔軟な設定を重視する方:感度、色、音声、描画モードを調整でき、特定のロウソク足範囲に検索を限定することも

移動平均線付き出来高は、移動平均線を使ったシンプルで分かりやすい出来高インジケーターです。
使い方は?
サポート/レジスタンス・レベルやトレンド・チャネルのボラティリティ・ブレイクアウトからエントリーする際のシグナルのフィルタリングに適しています。また、出来高によってポジションを決済するシグナルにもなります。
入力パラメータ
Volumes - リアルまたはティックの出来高。 MA_period - 移動平均期間。
移動平均線付き出来高は、移動平均線を使ったシンプルで分かりやすい出来高インジケーターです。
使い方は?
サポート/レジスタンス・レベルやトレンド・チャネルのボラティリティ・ブレイクアウトからエントリーする際のシグナルのフィルタリングに適しています。また、出来高によってポジションを決済するシグナルにもなります。
入力パラメータ
Volumes - リアルまたはティックの出来高。 MA_period - 移動平均期間。
FREE

BlueBoat – Prime Cycle is a technical indicator for MetaTrader 5 that visualizes market cycles based on the Fimathe cycle model (Marcelo Ferreira) . It identifies and displays historic and live cycle structures such as CA, C1, C2, C3, etc., helping traders understand the rhythm and timing of price movement across multiple sessions. This tool is ideal for manual analysis or as a supporting signal in discretionary strategies. Key Features Historical Cycle Analysis – Backtest and visualize as many

L'indicatore "Heikin Ashi" è stato progettato per migliorare l'analisi dei grafici finanziari con un sistema di candele Heikin Ashi. Le candele Heikin Ashi sono un metodo avanzato per visualizzare il prezzo, che aiuta a filtrare il rumore del mercato, rendendo più chiara l'interpretazione dei trend e migliorando la qualità delle decisioni di trading. Questo indicatore consente di visualizzare le candele Heikin Ashi al posto delle candele giapponesi tradizionali, rendendo l'analisi grafica più pu
FREE

DRX Smart Risk | プロフェッショナル・トレードプランナー 推測はやめましょう。正確な計画を始めましょう。 リスクリワード比率(R:R)やロットサイズの手動計算は時間がかかり、ミスの元です。 DRX Smart Risk は、TradingViewのようなプロフェッショナルなチャートプラットフォームの直感的なワークフローを、MetaTrader 5にもたらします。 問題点: MT5の標準ラインは扱いにくく、時間足を変更すると消えてしまい、R:Rを頭の中で計算しなければなりません。 解決策: DRX Smart Risk はハイエンドな視覚ツールです。チャート上にインタラクティブなリスク/リワードボックスを描画し、 すべて をリアルタイムで計算します。ラインをドラッグするだけで、リスク金額と潜在的な利益が正確にわかります。 主な機能: 「スマートドラッグ」テクノロジー: ストレスのない操作感。独自の「アンカーロジック」により、TPボックスとSLボックスが同期して動きます。 ワンクリック・スイッチ: エントリーライン上のスマートボタンで、**LONG(買い) から SH
FREE

Daily VWAP Indicator (Volume Weighted Average Price) Special Deal! Leave a review and get the indicator Long & Short Cointegration Analyzer for free — just send me a message!
Description The Daily VWAP (Volume Weighted Average Price) indicator is an essential tool for traders seeking to identify the true average price of an asset throughout the day, adjusted by traded volume. Primarily used by institutional and professional traders, the daily VWAP serves as a reference point to identify the av
FREE
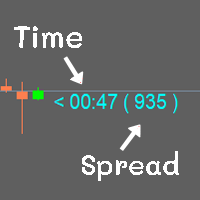
Show the time of candlesticks and spread. All data will be displayed in a rod. Can change color Can fix the size as needed
MT4 : Link https://www.mql5.com/en/market/product/102742 MT5 : Link https://www.mql5.com/en/market/product/102834
Most free code on various websites I didn't write it myself. I only do a little bit.
If you like it, please give 5 stars with it. Thank you.
FREE

TickFlow はティックデータを解析し、チャート上で重要なゾーンを視覚的に強調するツールです。現在および過去のティックを集計し、買い/売りの比率を表示し、サポート/レジスタンスレベルやクラスター領域の把握に役立ちます。 MetaTrader 4 用バージョンです。 動作概要(簡潔) TickFlow はティックデータを収集し、価格ステップとローソク足(キャンドル)ごとに集計します。
蓄積されたデータに基づいて、アップ/ダウンのティックカウンター、買い/売り比率、履歴レベル、クラスターといった可視化を構築します。
ユーザーは設定で感度や分析期間を調整できます。本ツールはトレードの判断を行うものではなく、分析用のデータを提供します。 特長 ローソク足ごとのティック活動表示(tick counters) 買い/売りの割合(パーセンテージ表示) ティック出来高に基づく履歴のサポート/レジスタンスレベル構築 価格領域のクラスター分析(cluster analysis) スキャルピング、デイトレード、中期取引など用途に応じた柔軟な感度設定 チャートの煩雑化を抑えるためのティック履歴の表示

This indicator plots the volume profile by Price on the chart
There are 5 ways to view it:
By Total Volume Traded (Premium Version); Volume Ticks(Forex) Separated by Buyers and Sellers (Premium Version); Buyers Only (Premium Version); Sellers Only (Premium Version); Business balance (Buyers - Sellers) (Premium Version); .
It is possible to select how many days the profiles will be calculated.( Premium Version)
On the current day it recalculates the histogram data for each new candlestick.
FREE

高度な Gartley パターン認識インジケーターへようこそ このインジケーターは、価格構造の HH と LL、およびフィボナッチ レベルに基づいてガートリー パターンを検出し、特定の Fib レベルが満たされると、インジケーターはチャート上にパターンを表示します。 MT4 バージョン : WH Advanced Gartley Pattern MT4 **このインジケーターは、すべてのパターン認識を含む コンボ Ultimate Harmonic Patterns MT5 の一部です。**
特徴 : 高精度でガートレーパターンを検出するための高度 な アルゴリズム。 非常に 高速 でリソースが 少ない (マシンへの要求が少ない)。 遅延 も再 描画 もありません。 カスタム Fib レベル 調整 (好みの設定に基づいてフィボナッチ レベルを変更できます)。 弱気パターン と 強気 パターンを同時に表示します (弱気または強気設定の複数のパターンを表示する機能付き)。 取引レベルの ラインを表示します (調整可能なストップとターゲット 1 およびターゲット 2 付き)。 任意の
FREE
Engulfing Zone Sniper MT5 — Multi-Timeframe Signal & Zone Indicator The Engulfing Zone Sniper MT5 is a technical analysis tool designed to highlight engulfing candlestick patterns in combination with adaptive support/resistance zones. It provides visual markers and optional alerts to assist traders in identifying market structure reactions across multiple timeframes. Key Features Multi-Timeframe Detection – Option to scan higher timeframe engulfing setups with lower timeframe confirmation. Su
MetaTraderマーケットはMetaTraderプラットフォームのためのアプリを購入するための便利で安全な場所を提供します。エキスパートアドバイザーとインディケータをストラテジーテスターの中でテストするためにターミナルから無料のデモバージョンをダウンロードしてください。
パフォーマンスをモニターするためにいろいろなモードでアプリをテストし、MQL5.community支払いシステムを使ってお望みのプロダクトの支払いをしてください。
取引の機会を逃しています。
- 無料取引アプリ
- 8千を超えるシグナルをコピー
- 金融ニュースで金融マーケットを探索
新規登録
ログイン