Guarda i video tutorial del Market su YouTube
Come acquistare un Robot di Trading o un indicatore
Esegui il tuo EA
hosting virtuale
hosting virtuale
Prova un indicatore/robot di trading prima di acquistarlo
Vuoi guadagnare nel Market?
Come presentare un prodotto per venderlo con successo
Indicatori tecnici per MetaTrader 5 - 6

Smart Structure Concepts MT5 is an all-in-one Smart Money Concepts indicator created to help traders visually read institutional structure and understand why each movement occurs. Unlike most indicators on the Market, this system does not only draw patterns or zones. It teaches.
Every visual element (BOS, CHoCH, OB, FVG, EQH, EQL, PDH, PDL, etc.) includes educational tooltips that explain the concept and the suggested trader action (buy, sell, or wait).
These on-chart explanations make it perfe
FREE

YOU CAN NOW DOWNLOAD FREE VERSIONS OF OUR PAID INDICATORS . IT'S OUR WAY OF GIVING BACK TO THE COMMUNITY ! >>> GO HERE TO DOWNLOAD
This system is an Heiken Ashi system based on RSI calculations . The system is a free open source script originally published on TradingView by JayRogers . We have taken the liberty of converting the pine script to Mq4 indicator . We have also added a new feature which enables to filter signals and reduces noise on the arrow signals.
Background
HEIKEN ASHI
Th
FREE
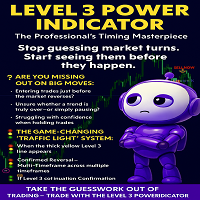
LEVEL 3 POWER INDICATOR
The Professional’s Timing Masterpiece
Stop guessing market turns. Start seeing them before they happen.
---
Are You Missing Out on Big Moves?
Entering trades just before the market reverses?
Unsure whether a trend is truly over—or simply pausing?
Struggling with confidence when holding trades?
You’re not alone. Most traders wrestle with these exact challenges… until they discover the Level 3 Power Indicator.
---
The Game-Changing “Traffic Light” Syst
FREE
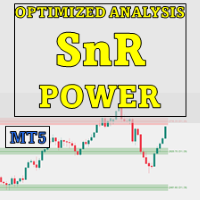
Special offer : ALL TOOLS , just $35 each! New tools will be $30 for the first week or the first 3 purchases ! Trading Tools Channel on MQL5 : Join my MQL5 channel to update the latest news from me Panoramica
OA SnR Power è uno strumento potente progettato per aiutare i trader a identificare e valutare la forza dei livelli di supporto e resistenza. Integrando fattori chiave come il volume di trading, la frequenza dei rimbalzi e il numero di test, questo indicatore offre una vision
FREE
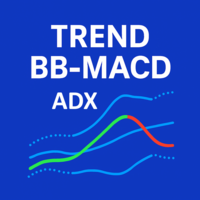
Indicatore Trend BB MACD con Filtro ADX L' indicatore Trend BB MACD con Filtro ADX è uno strumento tecnico avanzato che combina le Bande di Bollinger (BB) , il MACD e l' Indice di Movimento Direzionale (ADX) . Ora incorpora un sistema completo di analisi direzionale con +DI e -DI , oltre a opzioni di conferma incrociata con il MACD. È progettato per offrire segnali di trading precisi e filtrati, ottimizzati per lo scalping , l' intraday e lo swing trading , aiutando a identificare non solo la d
FREE

Indicatore di Pivot Points che calcola livelli essenziali di supporto e resistenza per day trader e swing trader. Ideale per identificare punti di inversione, definire obiettivi e gestire il rischio su qualsiasi timeframe. Per i Day Trader
Identifica livelli chiave per ingressi e uscite Definisce livelli di stop loss e obiettivi Riconosce potenziali inversioni intraday Per gli Swing Trader
Identifica zone di supporto e resistenza settimanali/mensili Pianifica posizioni di medio termine Complet
FREE

MACD divergence indicator finds divergences between price chart and MACD indicator and informs you with alerts (popup, mobile notification or email) . Its main use is to find trend reversals in the chart. Always use the divergence indicators with other technical assets like support resistance zones, candlestick patterns and price action to have a higher possibility to find trend reversals. Three confirmation type for MACD divergences: MACD line cross zero level Price returns to previous H/L Crea
FREE

Se ti piace questo progetto, lascia una recensione a 5 stelle. Questo indicatore disegna i prezzi aperti, alti, bassi e di chiusura per i
specificati
periodo e può essere regolato per un determinato fuso orario. Questi sono livelli importanti guardati da molti istituzionali e professionali
commercianti e può essere utile per voi per conoscere i luoghi dove potrebbero
essere più
attivo. I periodi disponibili sono: Giorno precedente. Settimana precedente. Mese precedente. Precedente trimestre. A
FREE
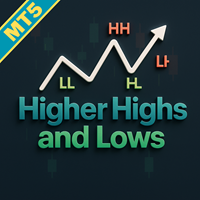
Migliora il tuo trading di price action con l'indicatore Higher Highs and Lows MT5, uno strumento robusto che sfrutta l'analisi frattale per individuare punti di swing chiave e identificare pattern che definiscono il trend come Higher Highs (HH), Lower Highs (LH), Lower Lows (LL) e Higher Lows (HL) per insight chiari sulla direzione del mercato. Tratto dai principi fondamentali di price action radicati nella Teoria di Dow dei primi del 1900 e popolari nel trading moderno da esperti come Al Brook
FREE

Market Structure CHoCH/BOS Indicator for MT5 Overview
The Market Structure CHoCH/BOS (Fractal) indicator identifies key shifts in market direction based on fractal-based structural analysis. It automatically detects Change of Character (CHoCH) and Break of Structure (BOS) signals, two essential concepts in modern price action and Smart Money trading. How It Works
The indicator analyzes swing highs and lows using a fractal algorithm defined by the Length parameter. When price crosses a previous

Trend Hunter è un indicatore di tendenza per lavorare nei mercati Forex, criptovaluta e CFD. Una caratteristica speciale dell'indicatore è che segue con sicurezza la tendenza, senza cambiare il segnale quando il prezzo supera leggermente la linea di tendenza. L'indicatore non viene ridisegnato; un segnale per entrare nel mercato appare dopo la chiusura della barra.
Quando ci si sposta lungo un trend, l'indicatore mostra ulteriori punti di ingresso nella direzione del trend. Sulla base di quest

Candela Haven HTF — La Potenza del Timeframe Superiore sul Tuo Grafico Ti presentiamo Candela Haven HTF — un potente strumento che visualizza le candele di un timeframe superiore (HTF) direttamente sul tuo grafico di lavoro. Smetti di passare continuamente da una finestra all'altra e inizia a vedere il vero contesto di mercato, che è la base per prendere decisioni di trading ben informate. Altri prodotti -> QUI . Caratteristiche Principali e il Concetto "Power of 3" Analisi basata sul concetto
FREE

This indicator has been developed to identify and display these trends quickly and easily, allowing you to see instantly, those currency pairs which are trending, and those which are not – and in all timeframes, with just one click. The 28 currency pairs are displayed as a fan as they sweep from strong to weak and back again, and this is why we call it the ‘currency array’. All 28 pairs are arrayed before you, giving an instant visual description of those pairs that are trending strongly, those
SEER SPIKE DETECTOR
The Ultimate Market-Reversal & Spike Forecasting Tool for Crash & Boom Indices, Forex & Synthetic Markets
SPECIAL BONUS (VALID TILL JUNE 2026)- OUR DAILY SCALPER EA for BTCUSD and VIX75 •·································································•

Adaptive Volatility Range [AVR] - is a powerful tool for identifying key trend reversals. AVR - accurately displays the Average True Volatility Range taking into account the Volume Weighted Average price. The indicator allows you to adapt to absolutely any market volatility by calculating the average volatility over a certain period of time - this provides a stable indicator of positive transactions. Thanks to this , Adaptive Volatility Range has a high Winrate of 95% There are two ways t
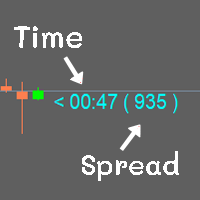
Show the time of candlesticks and spread. All data will be displayed in a rod. Can change color Can fix the size as needed
MT4 : Link https://www.mql5.com/en/market/product/102742 MT5 : Link https://www.mql5.com/en/market/product/102834
Most free code on various websites I didn't write it myself. I only do a little bit.
If you like it, please give 5 stars with it. Thank you.
FREE

** All Symbols x All Timeframes scan just by pressing scanner button ** Discount: The price is $50$, But now it is just $39, Limited time offer is active.
*** Contact me to send you instruction and add you in "Trend Reversal group" for sharing or seeing experiences with other users. Introduction: Trendlines are the most famous technical analysis in trading . Trendlines continually form on the charts of markets across all the different timeframes providing huge opportunities for traders

HiperCube AutoTrend Lines Codice sconto del 20% su Darwinex Zero: DWZ2328770MGM_20 Questo indicatore ti aiuta a identificare facilmente supporti e resistenze, tracciare linee nel grafico e sapere dove si trova un punto importante nel mercato. Questo strumento è il modo migliore per automatizzare in modo semi automatico il tuo trading, svolgendo parte del lavoro per te. Resistenza o supporto sono livelli importanti che a volte sono difficili da identificare, ma ora non ti creeranno più confusion
FREE
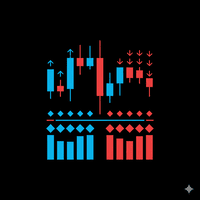
TrendPower All-In-One Strict v1.00 Description TrendPower All-In-One Strict is a comprehensive trend-following trading system designed for MetaTrader 5. It acts as a "confluence detector," meaning it filters market noise by requiring multiple technical indicators to agree before generating a signal. The indicator utilizes a "Strict" logic engine, meaning a signal is only generated when momentum, trend direction, and volatility filters all align perfectly. It displays data in a separate sub-win

Introduction
Reversal Candles is a cutting-edge non-repainting forex indicator designed to predict price reversals with remarkable accuracy through a sophisticated combination of signals.
Signal Buy when the last closed candle has a darker color (customizable) and an up arrow is painted below it Sell when the last closed candle has a darker color (customizable) and a down arrow is painted above it
FREE

Perché la maggior parte delle divergenze RSI è o in ritardo o soggetta a repaint Se hai utilizzato abbastanza indicatori di divergenza RSI, probabilmente ti sei imbattuto in una di queste due situazioni: o la divergenza appare molto in ritardo,
oppure una divergenza mostrata in precedenza scompare improvvisamente. Questo non significa che l’indicatore sia “scritto male”.
Il motivo è che la logica di calcolo delle divergenze comporta un compromesso inevitabile . Se si vuole un segnale immediato,
FREE
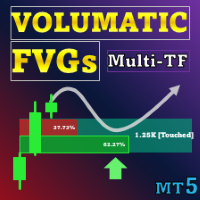
Offerta speciale : ALL TOOLS , solo $35 ciascuno! I nuovi strumenti saranno a $30 per la prima settimana o per i primi 3 acquisti ! Trading Tools Channel on MQL5 : Unisciti al mio canale MQL5 per ricevere le ultime novità Volumatic Fair Value Gaps (FVG) identifica e mantiene zone significative di squilibrio di prezzo e scompone il volume direzionale all’interno di ciascun gap. Il volume è campionato da un timeframe inferiore (M1 predefinito, selezionabile), suddiviso tra acquisti e

Strumento di Analisi Trend Multi-Timeframe Vuoi seguire i trend su più timeframe senza cambiare costantemente i grafici? Smart Trend Consensus MT5 è uno strumento di analisi tecnica che consolida i dati da 7 timeframe simultaneamente (M1, M5, M15, M30, H1, H4, D1). L'indicatore utilizza 7 criteri tecnici per valutare lo stato del trend su ogni timeframe e visualizza tutte le informazioni su una dashboard visiva. Uno strumento di analisi multidimensionale che aiuta i trader a risparmiar

Necessary for traders: tools and indicators Waves automatically calculate indicators, channel trend trading Perfect trend-wave automatic calculation channel calculation , MT4 Perfect trend-wave automatic calculation channel calculation , MT5 Local Trading copying Easy And Fast Copy , MT4 Easy And Fast Copy , MT5 Local Trading copying For DEMO Easy And Fast Copy , MT4 DEMO Easy And Fast Copy , MT5
DEMO
砖图 Renko PRO->>>
The display of the brick map on the main map.
The Renko chart ideally r
FREE

This indicator provides the ability to recognize the SMC pattern, essentially a condensed version of the Wyckoff model. Once the pattern is confirmed by RTO, it represents a significant investment opportunity. There are numerous indicators related to SMC beyond the market, but this is the first indicator to leverage patterns to identify specific actions of BigBoy to navigate the market. The SMC (Smart Money Concept) pattern is a market analysis method used to understand the behavior of "smart

Introducing Indicator for PainX and GainX Indices Traders on Weltrade Get ready to experience the power of trading with our indicator, specifically designed for Weltrade broker's PainX and GainX Indices. Advanced Strategies for Unbeatable Insights Our indicator employs sophisticated strategies to analyze market trends, pinpointing optimal entry and exit points. Optimized for Maximum Performance To ensure optimal results, our indicator is carefully calibrated for 5-minute timeframe charts on

A top-quality implementation of the famous Super Trend indicator, which needs no introduction. It is completely loyal to the original algorithm, and implements many other useful features such as a multi-timeframe dashboard. [ Installation Guide | Update Guide | Troubleshooting | FAQ | All Products ] Easy to trade It implements alerts of all kinds It implements a multi-timeframe dashboard It is non-repainting and non-backpainting Input Parameters
ATR Period - This is the average true range peri
FREE
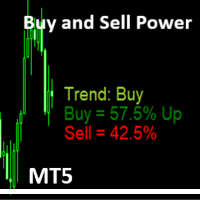
Simple Indicator that shows the Buy and Sell volume in percent. The Buy and Sell Power indicator for MetaTrader 5 calculates and displays estimated buy/sell volume percentages over a user-defined period (default: 14 bars) using tick volume data. It overlays text labels on the chart showing Buy % (with "Up" if >51%), Sell % (with "Dn" if >51%), and a trend signal based on thresholds: Neutral (<55%), Trend: Buy/Sell (55%+), Trend: Strong Buy/Sell (62%+), Trend Max UP/Down (65%+), or Trend change s
FREE

Benefits and Usage of the Volume Bubble Tool This tool, (one of my favorites by Algo Alpha, from Tradingview) provides an advanced method of volume analysis by moving beyond traditional histograms. It leverages statistical normalization (Z-score) on lower-timeframe data to identify and classify statistically significant volume events, visualizing the dynamic between "Smart Money" (institutional) and "Retail" participants. Core Benefits Intuitive On-Chart Visualization: By plotting volume as bub

Presentazione Quantum Breakout PRO , l'innovativo indicatore MQL5 che sta trasformando il modo in cui scambi le zone di breakout! Sviluppato da un team di trader esperti con un'esperienza di trading di oltre 13 anni, Quantum Breakout PRO è progettato per spingere il tuo viaggio di trading a nuovi livelli con la sua strategia innovativa e dinamica della zona di breakout.
Quantum Breakout Indicator ti fornirà frecce di segnalazione sulle zone di breakout con 5 zone target di

After working during many months, with the help of Neural Networks, we have perfected the ultimate tool you are going to need for identifying key price levels (Supports and Resistances) and Supply and Demand zones. Perfectly suitable to trigger your trades, set up your future actions, decide your Take Profit and Stop Loss levels, and confirm the market direction. Price will always move between those levels, bouncing or breaking; from one zone to another, all the remaining movements are just mark

Royal Scalping Indicator is an advanced price adaptive indicator designed to generate high-quality trading signals. Built-in multi-timeframe and multi-currency capabilities make it even more powerful to have configurations based on different symbols and timeframes. This indicator is perfect for scalp trades as well as swing trades. Royal Scalping is not just an indicator, but a trading strategy itself. Features Price Adaptive Trend Detector Algorithm Multi-Timeframe and Multi-Currency Trend Low

Phoenix Auto Fibonacci Monitor (MT5)
Strumento professionale di analisi swing e Fibonacci per MetaTrader 5. Rileva automaticamente le oscillazioni dominanti del mercato e fornisce informazioni avanzate sul ritracciamento di Fibonacci attraverso un dashboard visivo in tempo reale.
Panoramica
Phoenix Auto Fibonacci Monitor identifica automaticamente le principali oscillazioni di mercato utilizzando il pivot a intervalli di tempo più elevati e la convalida ATR, quindi traccia livelli di ritracci
FREE
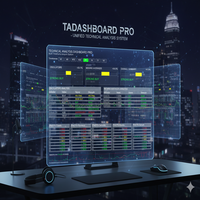
Technical Analysis Dashboard Pro (TADashboard Pro) – Sistema Unificato di Analisi Tecnica TADashboard Pro è un pannello di analisi tecnica avanzato che consolida più indicatori e timeframe in un'unica interfaccia visiva. Progettato per i trader che richiedono precisione ed efficienza , il sistema analizza simultaneamente 7 oscillatori e 4 medie mobili su 8 timeframe differenti , generando punteggi normalizzati che semplificano il processo decisionale. Caratteristiche Principali: Analisi Multi-Ti
FREE
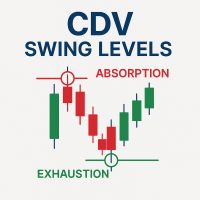
Cumulative Delta Volume (CDV) Swing Level - Absorption & Exhaustion Detector
Full Documentation: [ Download PDF ] CDV Swing Aggressive Score Guide : [ Download PDF ] Free Professional Education Course: After purchasing, contact me to receive access to the complete CDV Professional Training Video Course.
Professional CDV Analysis for Market Reversals This indicator identifies CDV absorption and exhaustion patterns to detect precise market turning points. It analyzes cumulative delta vo
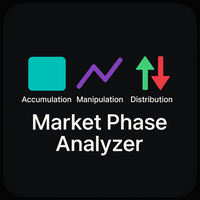
Descrizione generale
Indicatori chiari e regole semplici per leggere le tre fasi chiave del mercato. Questo indicatore identifica in tempo reale una fase di accumulazione basata sulla sessione asiatica, rileva eventuali sweep di liquidità durante la manipolazione e conferma la fase direzionale nella distribuzione. Mostra frecce verdi per la fase rialzista e rosse per la fase ribassista, disegna la Asia box con colore e bordo personalizzabili e opzionalmente la linea di apertura giornaliera per
FREE

The trend is your friend!
Look at the color of the indicator and trade on that direction. It does not repaint. After each candle is closed, that's the color of the trend. You can focus on shorter faster trends or major trends, just test what's most suitable for the symbol and timeframe you trade. Simply change the "Length" parameter and the indicator will automatically adapt. You can also change the color, thickness and style of the lines. Download and give it a try! There are big movements w
ICONIC SMC Indicator — Trade with Institutional Clarity Finally, objective SMC—without the manual grind. Tired of spending hours marking charts only to miss the entry by a few pips? Doubting your read when real money is on the line? The era of subjective, time-consuming SMC is over. The ICONIC SMC Indicator is not “another tool.” It’s an institutional-grade analysis engine that automates the full Smart Money Concepts workflow and turns your chart into a live dashboard of high-probability opport
FREE

Descrizione per MQL5 Market Opening‑Range Sessions (GMT‑Aware) è un indicatore leggero che disegna in tempo reale l’opening‑range (high, low e box colorato) delle principali finestre di mercato – Sydney, Tokyo, London, New York – con rilevazione automatica del fuso orario del server. Ideale per breakout, mean‑reversion e analisi di volatilità su qualunque strumento e timeframe. Caratteristiche principali Auto‑Time‑Zone – il calcolo usa l’offset del server, perciò gli orari delle sessioni risulta
FREE
Day Direction Scanner è un indicatore che utilizza la direzione della candela corrente nei periodi di 1 giorno, 4 ore, 1 ora, 15 minuti e 5 minuti per determinare la direzione del mercato. Quando tutte le candele convergono in un'unica direzione, l'indicatore indica se la giornata è rialzista o ribassista, o se non c'è una direzione chiara. È utile per farsi un'idea della direzione del mercato durante la giornata.
Caratteristiche:
- Funziona su tutte le coppie di valute, indici e materie pri
FREE
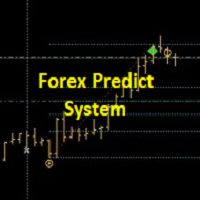
+++++++++++++++++++++++++++++++++++++++++++++++++++++++++++++++++++++++++++++++++++++++++++++++++ +++ Link to EURUSD Only Free Version --> https://www.mql5.com/en/market/product/156904?source=Unknown +++++++++++++++++++++++++++++++++++++++++++++++++++++++++++++++++++++++++++++++++++++++++++++++++ Hallo Trader, This is a traditional GANN & FIBONACCI strategy based on detection of an impulsive move in the opposite direction. This is called a Breakout. At the moment of Breakout, the indicator draw
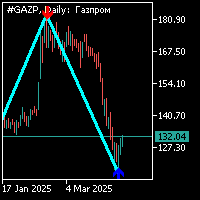
L'indicatore zig-zag è standard con un periodo di 34 con un segnale aggiuntivo a forma di freccia. Il segnale aggiuntivo viene calcolato separatamente dall'indicatore zig-zag.Il lavoro su questo indicatore è il seguente: 1. quando si forma un segmento dell'indicatore zig-zag e la comparsa di un segnale aggiuntivo sotto forma di una freccia, è necessario aprire la posizione verso la direzione della freccia; 2. quando si forma un altro braccio dell'indicatore zig-zag nella direzione opposta del s

Ritz Smart Detection BUY & SELL
The Ritz Smart Detection BUY & SELL is a next-generation trading indicator engineered to detect high-probability entry signals by combining ATR-based volatility measurement , trend reversal detection , and smart alerting technology . It delivers real-time BUY/SELL opportunities with adaptive targets and risk levels, making it a versatile tool for both scalpers and swing traders. Core Market Logic ATR-Driven Volatility Analysis Uses multiple ATR methods (SMA, EMA,
FREE

Introducing the MACD Enhanced – an advanced MACD (Moving Average Convergence Divergence) indicator that provides traders with extended capabilities for trend and momentum analysis in financial markets. The indicator uses the difference between the fast and slow exponential moving averages to determine momentum, direction, and strength of the trend, creating clear visual signals for potential entry and exit points. Attention! To achieve the best results, it is recommended to adapt the indicator
FREE

Haven Bands Reversion – Un indicatore professionale per il trading di ritorno alla media Presentiamo Haven Bands Reversion – uno strumento potente e preciso, creato per i trader che utilizzano strategie di ritorno alla media. A differenza delle classiche Bande di Bollinger, questo indicatore si basa sulla Media Mobile Ponderata per il Volume (VWMA) , il che rende i suoi canali più sensibili alla reale attività di mercato. L'aspetto più importante è che l'indicatore genera segnali che non vengono

Place price Alerts on extended Rectangles and Trendlines - Risk reward indicator MT5 Extend Rectangles & Trendlines to the right edge Mark your supply demand zones with extended rectangle and draw support resistance lines with extended trendline. Find detailed manuals here . Find contacts on my profile . MT4 Rectangle extender indicator will simplify and make it easier for you to analyze markets and stay notified about important events. When you extend rectangle or trendline the action butt
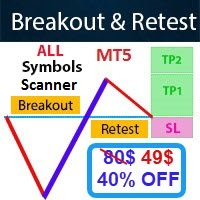
- Real price is 80$ - 40% Discount (It is 49$ now) Contact me for instruction, any questions! - Non-repaint - I just sell my products in Elif Kaya Profile, any other websites are stolen old versions, So no any new updates or support. - Lifetime update free Related product: Bitcoin Expert Introduction The Breakout and Retest strategy is traded support and resistance levels. it involves price breaking through a previous level. The break and retest strategy is designed to help traders do two main

The Volume Profile Fixed Range indicator is a powerful tool designed for MetaTrader 5 (MT5) platforms. It visualizes the distribution of trading volume over a fixed historical range of bars, helping traders identify key price levels where significant volume has accumulated. This aids in spotting support/resistance zones, value areas, and potential reversal or breakout points. Below is a detailed description of its features:
Key Features: - Fixed Range Analysis: Analyzes volume profile based on
FREE

Price Path Zone is a professional signal indicator for MT5, designed to visualize high-probability market movement areas. By identifying critical price action zones, it projects a "Price Path" box where the market is expected to flow, providing traders with clear, actionable trade setups. Core Functionality The indicator scans the market for price exhaustion and reversal patterns based on a customizable Analysis Period . When a potential reversal is detected at a local high or low, it generates
FREE

Special offer : ALL TOOLS , just $35 each! New tools will be $30 for the first week or the first 3 purchases ! Trading Tools Channel on MQL5 : Join my MQL5 channel to update the latest news from me Volumatic VIDYA (Variable Index Dynamic Average) è un indicatore avanzato progettato per monitorare le tendenze e analizzare la pressione di acquisto e vendita in ogni fase di una tendenza. Utilizzando il Variable Index Dynamic Average come tecnica principale di smorzamento dinamico, que

Discover the power of harmony in the markets with this advanced harmonic pattern indicator. Designed for demanding technical traders, this indicator automatically detects 11 of the most popular harmonic patterns, including the Gartley, Bat, Crab, Butterfly, Shark, Cypher, and many more.
Thanks to its dynamic dashboard, you can easily manage the visibility of patterns on the chart, activating or deactivating the ones you want in real time without overloading your platform. This flexibility allo
FREE

A scalping indicator based on mathematical patterns, which on average gives signals with relatively small SL, and also occasionally helps to catch big moves in the markets (more information in the video)
This indicator has three main types of notifications: The first type warns of a possible/upcoming signal on the next bar The second type indicates the presence of a ready signal to enter the market/open a position The third type is for SL and TP levels - you will be notified every time price re

Pips Hunter PRO è stato sviluppato nel corso di diversi anni ed è una versione migliorata del suo predecessore. Questo potente indicatore analizza il mercato e la storia dei prezzi per generare entrate in acquisto e in vendita. Per il calcolo di queste entrate utilizza diversi indicatori che lavorano insieme, nonché un complesso logaritmo statistico che filtra le entrate meno favorevoli e le elimina / versione MT4 .
Caratteristiche Nessuna riverniciatura
Questo indicatore non cambia i suo
FREE

L'indicatore "Heikin Ashi" è stato progettato per migliorare l'analisi dei grafici finanziari con un sistema di candele Heikin Ashi. Le candele Heikin Ashi sono un metodo avanzato per visualizzare il prezzo, che aiuta a filtrare il rumore del mercato, rendendo più chiara l'interpretazione dei trend e migliorando la qualità delle decisioni di trading. Questo indicatore consente di visualizzare le candele Heikin Ashi al posto delle candele giapponesi tradizionali, rendendo l'analisi grafica più pu
FREE

BUY INDICATOR AND GET NEW EXCLUSIVE EA FOR FREE AS A BONUS! ITALO ARROWS INDICATOR is the best reversal indicator ever created, and why is that? Using extreme reversal zones on the market to show the arrows and Fibonacci numbers for the Take Profit, also with a panel showing all the information about the signals on the chart, the Indicator works on all time-frames and assets, indicator built after 8 years of experience on forex and many other markets. You know many reversal indicators around t

Smart Market Structure Simple is a powerful indicator that helps traders identify market structure based on the Smart Money Concept (SMC) . This indicator automatically detects Break of Structure (BOS), Change of Character (CHoCH), Fair Value Gaps (FVG), Order Blocks (OB), Liquidity Zones (LQZ), and key swing points Higher High (HH), Higher Low (HL), Lower High (LH), Lower Low (LL) . Main Objective: Assist traders in tracking institutional flow ( Smart Money ) and finding high-probability trade
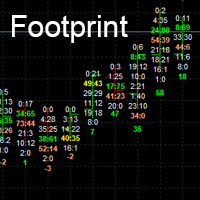
Footprint charts can add a level of depth to your visuals that standard charts cannot achieve.
Footprint charts are a powerful way to visualize the ups and downs of the market, helping you potentially to make better trading decisions. Orderflow Footprint in MT5. show # of market orders at each tick.
Inputs
Point Scale *1 to *10000
Number of candle to show. Font Size Max Bid Color (Top Seller) Max Ask Color (Top Buyer) Max Bid and Ask Color
Normal color

Capture every opportunity: your go-to indicator for profitable trend trading Trend Trading is an indicator designed to profit as much as possible from trends taking place in the market, by timing pullbacks and breakouts. It finds trading opportunities by analyzing what the price is doing during established trends. [ Installation Guide | Update Guide | Troubleshooting | FAQ | All Products ]
Trade financial markets with confidence and efficiency Profit from established trends without getting whip

For those who struggle with overbloated Volume Profile/Market Profile indicators, here is a solution that contains only the Point of Control (POC) information. Super-fast and reliable, the Mini POC indicator presents this vital information visually within your chart. Totally customizable in splittable timeframes, type of Volume, calculation method, and how many days back you need.
SETTINGS Timeframe to split the POCs within the day. Volume type to use: Ticks or Real Volume. Calculation method .
FREE
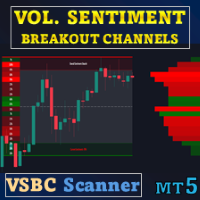
Offerta speciale : ALL TOOLS , solo $35 ciascuno. I nuovi strumenti saranno a $30 per la prima settimana oppure per i primi 3 acquisti ! Trading Tools Channel on MQL5 : unisciti al mio canale MQL5 per ricevere tutti i miei aggiornamenti Volume Sentiment Breakout Channels è un indicatore che visualizza le zone di breakout basate sul sentiment del volume all’interno di canali di prezzo dinamici. Invece di considerare il breakout come un semplice evento tecnico di prezzo, si concent

[ How to use the Demo version ] [ MT4 Version ] AO unpaid divergences MT5 AO unpaid divergences is the first indicator developed to detailed analyze Regular and Hidden Divergences. It uses this analysis to find out possible entry points and targets. Below some of the characteristics of this indicator: Time saving Highly customizable Working for all pairs (Crypto, Forex, Stocks, Indices, Commodities...) Suitable for Scalping or Swing trading Possible reversal swings Alerts and Notifications on M
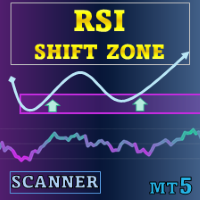
Offerta speciale : ALL TOOLS , solo $35 ciascuno! Nuovi strumenti saranno a $30 per la prima settimana o per i primi 3 acquisti ! Trading Tools Channel on MQL5 : unisciti per ricevere le ultime novità RSI Shift Zone Scanner individua i momenti in cui il sentiment di mercato può cambiare collegando i segnali RSI all’azione del prezzo. Ogni volta che l’RSI supera o scende sotto i livelli predefiniti (70 per ipercomprato, 30 per ipervenduto), l’indicatore traccia un canale sul grafico

Rilevatore di supporto e resistenza Phoenix (MT5)
Strumento professionale per il rilevamento di supporto e resistenza per MetaTrader 5. Rileva automaticamente i livelli di S&R più forti da un intervallo di tempo superiore e visualizza un'analisi completa della forza attraverso un pannello di controllo visivo.
Panoramica
Il rilevatore di supporto e resistenza Phoenix identifica i tre livelli di supporto e resistenza più forti utilizzando l'analisi pivot su un intervallo di tempo superiore (H4
FREE

Price Volume Distribution
Indicatore Volume Profile che analizza la distribuzione del volume di trading per livello di prezzo. Visualizza POC, Value Area, picchi di volume e filtraggio segnali basato su zone per MT5.
Panoramica
Price Volume Distribution e un indicatore di analisi del volume per MetaTrader 5. Calcola e visualizza la distribuzione del volume sui livelli di prezzo utilizzando dati del timeframe M1, fornendo rappresentazione visiva tramite barre istogramma e linee di riferimento.

If you like this free tool, check out my EA which is currently on a Launch Sale for only $39 ! https://www.mql5.com/zh/market/product/159451?source=Site Short Description: A specialized technical indicator designed for Gold (XAUUSD) trading. It automatically identifies market swings, plots key 0.382 and 0.618 Fibonacci retracement levels, and sen mobile push nothiations not sat 面紙 面 面 面面 筆/內托are detected. 【Key Features】 Dual Monitoring Mode: Simultaneously tracks the 0.382 (Shallow Retracement)
FREE

This indicator plots the volume profile by Price on the chart
There are 5 ways to view it:
By Total Volume Traded (Premium Version); Volume Ticks(Forex) Separated by Buyers and Sellers (Premium Version); Buyers Only (Premium Version); Sellers Only (Premium Version); Business balance (Buyers - Sellers) (Premium Version); .
It is possible to select how many days the profiles will be calculated.( Premium Version)
On the current day it recalculates the histogram data for each new candlestick.
FREE

Daily VWAP Indicator (Volume Weighted Average Price) Special Deal! Leave a review and get the indicator Long & Short Cointegration Analyzer for free — just send me a message!
Description The Daily VWAP (Volume Weighted Average Price) indicator is an essential tool for traders seeking to identify the true average price of an asset throughout the day, adjusted by traded volume. Primarily used by institutional and professional traders, the daily VWAP serves as a reference point to identify the av
FREE

XAUUSD Heat Map Scalping Indicator Perfect for 1M, 3M, 5M, 15M Scalping on Gold (XAUUSD) Take your scalping to the next level with this exclusive Heat Map indicator , designed and optimized specifically for XAUUSD . This tool is a powerful visual assistant that helps you instantly identify market strength, pressure zones, and potential entry points in real time. Key Features: Optimized for Fast Scalping : Works best on 1-minute, 3-minute, 5-minute, and 15-minute timeframes Specializ

Questa è la tua occasione per smettere di indovinare e capire la tua strategia. 281 operazioni monitorate | 64% di tasso di vincita | 70% di rischio/rendimento nei dati storici Questi non sono solo numeri — sono statistiche reali che ti mostrano come funziona questa strategia. Se stai cercando un modo per fare trading in modo più intelligente, questo è lo strumento che può portarti lì. Ti è piaciuto vedere la realtà della strategia engulfing? Dopo l’acquisto, contattaci e ti forniremo gratuitame

Spline Searcher MT5 — Indicatore multi-valuta per il rilevamento precoce di spline di prezzo e punti di interesse Strumento ausiliario per il rilevamento e la visualizzazione automatici delle fasi iniziali di formazioni complesse di prezzo. L’indicatore è destinato esclusivamente al trading manuale ed è adatto ai trader che sperimentano il rilevamento precoce di formazioni o trend di mercato più complessi, di cui possono far parte formazioni più semplici. Rileva fino a sei tipi di formazioni in
Scopri come acquistare un robot di trading dal MetaTrader Market, il negozio di applicazioni per la piattaforma MetaTrader.
Il sistema di pagamento di MQL5.community supporta le transazioni tramite PayPal, carte bancarie e gli altri sistemi di pagamento più diffusi. Per essere pienamente soddisfatto, ti consigliamo vivamente di testare il robot di trading prima di acquistarlo.
Ti stai perdendo delle opportunità di trading:
- App di trading gratuite
- Oltre 8.000 segnali per il copy trading
- Notizie economiche per esplorare i mercati finanziari
Registrazione
Accedi
Se non hai un account, registrati
Consenti l'uso dei cookie per accedere al sito MQL5.com.
Abilita le impostazioni necessarie nel browser, altrimenti non sarà possibile accedere.