Conheça o Mercado MQL5 no YouTube, assista aos vídeos tutoriais
Como comprar um robô de negociação ou indicador?
Execute seu EA na
hospedagem virtual
hospedagem virtual
Teste indicadores/robôs de negociação antes de comprá-los
Quer ganhar dinheiro no Mercado?
Como apresentar um produto para o consumidor final?
Indicadores Técnicos para MetaTrader 5 - 6
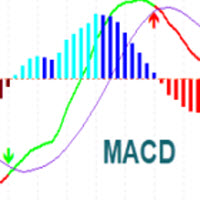
MACD Indicator It has MACD line, Signal line, and Histogram. The Histogram has 4 colors based on Direction Above and Below the Zero Line, showing its movement direction as simple as possible. Allows Show MACD & Signal Line, Show Change In color of MACD Line based on cross of Signal Line. Show Dots at Cross of MacD and Signal Line, Turn on and off Histogram. Enjoy your trading experience, and feel free to share your comments and reviews.
If you are interested in this indicator, you might be i
FREE

Apresentando o Quantum Heiken Ashi PRO Projetadas para fornecer informações claras sobre as tendências do mercado, as velas Heiken Ashi são conhecidas por sua capacidade de filtrar o ruído e eliminar sinais falsos. Diga adeus às confusas flutuações de preços e olá para uma representação gráfica mais suave e confiável. O que torna o Quantum Heiken Ashi PRO verdadeiramente único é sua fórmula inovadora, que transforma os dados tradicionais de velas em barras coloridas fáceis de ler. As barras ve

VM Heiken Ashi Pro
Heiken-Ashi suavizado (HMA ou EMA) para filtrar ruído e gerar sinais claros de BUY/SELL, sem repintura (opcional ConfirmOnClosedBar). Exibe velas HA no gráfico (as velas originais podem ser ocultadas), posicionamento de setas por ATR ou deslocamento fixo, envia alertas (popup, email, push) com tratamento anti-spam. Objetivo principal
Converter velas brutas em Heiken-Ashi suavizadas para detectar mudanças de cor (bear para bull / bull para bear) e desenhar setas para entrada

Candle Time CountDown By BokaroTraderFx The Candle Timer Countdown Indicator is a versatile tool designed for the MetaTrader 5 (MT5) trading platform. It provides traders with a visual countdown of the remaining time for the current candle on a chart. The key features include:
Customizable Position: Place the countdown timer in any corner of the chart for optimal visibility. Default Text Color: Set to red for clear visibility, with options for further customization. Minimal Display: Shows only
FREE

Dark Breakout is an Indicator for intraday trading. This Indicator is based on Trend Following strategy, providing an entry signal on the breakout. The signal is provided by the arrow, which confirms the breaking of the level. We can enter in good price with this Indicator, in order to follow the main trend on the current instrument. It is advised to use low spread ECN brokers. This Indicator does Not repaint and N ot lag . Recommended timeframes are M5, M15 and H1. Recommended working pairs
Candle Timer Countdown v2.5 is an advanced MQL5 indicator designed to enhance your trading precision. It provides a live countdown for each candle while simultaneously analyzing multiple timeframes to detect trend direction and potential early reversals. Key features include: Candle Countdown & Progress Bar: Monitor the exact time remaining for each candle with a clear progress visualization. Advanced Trend Detection: Analyze both fast and slow trends with configurable sensitivity and multi-time
FREE

The Breakout Finder (BF) is a powerful MetaTrader 5 indicator designed to detect potential breakout and breakdown opportunities in price action. By analyzing pivot highs and lows over a user-defined period, it identifies consolidation zones where price has repeatedly tested resistance or support levels within a narrow channel. When price breaks out of these zones with sufficient confirmation (based on the minimum number of tests and channel width threshold), the indicator visually highlights th
FREE

Se você gosta deste projeto, deixe uma revisão de 5 estrelas. Este indicador desenha os preços abertos, altos, baixos e finais para o
especificado
período e pode ser ajustado para um fuso horário específico. Estes são níveis importantes olhados por muitos institucional e profissional
comerciantes e pode ser útil para você saber os lugares onde eles podem ser mais
activa. Os períodos disponíveis são: Dia anterior. Semana anterior. Mês anterior. Quarto anterior. Ano anterior. Ou: Dia atual. Seman
FREE

Bem-vindo ao Indicador EPo-CreW Forex Super ORB-H4!
Este guia irá ensiná-lo a utilizar esta poderosa ferramenta para identificar oportunidades de trading de alta probabilidade, com base no primeiro intervalo de abertura de 4 horas do mercado.
Quer você seja iniciante ou trader experiente, este sistema ajudará você a operar com mais confiança e consistência. ESTE É UM PRODUTO DEMO. ELE EXPIRARÁ 30 DIAS APÓS A DATA DE INSTALAÇÃO. Versão completa disponível aqui: https://www.mql5.com/en/market/prod
FREE

Bem-vindo ao nosso Padrão de onda de preços MT5 --(Padrão ABCD)-- O padrão ABCD é um padrão de negociação poderoso e amplamente utilizado no mundo da análise técnica.
É um padrão de preço harmônico que os traders usam para identificar oportunidades potenciais de compra e venda no mercado.
Com o padrão ABCD, os traders podem antecipar possíveis movimentos de preços e tomar decisões informadas sobre quando entrar e sair das negociações. Versão EA: Price Wave EA MT5
Versão MT4: Price Wav
FREE
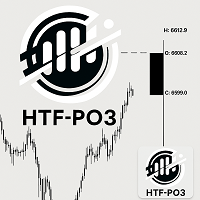
HTF Power of Three (ICT) - MT5 Indicator - Version 1.1 Overview The HTF Power of Three indicator is a professional implementation of the Inner Circle Trader's (ICT) Power of Three concept, inspired by Larry Williams. This indicator visualizes higher timeframe (HTF) candle development in real-time on any lower timeframe chart, making it an essential tool for ICT traders who study institutional price movement patterns. What is Power of Three (PO3)? Power of Three represents a three-staged Smart M

Overview The Smart Money Structure Markup Indicator for MetaTrader 5 is a powerful tool designed to help traders identify key market structures based on popular Smart Money Concepts (SMC) strategies. This indicator detects micro-market structures, providing insights into price movements and potential trend changes. It highlights important elements such as valid Break of Structure (BOS), Change of Character (CHoCH), and Inducement (IDM), helping traders to make informed decisions. Key Features Ma
FREE

Ultimate SMC: Professional Smart Money Concepts Indicator Unlock the hidden movements of the market. Trade with the institutions, not against them. The Ultimate SMC indicator is designed for serious traders who want to apply Smart Money Concepts (SMC) to their charts automatically. Manual SMC analysis is time-consuming and prone to subjective error. This tool removes the guesswork by algorithmically detecting Order Blocks, Fair Value Gaps, and Structural breaks in real-time. Whether you are a s
FREE

non-repaint free MT5 technical indicator works on all timeframes 1 minute to the monthly timeframe the trade vision buy and sell arrow is a multi currency and synthetic indicator Trade vision buy and sell arrow comes with Push Alerts purple arrow look for selling opportunities white arrow look for buying opportunities. wait for candle to close and arrow to appear before taking any trades.
FREE

This indicator has been developed to identify and display these trends quickly and easily, allowing you to see instantly, those currency pairs which are trending, and those which are not – and in all timeframes, with just one click. The 28 currency pairs are displayed as a fan as they sweep from strong to weak and back again, and this is why we call it the ‘currency array’. All 28 pairs are arrayed before you, giving an instant visual description of those pairs that are trending strongly, those

O Pips Hunter PRO foi desenvolvido ao longo de vários anos e é uma versão melhorada do seu antecessor. Este poderoso indicador analisa o mercado e o histórico de preços para gerar entradas de compra e venda. Para o cálculo destas entradas, utiliza diferentes indicadores que funcionam em conjunto, bem como um logaritmo estatístico complexo que filtra as entradas menos favoráveis e as elimina / versão MT4 .
Características Sem repintura
Este indicador não altera os seus valores quando che
FREE

ZenTrend — Adaptive Trend Indicator for MetaTrader 5 ZenTrend is an innovative trend indicator for MetaTrader 5 that plots a flexible and informative trend line on the chart, based on adaptive moving average calculations. This tool is ideal for traders seeking precise and timely identification of trend direction on any financial market: forex, stocks, indices, cryptocurrencies, and commodities. Key Features of ZenTrend 1. Four Types of Moving Averages Supported
ZenTrend allows you to choose fro
LEVEL 3 POWER INDICATOR
The Professional’s Timing Masterpiece
Stop guessing market turns. Start seeing them before they happen.
---
Are You Missing Out on Big Moves?
Entering trades just before the market reverses?
Unsure whether a trend is truly over—or simply pausing?
Struggling with confidence when holding trades?
You’re not alone. Most traders wrestle with these exact challenges… until they discover the Level 3 Power Indicator.
---
The Game-Changing “Traffic Light” Syst
FREE

** All Symbols x All Timeframes scan just by pressing scanner button ** Discount: The price is $50$, But now it is just $39, Limited time offer is active.
*** Contact me to send you instruction and add you in "Trend Reversal group" for sharing or seeing experiences with other users. Introduction: Trendlines are the most famous technical analysis in trading . Trendlines continually form on the charts of markets across all the different timeframes providing huge opportunities for traders

Por que a maioria dos indicadores de divergência RSI apresenta atraso ou repintura Se você já testou indicadores de divergência suficientes, provavelmente encontrou um destes dois problemas: ou a divergência aparece muito tarde,
ou o sinal de divergência simplesmente desaparece. Isso não acontece porque o indicador é “mal programado”.
A razão está na própria lógica do cálculo da divergência — existe um compromisso inevitável. Se você quer sinais imediatos, quase sempre terá que aceitar repintura
FREE
Descrição geral
Sinais claros e regras simples para identificar as três fases-chave do mercado. Este indicador detecta em tempo real uma fase de acumulação baseada na sessão asiática, identifica possíveis varridas de liquidez durante a fase de manipulação e confirma a fase direcional na distribuição. Mostra setas verdes para a fase de alta e vermelhas para a fase de baixa, desenha a caixa asiática com cor e borda personalizáveis e, opcionalmente, a linha de abertura diária para um contexto intr
FREE

Opening‑Range Sessions (GMT‑Aware) é um indicador leve que desenha automaticamente o intervalo de abertura — máxima, mínima e um retângulo colorido — para as principais janelas de liquidez do Forex: Sydney, Tóquio, Londres e Nova Iorque . O indicador detecta o fuso horário do servidor do seu broker, garantindo que cada sessão comece no horário local correto, independentemente de onde estejam o servidor ou o trader. Principais recursos Detecção automática de fuso horário – utiliza o desvio GMT do
FREE

Necessary for traders: tools and indicators Waves automatically calculate indicators, channel trend trading Perfect trend-wave automatic calculation channel calculation , MT4 Perfect trend-wave automatic calculation channel calculation , MT5 Local Trading copying Easy And Fast Copy , MT4 Easy And Fast Copy , MT5 Local Trading copying For DEMO Easy And Fast Copy , MT4 DEMO Easy And Fast Copy , MT5
DEMO
砖图 Renko PRO->>>
The display of the brick map on the main map.
The Renko chart ideally r
FREE

Ferramenta de Análise de Tendência Multi-Temporal Quer acompanhar tendências em múltiplos timeframes sem trocar de gráficos constantemente? Smart Trend Consensus MT5 é uma ferramenta de análise técnica que consolida dados de 7 timeframes simultaneamente (M1, M5, M15, M30, H1, H4, D1). O indicador usa 7 critérios técnicos para avaliar o estado da tendência em cada timeframe e exibe todas as informações em um painel visual. Uma ferramenta de análise multidimensional que ajuda traders a e

This indicator provides the ability to recognize the SMC pattern, essentially a condensed version of the Wyckoff model. Once the pattern is confirmed by RTO, it represents a significant investment opportunity. There are numerous indicators related to SMC beyond the market, but this is the first indicator to leverage patterns to identify specific actions of BigBoy to navigate the market. The SMC (Smart Money Concept) pattern is a market analysis method used to understand the behavior of "smart

Detailed Description:
The Pivot Points Indicator is designed for traders who rely on pivot points, midpoints and support/resistance levels for their trading strategies. By automatically calculating and plotting these levels (based on the previous period's high, low, and close prices) , the indicator provides a clear, visual representation of critical price areas where the market may reverse or break out.The tool is particularly useful for day traders and swing traders looking to base th
FREE

Synthetic Trend AI — um indicador de tendência inteligente com tecnologia de inteligência artificial
O indicador Synthetic Trend AI é uma poderosa ferramenta de análise técnica que combina a fórmula clássica do SuperTrend com algoritmos de inteligência artificial (k-Nearest Neighbors, KNN) e análise de volume. Ele foi desenvolvido para quem deseja analisar o mercado com mais profundidade e tomar decisões mais seguras.
O que torna o Synthetic Trend AI único: Previsão de tendências por IA: Util
FREE

Dark Oscillator is an Indicator for intraday trading. This Indicator is based on Counter Trend strategy, trying to intercept changes in direction, in advance compared trend following indicators. We can enter in good price with this Indicator, in order to follow the inversion of the trend on the current instrument. It is advised to use low spread ECN brokers. This Indicator does Not repaint and N ot lag . Recommended timeframes are M5, M15 and H1. Recommended working pairs: All. I nst

For those who struggle with overbloated Volume Profile/Market Profile indicators, here is a solution that contains only the Point of Control (POC) information. Super-fast and reliable, the Mini POC indicator presents this vital information visually within your chart. Totally customizable in splittable timeframes, type of Volume, calculation method, and how many days back you need.
SETTINGS Timeframe to split the POCs within the day. Volume type to use: Ticks or Real Volume. Calculation method .
FREE

Apresentando Quantum Breakout PRO , o inovador Indicador MQL5 que está transformando a maneira como você negocia Breakout Zones! Desenvolvido por uma equipe de traders experientes com experiência comercial de mais de 13 anos, Quantum Breakout PRO foi projetado para impulsionar sua jornada comercial a novos patamares com sua estratégia de zona de fuga inovadora e dinâmica.
O Quantum Breakout Indicator lhe dará setas de sinal em zonas de breakout com 5 zonas-alvo de lucro e su
Exibe AUTOMATICAMENTE os NÍVEIS DE VARIAÇÃO percentual do dia sob a forma de SUPORTES E RESISTÊNCIAS — este é o indicador 2MV Frequências Full. Identifique zonas de suporte e resistência rapidamente atraves dos níveis percentuais (ex.: 0,50%, 1%, 1,50%) - personalizáveis que antecipam reversões, rompimentos e áreas de congestão com precisão e clareza visual, baseado na metodologia exclusiva de Evandro Soares. Identifique zonas de suporte e resistência rapidamente.
Antecipe rever

VWAP, ou preço médio ponderado por volume, auxilia os traders e investidores a observar o preço médio que grandes operadores consideram como o "preço justo" para aquele movimento. A VWAP é utilizada por muitas instituições para montar grandes operações.
Neste indicador, você poderá usufruir das seguintes funcionalidades:
VWAP Diária, com opção de apresentar o seu preço atual ao lado do gráfico VWAP Semanal, com opção de apresentar o seu preço atual ao lado do gráfico VWAP Mensal, com opção de
FREE

A tendência é sua amiga!
Veja a cor do indicador e faça suas operações nessa direção. Ele não repinta. Ou seja, depois que cada candle se fecha, a cor dele é definitiva e não irá se alterar. Você pode focar em movimentos mais curtos e rápidos ou tendências mais longas, basta testar o que melhor se encaixa no seu operacional de acordo com o ativo e tempo gráfico usado. Altere o parâmetro de entrada "Length" e o indicador irá se adaptar automaticamente (quanto maior ele for, maior a tendência an

Royal Scalping Indicator is an advanced price adaptive indicator designed to generate high-quality trading signals. Built-in multi-timeframe and multi-currency capabilities make it even more powerful to have configurations based on different symbols and timeframes. This indicator is perfect for scalp trades as well as swing trades. Royal Scalping is not just an indicator, but a trading strategy itself. Features Price Adaptive Trend Detector Algorithm Multi-Timeframe and Multi-Currency Trend Low
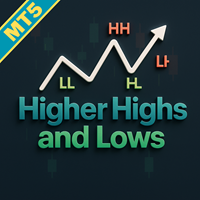
Melhore o seu trading de ação de preço com o indicador Higher Highs and Lows MT5, uma ferramenta robusta que utiliza análise fractal para identificar pontos de swing chave e padrões que definem tendências como Higher Highs (HH), Lower Highs (LH), Lower Lows (LL) e Higher Lows (HL) para insights claros sobre a direção do mercado. Baseado em princípios fundamentais de ação de preço enraizados na Teoria de Dow do início do século XX e popularizados no trading moderno por especialistas como Al Broo
FREE
ICONIC SMC Indicator — Trade with Institutional Clarity Finally, objective SMC—without the manual grind. Tired of spending hours marking charts only to miss the entry by a few pips? Doubting your read when real money is on the line? The era of subjective, time-consuming SMC is over. The ICONIC SMC Indicator is not “another tool.” It’s an institutional-grade analysis engine that automates the full Smart Money Concepts workflow and turns your chart into a live dashboard of high-probability opport
FREE

YOU CAN NOW DOWNLOAD FREE VERSIONS OF OUR PAID INDICATORS . IT'S OUR WAY OF GIVING BACK TO THE COMMUNITY ! >>> GO HERE TO DOWNLOAD
This system is an Heiken Ashi system based on RSI calculations . The system is a free open source script originally published on TradingView by JayRogers . We have taken the liberty of converting the pine script to Mq4 indicator . We have also added a new feature which enables to filter signals and reduces noise on the arrow signals.
Background
HEIKEN ASHI
Th
FREE
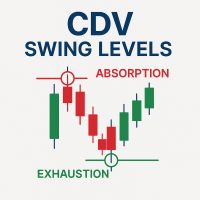
Cumulative Delta Volume (CDV) Swing Level - Absorption & Exhaustion Detector
Full Documentation: [ Download PDF ] CDV Swing Aggressive Score Guide : [ Download PDF ] Free Professional Education Course: After purchasing, contact me to receive access to the complete CDV Professional Training Video Course.
Professional CDV Analysis for Market Reversals This indicator identifies CDV absorption and exhaustion patterns to detect precise market turning points. It analyzes cumulative delta vo
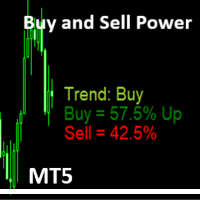
Simple Indicator that shows the Buy and Sell volume in percent. The Buy and Sell Power indicator for MetaTrader 5 calculates and displays estimated buy/sell volume percentages over a user-defined period (default: 14 bars) using tick volume data. It overlays text labels on the chart showing Buy % (with "Up" if >51%), Sell % (with "Dn" if >51%), and a trend signal based on thresholds: Neutral (<55%), Trend: Buy/Sell (55%+), Trend: Strong Buy/Sell (62%+), Trend Max UP/Down (65%+), or Trend change s
FREE

Introduction
Reversal Candles is a cutting-edge non-repainting forex indicator designed to predict price reversals with remarkable accuracy through a sophisticated combination of signals.
Signal Buy when the last closed candle has a darker color (customizable) and an up arrow is painted below it Sell when the last closed candle has a darker color (customizable) and a down arrow is painted above it
FREE
+++++++++++++++++++++++++++++++++++++++++++++++++++++++++++++++++++++++++++++++++++++++++++++++++ +++ Link to EURUSD Only Free Version --> https://www.mql5.com/en/market/product/156904?source=Unknown +++++++++++++++++++++++++++++++++++++++++++++++++++++++++++++++++++++++++++++++++++++++++++++++++ Hallo Trader, This is a traditional GANN & FIBONACCI strategy based on detection of an impulsive move in the opposite direction. This is called a Breakout. At the moment of Breakout, the indicator draw

SmartScalp M1 – Fast Scalping with Accurate Trends and Clean Signals SmartScalp M1 is a high-speed scalping indicator optimized specifically for the M1 timeframe. It combines Supertrend and Heiken Ashi to identify clear trend reversals and effectively filter market noise. BUY and SELL signals are generated when the Supertrend flips and are confirmed by Heiken Ashi candle colors, significantly reducing false signals in choppy market conditions. The indicator performs best on high-volatility ins

Haven HTF Candle — O Poder do Timeframe Superior no Seu Gráfico Apresentamos o Haven HTF Candle — uma ferramenta poderosa que exibe as velas de um timeframe superior (HTF) diretamente no seu gráfico de trabalho. Pare de alternar constantemente entre janelas e comece a ver o verdadeiro contexto do mercado, que é a base para tomar decisões de negociação bem informadas. Outros produtos -> AQUI . Principais Funcionalidades e o Conceito "Power of 3" Análise baseada no conceito "Power of 3" (AMD): O
FREE

The Volume Profile Fixed Range indicator is a powerful tool designed for MetaTrader 5 (MT5) platforms. It visualizes the distribution of trading volume over a fixed historical range of bars, helping traders identify key price levels where significant volume has accumulated. This aids in spotting support/resistance zones, value areas, and potential reversal or breakout points. Below is a detailed description of its features:
Key Features: - Fixed Range Analysis: Analyzes volume profile based on
FREE

O indicador Trend Line Map é um complemento do Trend Screener Indicator. Ele funciona como um scanner para todos os sinais gerados pelo Trend screener (Trend Line Signals).
É um Trend Line Scanner baseado no Trend Screener Indicator. Se você não tiver o Trend Screener Pro Indicator, o Trend Line Map Pro não funcionará. It's a Trend Line Scanner based on Trend Screener Indicator. If you don't have Trend Screener Pro Indicator, the Trend Line Map Pro will not work .
Acessando nosso Blog MQ

DRX Smart Risk | Planejador de Trade Profissional Pare de chutar. Comece a planejar com precisão. O cálculo manual de lotes e Risco/Retorno é lento. O DRX Smart Risk traz o fluxo de trabalho intuitivo de plataformas profissionais (como o TradingView) diretamente para o seu MetaTrader 5 – mas mais rápido e inteligente. O Problema: As linhas padrão do MT5 são difíceis de manusear e somem quando você muda o tempo gráfico. A Solução: DRX Smart Risk é uma ferramenta visual premium. Ele desenha uma ca
FREE

A top-quality implementation of the famous Super Trend indicator, which needs no introduction. It is completely loyal to the original algorithm, and implements many other useful features such as a multi-timeframe dashboard. [ Installation Guide | Update Guide | Troubleshooting | FAQ | All Products ] Easy to trade It implements alerts of all kinds It implements a multi-timeframe dashboard It is non-repainting and non-backpainting Input Parameters
ATR Period - This is the average true range peri
FREE

Haven Bands Reversion – Um indicador profissional para negociação de reversão à média Apresentamos o Haven Bands Reversion – uma ferramenta poderosa e precisa, criada para traders que utilizam estratégias de reversão à média. Diferente das Bandas de Bollinger clássicas, este indicador baseia-se na Média Móvel Ponderada pelo Volume (VWMA) , o que torna seus canais mais sensíveis à atividade real do mercado. O mais importante é que o indicador gera sinais que não repintam , fornecendo pontos de en
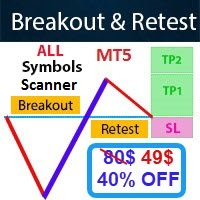
- Real price is 80$ - 40% Discount (It is 49$ now) Contact me for instruction, any questions! - Non-repaint - I just sell my products in Elif Kaya Profile, any other websites are stolen old versions, So no any new updates or support. - Lifetime update free Related product: Bitcoin Expert Introduction The Breakout and Retest strategy is traded support and resistance levels. it involves price breaking through a previous level. The break and retest strategy is designed to help traders do two main

Ritz Smart Detection BUY & SELL
The Ritz Smart Detection BUY & SELL is a next-generation trading indicator engineered to detect high-probability entry signals by combining ATR-based volatility measurement , trend reversal detection , and smart alerting technology . It delivers real-time BUY/SELL opportunities with adaptive targets and risk levels, making it a versatile tool for both scalpers and swing traders. Core Market Logic ATR-Driven Volatility Analysis Uses multiple ATR methods (SMA, EMA,
FREE

Discover the power of harmony in the markets with this advanced harmonic pattern indicator. Designed for demanding technical traders, this indicator automatically detects 11 of the most popular harmonic patterns, including the Gartley, Bat, Crab, Butterfly, Shark, Cypher, and many more.
Thanks to its dynamic dashboard, you can easily manage the visibility of patterns on the chart, activating or deactivating the ones you want in real time without overloading your platform. This flexibility allo
FREE
Indicador Trend BB MACD com Filtro ADX O Trend BB MACD com Filtro ADX é uma ferramenta técnica avançada que combina Bandas de Bollinger (BB) , MACD e o Índice de Movimento Direcional (ADX) , incorporando agora um sistema completo de análise direcional com +DI e -DI , além de opções de confirmação cruzada com o MACD. Ele foi projetado para oferecer sinais de trading precisos e filtrados, otimizados para scalping , intraday e swing trading , ajudando a identificar não apenas a direção, mas também
FREE

Linhas HiperCube AutoTrend Código de desconto de 20% na Darwinex Zero: DWZ2328770MGM_20 Este indicador ajuda-o a identificar facilmente os suportes e as resistências, a traçar linhas no gráfico e a saber onde está um ponto importante no mercado. Esta ferramenta é a melhor forma de semiautomatizar a sua negociação, fazendo parte do trabalho por si. Resistência ou Suporte são níveis importantes que por vezes são difíceis de identificar, mas agora isso não causará mais confusão
O HiperCube Autotr
FREE

Introducing the MACD Enhanced – an advanced MACD (Moving Average Convergence Divergence) indicator that provides traders with extended capabilities for trend and momentum analysis in financial markets. The indicator uses the difference between the fast and slow exponential moving averages to determine momentum, direction, and strength of the trend, creating clear visual signals for potential entry and exit points. Attention! To achieve the best results, it is recommended to adapt the indicator
FREE

RiskKILLER_AI Navigator é um Assistente de Direção de Mercado e Estratégia Multi-timeframe baseado em IA. Desempenho no trading é sobre entender o mercado como os profissionais fazem. Isso é exatamente o que o RiskKILLER_AI Navigator oferece: Ganhe insights de nível institucional com análise de tendência, sentimento e macro driven por IA externo ao MQL5 , personalizado para o seu estilo de trading. Após a compra, para obter o Manual do Usuário: 1. poste um comentário solicitando-o 2. envie-me um

If you like this free tool, check out my EA which is currently on a Launch Sale for only $39 ! https://www.mql5.com/zh/market/product/159451?source=Site Short Description: A specialized technical indicator designed for Gold (XAUUSD) trading. It automatically identifies market swings, plots key 0.382 and 0.618 Fibonacci retracement levels, and sen mobile push nothiations not sat 面紙 面 面 面面 筆/內托are detected. 【Key Features】 Dual Monitoring Mode: Simultaneously tracks the 0.382 (Shallow Retracement)
FREE

Smart Market Structure Simple is a powerful indicator that helps traders identify market structure based on the Smart Money Concept (SMC) . This indicator automatically detects Break of Structure (BOS), Change of Character (CHoCH), Fair Value Gaps (FVG), Order Blocks (OB), Liquidity Zones (LQZ), and key swing points Higher High (HH), Higher Low (HL), Lower High (LH), Lower Low (LL) . Main Objective: Assist traders in tracking institutional flow ( Smart Money ) and finding high-probability trade

O Trend Trading é um indicador projetado para lucrar o máximo possível com as tendências que ocorrem no mercado, cronometrando retrocessos e rupturas. Ele encontra oportunidades de negociação analisando o que o preço está fazendo durante as tendências estabelecidas. [ Guia de instalação | Guia de atualização | Solução de problemas | FAQ | Todos os produtos ]
Negocie mercados financeiros com confiança e eficiência Lucre com as tendências estabelecidas sem ser chicoteado Reconhecer retrocessos

Volumes with Moving Average é um indicador de volume simples e direto complementado com uma média móvel.
Como usar?
Ele é adequado para filtrar sinais ao entrar em uma operação, tanto a partir de níveis de suporte/resistência quanto em rompimentos de volatilidade de canais de tendência. Também pode ser um sinal para fechar uma posição por volume.
Parâmetros de entrada:
Volumes - volume real ou de ticks. MA_period - período da média móvel.
FREE

Lion Arrow Super Arrow Indicator for MetaTrader 5
The Lion Arrow Super Arrow Indicator for MetaTrader 5 is a hybrid trading system that integrates multiple advanced technical analysis tools to generate high-quality trading signals. By combining trend, momentum, and pressure-based indicators, it aims to reduce false signals and improve entry accuracy. Core Components of the Indicator The Lion Arrow Super Arrow indicator is built on several key analytical elements: Fast Moving Average: Reacts qui
FREE

Institutional Tick Engine Lite: Ferramenta de Velocidade de Ticks e Reversão Institutional Tick Engine Lite é um indicador técnico projetado para analisar a velocidade do mercado e a lógica da microestrutura usando dados brutos de ticks. Processa dados em tempo real para fornecer métricas para scalping e day trading. Recursos Incluídos Monitor de Velocidade de Ticks: Histograma em tempo real mostrando "Ticks Por Segundo" (TPS). Sinais de Reversão (Lite): Identifica pontos de reversão prováveis b
FREE

Price Volume Distribution
Indicador de Volume Profile que analisa a distribuicao do volume de negociacao por nivel de preco. Exibe POC, Value Area, picos de volume e filtragem de sinais baseada em zonas para MT5.
Visao Geral
Price Volume Distribution e um indicador de analise de volume para MetaTrader 5. Calcula e exibe a distribuicao do volume nos niveis de preco usando dados do timeframe M1, fornecendo representacao visual atraves de barras de histograma e linhas de referencia. Guia do usuá

Indicador VWAP Diário (Volume Weighted Average Price) Oferta Especial! Deixe uma avaliação e ganhe o indicador Long & Short Cointegration Analyzer , basta me mandar um mensagem!
Descrição O indicador VWAP Diário (Volume Weighted Average Price) é uma ferramenta essencial para traders que buscam identificar o verdadeiro preço médio de um ativo ao longo do dia, ajustado pelo volume negociado. Utilizado principalmente por traders institucionais e profissionais, o VWAP diário é um ponto de referênc
FREE

Bem-vindo ao indicador de reconhecimento avançado de padrões Gartley Este indicador detecta o padrão Gartley com base em HH e LL da estrutura de preços e nos níveis de Fibonacci, e quando certos níveis de Fibonacci são atingidos, o indicador mostrará o padrão no gráfico. Versão MT4: WH Advanced Gartley Pattern MT4 **Este indicador faz parte do combo Ultimate Harmonic Patterns MT5 , que inclui todo o reconhecimento de padrões.**
Características : Algoritmo avançado para detecção do padr
FREE

BlueBoat – Prime Cycle é um indicador técnico para MetaTrader 5 que analisa e visualiza ciclos de mercado com base no modelo de ciclos FIMATHE (Marcelo Ferreira) . O indicador identifica e marca estruturas de ciclo históricas e atuais, como CA, C1, C2, C3 , permitindo ao trader compreender a dinâmica estrutural do preço ao longo do tempo. O indicador combina análise histórica (backtest) com marcação em tempo real , oferecendo uma visão clara tanto dos ciclos passados quanto do ciclo ativo no grá
O Day Direction Scanner é um indicador que utiliza a direção do candlestick atual nos períodos de 1 dia, 4 horas, 1 hora, 15 minutos e 5 minutos para determinar a direção do mercado. Quando todos os candlesticks convergem em uma única direção, o indicador indica se o dia é de alta ou baixa, ou se não há uma direção clara. É útil para obter facilmente uma ideia da direção do mercado ao longo do dia.
Características:
- Funciona com todos os pares de moedas, índices e commodities.
- Facilita a
FREE

Esse indicador plota no gráfico o perfil de volume por Preço
Há 5 formas de visualização: Por Volume Total negociado; (Premium Version); Volume em Ticks (Forex); Separado por Compradores e Vendedores; (Premium Version); Somente Compradores; (Premium Version); Somente Vendedores e; (Premium Version); Saldo de negócios (Compradores - Vendedores). (Premium Version);
É possível selecionar quantos dias será calculado os perfis. (Premium Version);
No dia atual ele recalcula os dados do histog
FREE

A maioria dos sinais de “Divergência RSI Instantânea” está errada Se você já usou indicadores de divergência RSI, provavelmente já percebeu isso:
uma divergência aparece em tempo real, parece convincente por um momento,
e depois desaparece algumas velas mais tarde.
Quando você olha para o gráfico depois, os sinais históricos não correspondem ao que você viu originalmente. Isso não é erro do usuário.
É uma questão lógica. Divergências que não se baseiam em máximos ou mínimos confirmados são, por
FREE

TickFlow is a tool for tick-data analysis and visual highlighting of significant zones on the chart. The utility aggregates current and historical ticks, shows the buy/sell balance, and helps to identify support/resistance levels and cluster zones. This is the MetaTrader 4 version. How it works (brief) TickFlow collects tick data and aggregates it by price steps and candles. Based on the collected data the indicator builds visual layers: up/down tick counters, buy/sell ratio, historical levels
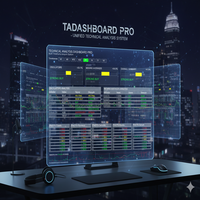
Technical Analysis Dashboard Pro (TADashboard Pro) – Sistema Unificado de Análise Técnica O TADashboard Pro é um painel avançado de análise técnica que consolida múltiplos indicadores e timeframes em uma única interface visual. Projetado para traders que exigem precisão e eficiência , o sistema analisa simultaneamente 7 osciladores e 4 médias móveis em 8 timeframes diferentes , gerando pontuações normalizadas que simplificam a tomada de decisões. Características Principais: Análise Multi-Timefra
FREE
O mercado MetaTrader é um espaço, sem precedentes, para negociar robôs e indicadores técnicos.
Leia o artigo Manual do usuário da MQL5.community para saber mais sobre os serviços exclusivos que oferecemos aos traders: cópia de sinais de negociação, aplicativos personalizados desenvolvidos por freelances, pagamentos automáticos através de sistema de pagamento e a rede em nuvem MQL5.
Você está perdendo oportunidades de negociação:
- Aplicativos de negociação gratuitos
- 8 000+ sinais para cópia
- Notícias econômicas para análise dos mercados financeiros
Registro
Login
Se você não tem uma conta, por favor registre-se
Para login e uso do site MQL5.com, você deve ativar o uso de cookies.
Ative esta opção no seu navegador, caso contrário você não poderá fazer login.