Conheça o Mercado MQL5 no YouTube, assista aos vídeos tutoriais
Como comprar um robô de negociação ou indicador?
Execute seu EA na
hospedagem virtual
hospedagem virtual
Teste indicadores/robôs de negociação antes de comprá-los
Quer ganhar dinheiro no Mercado?
Como apresentar um produto para o consumidor final?
Indicadores Técnicos para MetaTrader 5 - 13
The "Support Resistance Dynamic" indicator is a powerful technical analysis tool for the MetaTrader 5 platform, designed to automatically identify and plot dynamic Support and Resistance zones on price charts. This indicator helps traders easily recognize important price levels, potential reversal points, or breakout areas, thereby enabling more informed trading decisions. 2. Key Features Dynamic S/R Identification : Automatically identifies support and resistance zones based on an advanced Pivo
FREE

his is a custom indicator based on double-average crossing and arrow marking.
Make multiple lists when blue arrows appear up.
Make a blank list when the red arrow appears down.
When the pink line crosses the green line upwards, the pink line is above, the green line is below, the golden fork appears, and the blue arrow appears.
When the pink line crosses down through the green line, the pink line is below, the green line is above, a dead fork appears, and a red arrow appears.
This is a goo
FREE

CurvedSmoothChannel_Enhanced - Enhanced Price Channel Indicator
**CurvedSmoothChannel_Enhanced** is a powerful and visually appealing price channel indicator designed for MetaTrader 5 that helps you identify trends, potential reversals, and key price levels with precision. This enhanced version combines the power of the Hull Moving Average (HMA) and John Ehlers' Super Smooth Filter, creating a dynamic, adaptive channel that adjusts to market conditions across multiple time frames. #### Key Fea
FREE

This indicator was created as an MT5 version inspired by a TMA RSI Divergence indicator found on TradingView.
This indicator detects both Regular and Hidden divergences using RSI pivot points, similar to TradingView's pivot-based divergence logic.
-------------------------------------------------- Features -------------------------------------------------- • Regular Bullish / Bearish divergence • Hidden Bullish / Bearish divergence • Pivot-based detection (Left / Right bars) • Optional RSI SM
FREE
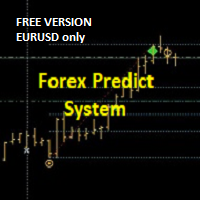
+++++++++++++++++++++++++++++
+++ FREE VERSION - EURUSD ONLY
+++++++++++++++++++++++++++++
Please add PREFIX and/or SUFFIX via settings if your Broker Chart Symbol is different (e.g. suffix = .r).
+++
This is forecast system.
On the moment of the breakout/forecast: the indicator draws retrace zone (yellow) and three targets. The levels act as support and resistance. It can be used on all pairs/indices/timeframes/periods. For the higher timeframes (H4, H1, M30) it's better to engage at Optima
FREE

This indicator calculates the volume profile and places labels that correspond to the VAH, VAL and POC levels, for each candle individually.
Indicator operation features The indicator works on the timeframes from M3 to MN, but it uses the history data of smaller periods: M1 - for periods from M3 to H1, M5 - for periods from H2 to H12, M30 - for the D1 period, H4 - for the W1 period, D1 - for the MN period. The color and location of the VAL, VAH and POC labels on the current candle are considere
FREE
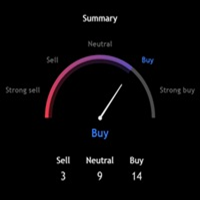
Technical Ratings for MT5 A multi-indicator analysis dashboard that displays aggregated technical signals directly on your MetaTrader 5 charts. This indicator calculates buy, sell, and neutral signals from 11 oscillators, 15 moving averages, and classic pivot points, presenting them in a single organized panel. What It Does Technical Ratings analyzes multiple technical indicators simultaneously and presents their consensus as clear trading signals. Instead of opening dozens of indicator windows

LIQUIDITY SWEEPS INDICATOR - MT5 Advanced Smart Money Concept Tool
OVERVIEW
The Liquidity Sweeps Indicator is a professional-grade MT5 tool designed to identify institutional liquidity grabs and stop-hunt patterns. Based on ICT (Inne
FREE
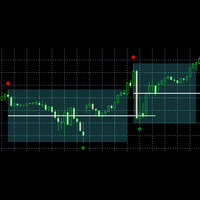
Based on concept of Zones from DTFX.
Video 2
Daves suggest using a length of 25 for optimal performance. But it's up to you to decide based on backtest/forwardtest results.
How this indicator draw zones
In bullish scenario, first it will find a swing high, then a swing low, then a break of with price closed above the swing high. But the way it find swing high and low heavily depends on structure length value. If you set structure length as 12: to find swing high it will check 13th candle high

One of the good and important features in MT4 is the availability of the iExposure indicator. With the iExposure indicator, traders can see a comparison of ongoing open positions and how much funds have been used, and more importantly what is the average value of these open positions.
Unfortunately this indicator is not available on MT5.
This indicator is iExposure MT4 which I rewrote using the MT5 programming language. This indicator can be used like iExposure on MT4 with the same functions.
FREE
Hull Moving Average (HMA) para MT5 – Indicador de tendência rápido, suave e sem atraso
O Hull Moving Average (HMA) é um indicador de tendência de alto desempenho para MT5, projetado para fornecer sinais ultra suaves e praticamente sem atraso. Diferente de SMA, EMA ou WMA, o HMA reage imediatamente às mudanças do mercado enquanto filtra o ruído — ideal para scalpers e traders intraday. Construído com um mecanismo eficiente de média móvel ponderada, utiliza a fórmula original de Alan Hull e produ
FREE
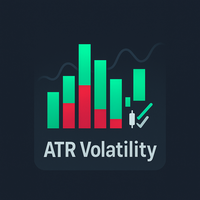
ATR Volatility Histogram para MT5 – Análise técnica de volatilidade Este indicador calcula e exibe a diferença entre um ATR rápido e um ATR lento na forma de um histograma, permitindo visualizar em tempo real as mudanças na volatilidade do mercado. Cálculo
Diferença de volatilidade = ATR rápido - ATR lento Interpretação Valores positivos (barras verdes) indicam aumento da volatilidade e podem confirmar o impulso de um rompimento. Valores negativos (barras vermelhas) indicam queda da volatilida
FREE

M & W Pattern Pro is an advanced scanner for M and W patters , it uses extra filters to ensure scanned patterns are profitable.
The indicator can be used with all symbols and time frames.
The indicator is a non repaint indicator with accurate statistics calculations.
To use , simply scan the most profitable pair using the statistics dashboard accuracy , then enter trades on signal arrow and exit at the TP and SL levels.
STATISTICS : Accuracy 1 : This is the percentage of the times price hits TP

The Indicator show Daily Pivot Points. It is possible to specify the number of days to display. For forex it doesn't consider the sunday session data. It is possibile to modify the color, style and width for every level. It is better to use this indicator with timeframe not higher than Н1. 4 Levels of support and resistance with also Intermediate Levels that is possible to hide.
FREE

FVG Smart Zones – Edição Gratuita Indicador de Detecção de Gap de Valor Justo para MetaTrader 5 (MT5) Está procurando uma ferramenta de trading real – não apenas mais um indicador qualquer?
FVG Smart Zones – Edição Gratuita oferece uma visão profissional do mercado detectando automaticamente Gaps de Valor Justo (FVG) e destacando zonas de trading de alta probabilidade diretamente no seu gráfico. Criado para traders que seguem:
Conceitos de Smart Money (SMC)
Conceitos de Trading ICT
FREE
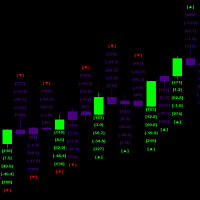
This indicator helps identify the start of significant market movements by analyzing candle patterns and their relative price action strength
the indicator runs multiple simultaneous calculation every millisecond and it also does a triple set verification historically in order to calculate future probabilities the historical processing has to be completed before new Candlestick can be processed as one total set out of the total available history from the starting date and time in order to
FREE

Características
Indicador para verificar o volume por preço. Funciona principalmente para o EURUSD, em outros pares de moedas pode não funcionar ou o cálculo pode demorar muito tempo. Para uso suave, ative a opção "Deslocar a borda final do gráfico a partir da borda direita", conforme mostrado na captura de tela. Quando uma nova barra aparece, os dados são redefinidos.
Variáveis COlOR: Configuração da cor do indicador WIDTH: Configuração da largura do indicador PERIOD: Determina o período de
FREE

INTRODUCTION TO GPT SPIKES INDICATOR The GPT Spikes Indicator is a revolutionary trading tool specifically engineered for the Boom and Crash markets on the Deriv platform. It leverages cutting-edge algorithms to provide traders with precise market insights, helping them to detect market spikes and reversal points with unparalleled accuracy. Whether you're new to trading or an experienced professional, the GPT Spikes Indicator offers the precision and customization you need to succeed in the vola
FREE

DESCRIPTION:
-----------
KS Dynamic Trendlines is an advanced indicator that automatically detects swing points
and draws intelligent trendlines that adapt to market conditions in real-time.
KEY FEATURES:
------------
Automatic swing high/low detection
Dynamic trendline generation connecting swing points
Real-time break detection - broken trendlines disappear automatically
Next strongest trendline appears when current one breaks
Multi-timeframe support - detect on H4, display on M15
Parallel t
FREE

The Period separators indicator separates time periods, specified by user.
It supports all timeframes, greater or aliquot to current timeframe. In case of the incorect timeframe, the indicator modifies it to closest correct value. Additional bonus - the separation of non-standard time periods - MOON, MOON/2, MOON/4 (moon phases). The separators are plotted using the indicator's buffers. The indicator uses one graphic object for information about the progress and current bar properties. The graph
FREE

Necessary for traders: tools and indicators Waves automatically calculate indicators, channel trend trading Perfect trend-wave automatic calculation channel calculation , MT4 Perfect trend-wave automatic calculation channel calculation , MT5 Local Trading copying Easy And Fast Copy , MT4 Easy And Fast Copy , MT5 Local Trading copying For DEMO Easy And Fast Copy , MT4 DEMO Easy And Fast Copy , MT5 DEMO O MACD é chamado de Convergência e Divergência de Média Móvel, que é desenvolvido a partir da
FREE

O indicador Weis Waves RSJ soma os volumes de cada onda. É assim que recebemos um gráfico de barras de volumes cumulativos de ondas alternadas. Ou seja, o volume cumulativo torna os gráficos de ondas Weis únicos.
Isto lhe permite comparar a relação das características da sequência de ondas, como correspondência da força aplicada (expressa no volume) e resultado recebido (evolução do preço).
FREE
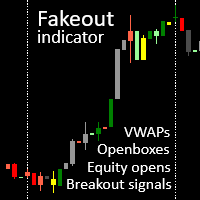
akeout candle indicator with session VWAPs, openboxes and openbox breakout signals. Check out our other products for fxer.net:
https://www.mql5.com/en/market/product/114888
https://www.mql5.com/en/market/product/114890 Main features 1. VWAPS for Tokyo, London and NY sessions 2. Openboxes for Tokyo, London and NY sessions 3. Colored candles for breakouts, fakeouts and inside candles 4. Equity open line 5. Openbox expansions 6. Unmitigated equity open prices for Tokyo, London and NY sessions 7
FREE

Breakout 4-in-1 Package Core Functionality The indicator serves as a "Trend Confirmation Engine." It identifies when the price breaks through a key structural level and then uses secondary oscillators to verify if the move has enough strength to continue. 1. The Breakout Engine (S&R) The foundation of the indicator is identifying Support and Resistance (S&R) . When price closes above resistance or below support, the indicator triggers an alert. Horizontal Levels: Breaks of previous highs/lows or
FREE

Swing Point Volume , o indicador que sinaliza fraqueza e força nos topos e fundos. Este indicador pode ser usado no Método Wyckoff.
Informações fornecidas; - Swing em ticks customizados. - Volume e pontos em cada Swing realizado. - Porcentagem de Deslocamento. - Opção de Alerta sonoro nas rupturas de topos e fundos. - Volume em ticks e Real Volume. - Volume HL(extremos) ou (abertura e fechamentos) - Formas de volume customizadas.

MQL4 has also been converted to MQL5 exposure info for friends using iexposure. It shows the total number of positions that have been opened, how many buy or sell positions there are, the net amount of position numbers and their order prices, the profit and loss status of all total positions. I didn't write their code, it's open source, but I wanted to share it with everyone because it's an indicator I like!
https://www.mql5.com/en/charts/14801856/usdjpy-fix-d1-idealfx-llc
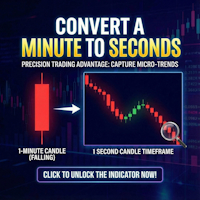
Second Timeframe Pro — See the Market Before Anyone Else!
Unlock a Hidden Level of Price Action
While other traders look at minute candles, you can see 60 candles within each minute!
What is Second Timeframe Pro?
It's a revolutionary indicator that creates full-fledged candlestick charts with second timeframes directly in MetaTrader 5.
Standard MT5 limits you to a minute chart. But the market doesn't stop every minute — it pulsates every second. Second Timeframe Pro removes this limitation

Identify Engulfing candle pattern with Arrows & Alert ( built-in RSI filter). This indicator helps you to identify Engulfing candle pattern or Outside bar (OB) on the chart with arrows, along with an alert when a new Engulfing candle appears. Engulfing candle pattern is one of the most important reversal Price Action signals. You can choose between standard Engulfing (Engulfing based on candle body) or non standard Engulfing (Engulfing based on candle high - low )
Alerts can be turned on

3 candel indicator in 1 !!! The 3 most important candel indicator in 1 packadge. Help trader in chart visualisation, prevent reversal !!! Doji : Gravestone Doji, Long Legged Doji, Dragonfly Doji. Engulfing : Bullish, Bearish. Hammer : red hammer, green hammer. Fully parametrable indicator icon color config and alarm. Free life time update !!! Just try our demo for free.

Adjustable Consecutive Fractals looks for 2 or more fractals in one direction and sends out a on screen alert, sound alert and push notification, for strong reversal points .
Adjustable Consecutive Fractals, shows the fractals on chart along with a color changing text for buy and sell signals when one or more fractals appear on one side of price.
Adjustable Consecutive Fractals is based Bill Williams Fractals . The standard Bill Williams fractals are set at a non adjustable 5 bars, BUT withe th

THE PERFECT ENTRY INDICATOR
Enter Trades Like a Pro With the Perfect Entry Indicator!
No More Guesswork. Just Precision. Double-ZigZag + Fractal Confirmation = Only the Strongest Buy & Sell Setups.
Are you tired of false signals, late entries, and endless chart confusion? The Perfect Entry Indicator was built to give traders crystal-clear entry points without hesitation.
SPECIAL BONUS (VALID TILL JUNE 2026)- OUR DAILY SCALPER EA for BTCUSD and VIX75 •···································

Ultra-fast recognition of parabolic channels (as well as linear, horizontal and wavy channels) throughout the depth of history, creating a hierarchy of channels. Required setting: Max bars in chart: Unlimited This indicator is designed primarily for algorithmic trading, but can also be used for manual trading. This indicator will have a very active evolution in the near future and detailed descriptions on how to apply to create robots
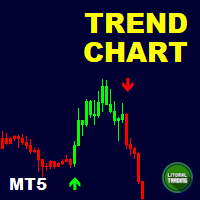
Você é do tipo surfador de tendência? Gosta de seguir os grandes tubarões? Não? Então é do tipo que opera reversão? Aguarda a exaustão da tendência e entra na operação?
Então este indicador é para você ! Com ele é extremamente fácil identificar a tendência e quando ela reverte pois o gráfico é automaticamente colorido de acordo com uma média móvel definida. Você pode alterar as configurações dela e deixá-la do seu jeito (ou ocultá-la).
Além disso é possível ter setas indicativas no gráfico e t

Você, assim como eu, gosta de operar a favor da tendência? Então este indicador vai te ajudar! Rainbow Trend é um indicador de tendência, no qual utiliza várias Médias Móveis junto do gráfico.
Ela mede diferentes zonas de força da tendência para diferentes prazos: muito curto, curto, médio, longo e muito longo.
Cada zona tem sua cor, e é possível ter alertas sonoros quando o preço sai de uma zona e entra em outra.
Sua configuração é muito simples. Se encontrou alguma falha ou tem alguma sugestão

Includes almost all the concepts related to Volume Profile: POC , Value Area , Developing POC , Anchored VWAP , Volume Delta ; since the “Total” in its name. It is fast in its calculations and simple to work with.
Features:
1. Selectable calculation timeframe to find most traded levels.
2. Capable of calculating Volume Profile based on tick data
3. Adjustable histogram bars by their count.
4. Adjustable histogram bars by their height (price range).
5. Showing Value Area (VA
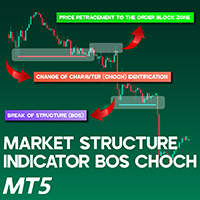
Market Structure Indicator BOS CHOCH MT5 The Market Structure Indicator (BOS-CHOCH) is an ICT-style tool built for MetaTrader 5 (MT5). It identifies both primary and secondary Change of Character (CHOCH) events and Breaks of Structure (BOS) across multiple levels, making it highly valuable for ICT and Smart Money traders. By simplifying the analysis of price behavior, this indicator enhances market structure interpretation and helps traders identify more accurate trading opportunities. Market

Use este indicador para receber alertas sobre tendências em desenvolvimento dentro do mercado.
Usando este indicador, você poderá receber alertas sobre tendências que estão se desenvolvendo no mercado à medida que se desenvolvem. Este indicador pode ser usado para identificar entradas ou saídas dentro de uma tendência. O indicador combina informações de prazos mais altos, com movimentos de preços do prazo atual para produzir um sinal de compra ou venda. O indicador pode identificar mudanças de
FREE
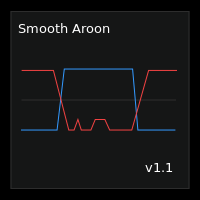
Smooth Aroon is a version of the Aroon Up and Down with smoothing and filtering.
Features :
Smoothing : You have smoothing from 0 to 99 . To smooth a signal, find the maximum value of the points in question then set the smoothing level above the maximum value. For example : If you want to smooth all signals below 30, then you should set the smoothing level above 30 This also smooths all signals above 70, since the Aroon Up and Down Oscillates between 0 and 100. Filtering : If you only w

The GGP SuperTrend MT5 Indicator is a technical analysis tool that can assist investors in identifying market trends. The indicator is based on ATR and is very useful for capturing the direction of an asset’s momentum and is widely employed when looking at stocks, currencies, and commodities. It plots a line on the price chart, which acts as a dynamic level of support or resistance, helping traders and investors make informed decisions about entry and exit points. This indicator is MT5 conversi

TREND HARMONY MT5 – Multi Timeframe Trend and Phase and Pullback Level Visualizer indicator for Metatrader5 The TREND HARMONY indicator automates deep trend analysis and generates visualizations for you. Take control of your trades by eliminating uncertainty! Revolutionize your trading experience with precision and insight through the TREND HARMONY Multi Timeframe indicator – your ultimate MT5 trend visualization indicator. [ Features and Manual | MT4 version | All Products ]
Are you tir

Smart Drawing Assist PRO MT5. Buttons will appears next to the selected object. The buttons are straightforward and amazingly easy to use. Features are as follow: Draw zigzag . Enabling you to draw patterns, draw zigzag, and draw shapes. All you have to do is click the button and start clicking point to point and it will draw automatically. Change object color . Rectangle/Trendline/HLine/Vline/Text/Price Arrow/Arrowed Line/ and your suggestion please. Flatten trendline . make a perfect flat line

Royal Wave is a Trend-Power oscillator which has been programmed to locate and signal low-risk entry and exit zones. Its core algorithm statistically analyzes the market and generates trading signals for overbought, oversold and low volatile areas. By using a well-designed alerting system, this indicator makes it easier to make proper decisions regarding where to enter and where to exit trades. Features Trend-Power Algorithm Low risk Entry Zones and Exit Zones Predictions for Overbought and Over

Two Period RSI + Alerts compares long-term and short-term RSI lines, and plots a fill between them for improved visualization. Fill is colored differently according to an uptrend (short period RSI above long period RSI) or a downtrend (short period RSI below long period RSI). Short-term RSI crossing long-term RSI adds a more robust trend confirmation signal than using single period RSI alone. This is a tool to help visualize and confirm RSI trends. We hope you enjoy!
Alerts Email, message, and

KT Risk Reward shows the risk-reward ratio by comparing the distance between the stop-loss/take-profit level to the entry-level. The risk-reward ratio, also known as the R/R ratio, is a measure that compares the potential trade profit with loss and depicts as a ratio. It assesses the reward (take-profit) of a trade by comparing the risk (stop loss) involved in it. The relationship between the risk-reward values yields another value that determines if it is worth taking a trade or not.
Features

Description The indicator uses market profile theory to show the most relevant trading zones, on a daily basis. The zones to be shown are LVN (low volume nodes) and POC (point of control). An LVN zone is one which represents price areas with the least time or volume throughout the day. Typically, these areas indicate a supply or demand initiative, and in the future, they can turn into important breakout or retracement zones. A POC zone is one which represents price areas with the most time or vo

Estratégia do Setup 9.1 criado pelo trader norte-americano Larry Williams . Setup SIMPLES, efetivo, com bom nível de acerto e excelente retorno. Atenção : A versão Demo só funciona no testador, se estiver interessado em executar em tempo real, por favor, entre em contato que estarei providenciando outra versão . Sinal de Compra:
Média móvel exponencial de 9 (MME9) caindo, esperar que ela VIRE PARA CIMA (em candle fechado). Lançar uma ordem stop 1 tick acima da MÁXIMA do candle que fez a virada o
Category: Oscillator Indicator
Platform: MetaTrader 5
Type: Entry Indicator
Timeframes: All
Trader Styles: Scalping, Day Trading, Swing Trading, Binary Options
Markets: All Description The Two-Pole Oscillator is an analytical tool based on deviation calculations and a two-pole smoothing filter. It is designed to highlight momentum conditions and potential trading signals while filtering out short-term noise. Main features: Two-Pole Filtering – Reduces chart noise for smoother oscillator curves.

Auto Order Block with break of structure based on ICT and Smart Money Concepts (SMC)
Futures Break of Structure ( BoS )
Order block ( OB )
Higher time frame Order block / Point of Interest ( POI ) shown on current chart
Fair value Gap ( FVG ) / Imbalance - MTF ( Multi Time Frame )
HH/LL/HL/LH - MTF ( Multi Time Frame )
Choch MTF ( Multi Time Frame )
Volume Imbalance , MTF vIMB
Gap’s Power of 3
Equal High / Low’s

The Volume Weighted Moving Average (VWMA) is calculated based on Prices and their related Volumes giving importance to those candles with more Volume. During periods of almost equal volume distributed along the observed period (commonly, in low volume periods) the VWMA will be graphically similar to a Simple Moving Average. Used along other moving averages a VWMA could be used as an alert, filter or whatever your imagination could think of...
HOW TO "READ" THIS INDICATOR As any Moving Average.
FREE
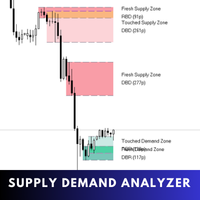
Supply Demand Analyzer is an advanced trading indicator meticulously designed for the precise identification, analysis, and management of supply and demand zones. By integrating real-time data and advanced algorithms, this tool enables traders to recognize market phases, price movements, and structural patterns with unparalleled accuracy. It simplifies complex market dynamics into actionable insights, empowering traders to anticipate market behavior, identify trading opportunities, and make in
VWMA Signal Pro – Painel Multitemporal de Tendência Ponderada por Volume VWMA Signal Pro é um indicador analítico que combina a média móvel ponderada por volume (VWMA) com filtros de confirmação de tendência e um painel multitemporal compacto.
Ajuda o trader a identificar a direção da tendência e a força do momento com base em volume e volatilidade. O indicador calcula valores de VWMA em vários períodos e exibe sinais de compra/venda confirmados pelos filtros ADX, ATR e VWAP. Cada sinal é class

Versão MT4 | FAQ O Indicador Owl Smart Levels é um sistema de negociação completo dentro de um indicador que inclui ferramentas populares de análise de mercado, como fractais avançados de Bill Williams , Valable ZigZag que constrói a estrutura de onda correta do mercado e níveis de Fibonacci que marcam os níveis exatos de entrada no mercado e lugares para obter lucros. Descrição detalhada da estratégia Instruções para trabalhar com o indicador Consultor de negociação Owl Helper Chat privado d

O Painel de Alerta de ADR mostra rapidamente onde o preço está sendo negociado atualmente em relação ao seu intervalo médio diário normal. Você receberá alertas instantâneos via pop-up, e-mail ou push quando o preço exceder o intervalo médio e os níveis acima de sua escolha, para que você possa pular para retrocessos e reversões rapidamente. O traço foi projetado para ser colocado em um gráfico em branco e apenas ficar no fundo e alertá-lo quando os níveis forem atingidos, para que você não pre
OmniSignal Navigator – Smart Entries at Key Levels Trade Like a Professional with this daily/weekly High-Low-Close indicator, designed for scalping or intraday short term trading and precision breakout trading. Suggested Timeframes to trade with: M5 | DONT USE THE INDICATOR ON THE M1 TIMEFRAME!!!
Why It Works Perfect for Scalping/Intraday: Targets key zones ( PDH/PDL/PDC & PWH/PWL/PWC ) on M2, M3, M5, M15 timeframes. (Lower Timeframes = More Signals, Higher Timeframes = Le
FREE

Porque o estilo é importante
Sei como é irritante clicar nas propriedades cada vez que se muda a cor da vela, o fundo para claro ou escuro, e colocar ou remover a grelha. Aqui está a solução com um clique: Três botões personalizáveis para escolher o estilo de vela que os comerciantes desejam. Um botão para alternar entre o modo Diurno e Nocturno. Um botão para mostrar ou esconder a grelha nos gráficos. ***** Nas definições, pode escolher onde os botões devem ser mostrados no ecrã***** Por fav
FREE

Better Period Separators For MetaTrader 5 The built-in period separators feature doesn’t allow users to specify the time period, so you can use this indicator to create more customizable period separators. On intraday charts, you could place period separators at a specific time, you could also place extra period separators at a specific time on Monday to mark the start of a week. On higher timeframe charts, this indicator works the same as the built-in period separators, On the daily chart, per
FREE

Weis Wave Volume Indicator for MetaTrader 5 (MT5) Check all of our products here: All Products Specifications Platform: MetaTrader 5 (MT5)
Type: Custom Technical Trading Indicator
Level: Intermediate
Timeframes: All Timeframes (Multi-Timeframe Support)
Trading Styles: Scalping, Day Trading, Swing Trading, Position Trading
Markets: Forex, Stocks, Commodities, Indices, and Cryptocurrencies What Does This Indicator Do? The Weis Wave Volume Indicator for MT5 is a powerful Price Action + V
High-precision Buy/Sell flip signal indicator designed for FlipX Markets on Weltrade and Volatility pairs on Deriv. FlipToxin was coded specifically for the 5-minute (M5) chart, but also works on higher timeframes with caution. On Boom, Crash, PainX, and GainX, the 15-minute chart is suggested, especially in trending markets. Scalping Mindset Reminder
This indicator is designed for quick, precise entries and exits — perfect for traders who aim for fast, smaller profits that add up over time t

"Wouldn't we all love to reliably know when a stock is starting to trend, and when it is in flat territory? An indicator that would somehow tell you to ignore the head fakes and shakeouts, and focus only on the move that counts?" The Choppiness Index is a non-directional indicator designed to determine if the market is choppy (trading sideways) or not choppy (trading within a trend in either direction). It is an oscillating indicator between -50 (very trendy) and +50 (very choppy). There are man

# SamuraiFX Combined Pro V14 **Master Market Turns with Real-Time Volume & Structure**
Stop guessing where the market will turn. The **SamuraiFX Combined Pro** is a comprehensive trading system that combines **Daily Structure**, **Volume Flow**, and **Price Action** into a single, non-repainting dashboard. It helps you identify high-probability Reversals and powerful Breakouts without the lag of traditional indicators.
### **Key Advantages**
* **No Lag, No Repaint:** Signals are generated in

If you heard about The Wyckoff Method, Volume Spread Analysis, etc... You are probably searching for the candlestick indicator that shows you the Volume spread all over the current bar, signaling every types of market status... You can control the several Market Levels with custom colors...
It is up to you to decide how to use it. Our job is provide you with the indicator...
If you like this indicator, all I am asking is a little Review (not a Comment, but a REVIEW! )... This will mean A LO
FREE

Trend Regularity Adaptive Moving Average Indicator for MT5
TRAMA Indicator for MT5 Overview
The Trend Regularity Adaptive Moving Average (TRAMA) is an intelligent adaptive moving average that dynamically adjusts its sensitivity based on market structure and trend consistency. Unlike standard moving averages, TRAMA reacts to how frequently new highs or lows are formed within a defined period, providing an adaptive balance between trend-following precision and range stability. How It Works
TRAM
The Higher timeframe candle tracker is used to get a glimpse of what the selected higher time frame candle is like. It plot the candle after the current price. It can come in handy for day traders and short term traders that often worry about how the current higher timeframe candle may look like. You can select the higher time frame or lower time frame from the options provided: By default the color for bears is red and for bulls is green. You are able to change the width of the candle, its wick
FREE
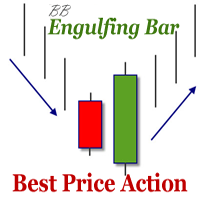
The indicator defines the Bullish and Bearish Engulfing Bar. The pattern has greater reliability when the open price of the engulfing candle is well above the close of the first candle, and when the close of the engulfing candle is well below the open of the first candle. For an engulfing bar to be valid it must fully engulf at least one previous bar or candle - includes all the body and the wick. The engulfing bar can engulf more than one bar as long as it completely engulfs the previous bar.
FREE
If you love this indicator, please leave a positive rating and comment, it will be a source of motivation to help me create more products <3 How to use Gann High-Low Activator? The Gann HiLo Activator helps the trader identify the current trend of the market. When the indicator is below the closing price, it can indicate that an uptrend is taking place. Conversely, when the indicator is above the closing price, it can indicate a downtrend. The Gann HiLo Activator also generates buy and sell sig
FREE

Deep Momentum Analyzer é um indicador de detecção de tendências impulsionado por IA que visualiza o momentum do mercado através de uma exibição de histograma intuitiva, ajudando os traders a identificar condições de mercado de alta e baixa com precisão e clareza. Visão geral O Deep Momentum Analyzer transforma dados de mercado complexos em sinais de negociação claros e acionáveis usando algoritmos analíticos avançados. Este indicador de nível profissional fornece aos traders feedback visual inst
FREE

O Amiguinho's Bar Counter é um indicador de price action para exibir a contagem de barras (candles) com algumas opções interessantes.
Sobre o parâmetro "Período de análise": caso o timeframe corrente estiver em minutos, então o período de análise será considerado em dias; caso o timeframe corrente estiver em dias, então o período de análise será considerado em meses; ou caso o timeframe corrente estiver em semanas ou meses, então o período de análise será considerado em anos.
FREE

This indicator visually highlights the Asian, London, and New York trading sessions on your chart using colored rectangles. It automatically calculates and displays the high, low, and price range (in pips) of each session for the most recent day. The session ranges are drawn for a configurable lookback period, allowing you to review session price action over multiple previous days. Key features include: Customizable session start and end times for Asian, London, and New York sessions. Colored se
FREE

Moving Average Trend Alert is a triple MA indicator that helps traders to identify potential market trends based on 3 MAs alignment and crossover.
Moving Average Trend Alert features: Customizable short-term, medium-term, and long-term MAs. Option to filter signals based on a minimum distance between moving averages to avoid premature MAs alignment. Optional Filter of signals with RSI indicator overbought/oversold levels. Optional Filter of signals with ADX indicator. Popup, email, and phone no
FREE

About:
The Nadaraya-Watson Envelope is a sophisticated yet practical technical indicator that helps traders identify overbought and oversold conditions using advanced kernel regression methods. This is the MT5 only Version.
For MT4 Version go here: https://www.mql5.com/en/market/product/158640/
Key Features ATR-Based Bands: Three upper and three lower bands provide graduated overbought/oversold zones Logarithmic Scale Calculation Center Line - bullish (teal) or bearish (red)
What is the Nad
FREE
Você sabe por que o mercado MetaTrader é o melhor lugar para vender as estratégias de negociação e indicadores técnicos? Não há necessidade de propaganda ou software de proteção, muito menos problemas de pagamentos. Tudo é providenciado no mercado MetaTrader.
Você está perdendo oportunidades de negociação:
- Aplicativos de negociação gratuitos
- 8 000+ sinais para cópia
- Notícias econômicas para análise dos mercados financeiros
Registro
Login
Se você não tem uma conta, por favor registre-se
Para login e uso do site MQL5.com, você deve ativar o uso de cookies.
Ative esta opção no seu navegador, caso contrário você não poderá fazer login.