MetaTrader 5용 기술 지표 - 13

It is the MQL5 version of zero lag MACD that was available for MT4 here: https://www.mql5.com/en/code/9993 Also there was a colored version of it here but it had some problems: https://www.mql5.com/en/code/8703 I fixed the MT4 version which has 95 lines of code. It took me 5 days to write the MT5 version.(reading the logs and testing multiple times and finding out the difference of MT5 and MT4!) My first MQL5 version of this indicator had 400 lines of code but I optimized my own code again and n
FREE

Smart Session Box Displays Asia, London, and New York trading sessions with automatic timezone adjustment and session overlap highlighting. Main Features Complete session analysis with no limitations. Key Features The indicator draws session boxes with high and low lines for each trading session. Session overlaps are highlighted with distinct colors to identify high liquidity periods. Breakout alerts notify when price crosses previous session levels. A control panel provides quick toggles for al
FREE
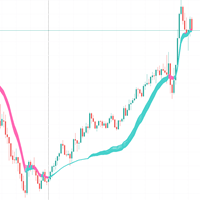
Understanding the RSI Adaptive EMA Indicator This code implements a custom trading indicator called "RSI Adaptive EMA" for MetaTrader platforms. It's a fascinating approach that combines RSI (Relative Strength Index) with an Exponential Moving Average (EMA) in a way that makes the EMA adapt based on market conditions.
Core Concept Traditional EMAs use a fixed smoothing factor (alpha), but this indicator creates a dynamic smoothing factor that changes based on RSI values. This allows the EMA lin
FREE

ATREND: 작동 방식 및 사용 방법 ### 작동 방식 MT5 플랫폼을 위한 "ATREND" 지표는 기술 분석 방법론의 조합을 활용하여 트레이더에게 강력한 매수 및 매도 신호를 제공하도록 설계되었습니다. 이 지표는 주로 변동성 측정을 위해 평균 진폭 범위(ATR)를 활용하며, 잠재적인 시장 움직임을 식별하기 위한 트렌드 탐지 알고리즘과 함께 사용됩니다. 구매 후 메시지를 남기면 특별 보너스 선물을 받게 됩니다. ### 주요 특징: - 동적 트렌드 탐지: 이 지표는 시장 트렌드를 평가하고 신호를 조정하여 트레이더가 현재 시장 상황에 맞춰 전략을 조정할 수 있도록 돕습니다. - 변동성 측정: ATR을 사용하여 시장의 변동성을 측정하며, 이는 최적의 손절매(SL) 및 이익 실현(TP) 수준을 결정하는 데 중요합니다. - 신호 시각화: 이 지표는 차트에 매수 및 매도 신호를 시각적으로 표시하여 트레이더의 의사 결정을 향상시킵니다. ### 운영 단계 #### 입력 및 설정 - TimeFr

PO3 FIBONACCI GOLDBACH - The Definitive Indicator for Market Analysis
Unlock the Secrets of the Market with the Perfect Fusion of Advanced Mathematics and Intelligent Trading!
---
EXCLUSIVE FEATURES:
1. UNIQUE GOLDBACH LEVELS SYSTEM · Automatic identification of Order Blocks (OB), Fair Value Gaps (FVG), Liquidity Voids (LV), and Mitigation Blocks (MB). · Precise calculation of rejection blocks (RB) and equilibrium zones (EQ) based on the Goldbach Conjecture. · 111.1% and -11.1

MT5용 차트 심볼 체인저는 패널에서 심볼 버튼을 클릭하여 첨부된 현재 차트 심볼을 변경할 수 있는 옵션을 제공하는 표시기/유틸리티입니다. MT5용 Chart Symbol Changer는 가장 관심을 갖고 거래하고 싶은 쌍을 추가하여 32개의 기호 버튼을 개인 취향에 맞게 구성할 수 있는 옵션을 제공합니다. 이렇게 하면 몇 번의 클릭만으로 차트에서 시장을 더 빨리 볼 수 있기 때문에 기회를 절대 놓치지 않을 것입니다.
MT5용 차트 심볼 체인저 설치/사용 설명서 | 구매한 제품의 업데이트
특징 동일한 차트에서 좋아하는 악기를 모니터링할 수 있는 패널의 32개의 사용자 정의 가능한 기호 모든 기호/도구, 계정 유형 또는 브로커에서 원활하게 작동
MT5용 차트 심볼 체인저는 일반적으로 거래 및 위험 관리와 수동 거래를 돕기 위해 거래 패널의 형태로 제공됩니다. 수동 무역 패널 MT5: https://www.mql5.com/en/market/prod
FREE
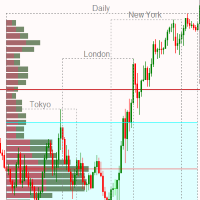
Market Session and Volume Profile Indicator A Professional Trading Tool for Advanced Market Analysis This sophisticated indicator combines Market Session Analysis with Volume Profile Technology to provide traders with critical market structure insights. Volume Profile is one of the most powerful analytical tools used by institutional traders and market makers to identify key price levels where significant trading activity occurs. Key Features: Volume Profile Analysis: POC (Point of Control) - I
Supertrend G5 Indicator Supertrend G5 is a high-performance trend-following tool designed to accurately identify market reversal points. By displaying a color-coded line directly on the chart, this indicator helps you quickly recognize bullish trends (green) and bearish trends (red), supporting optimal entry and exit points. Key Features: Clear Buy/Sell Signals Buy when the Supertrend line changes from red to green (beginning of an uptrend). Sell when the Supertrend line changes from green to re
FREE
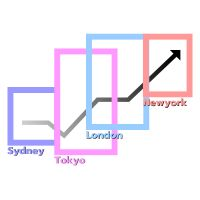
Time Zones and the Forex Market
The Forex market operates continuously 24 hours a day, facilitated by its global distribution across various time zones. The market is anchored by four primary trading centers: Sydney , Tokyo , London , and New York . Each trading center has specific opening and closing times according to its respective time zone. These differences significantly impact market volatility and trading opportunities during each session. Features Enable/Disable Date Display Enable/Di
FREE
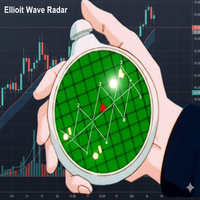
이 지표는 무엇을 하나요? 이 지표는 차트를 자동으로 분석하여 엘리엇 파동 패턴 (충격파와 조정파)을 식별하고, 실시간으로 파동 1, 2, 3, 4, 5의 위치를 보여줍니다. 또한, 가격 예측 , 거래량 확인 , 그리고 삼각형 패턴 감지 기능을 포함하고 있습니다. 이 "레이더" 버전은 어떤 점이 개선되었나요? 목표 예측: 5번 파동에서 가격이 어디로 향할지 제안합니다. 거래량으로 검증: 거래량이 감지된 패턴을 지지하는지 확인합니다. 삼각형 패턴 감지: 복잡한 조정 패턴(수렴형, 확산형, 대칭형)을 식별합니다. 확률 분석: 감지된 패턴이 얼마나 신뢰할 수 있는지 (%)로 알려줍니다. 다양한 대체 카운트: 시장이 모호할 때 한 가지 이상의 유효한 옵션을 제공합니다. 색상과 선을 이해하는 방법 파동 선: 파란색: 충격파 (1, 3, 5) — 주요 추세. 빨간색: 조정파 (2, 4) — 추세 내의 되돌림. 노란색 선 (제안된 되돌림) 이 선은 조정이 끝날 가능성이 가장 높은 지점을 표시합니
FREE

Deep Momentum Analyzer는 직관적인 히스토그램 디스플레이를 통해 시장 모멘텀을 시각화하는 AI 기반 추세 감지 지표로, 트레이더가 강세 및 약세 시장 상황을 정확하고 명확하게 식별할 수 있도록 돕습니다. 개요 Deep Momentum Analyzer는 고급 분석 알고리즘을 사용하여 복잡한 시장 데이터를 명확하고 실행 가능한 거래 신호로 변환합니다. 이 전문가급 지표는 트레이더에게 시장 모멘텀 변화에 대한 즉각적인 시각적 피드백을 제공하여 자신감 있게 진입 및 청산 타이밍을 잡을 수 있게 합니다. 지표는 차트 아래의 별도 창에 색상으로 구분된 히스토그램으로 시장 모멘텀을 표시합니다: 회색 막대 = 강세 모멘텀 (잠재적 매수 신호) 빨간색 막대 = 약세 모멘텀 (잠재적 매도 신호) 이 간단한 시각 시스템은 혼란을 제거하고 트레이더가 더 빠르고 정보에 입각한 결정을 내리는 데 도움이 됩니다.
시장별 권장 시간 프레임 시장 유형 권장 시간 프레임 외환 M15, M30, H
FREE

RSI / TDI 알림 대시보드를 사용하면 거래하는 모든 주요 쌍에서 RSI를 한 번에(귀하가 선택 가능) 모니터링할 수 있습니다.
두 가지 방법으로 사용할 수 있습니다.
1. 여러 시간 프레임을 선택하면 일반적인 거래 조건을 넘어 확장된 여러 시간 프레임이 있을 때 대시가 표시됩니다. 가격이 여러 기간에 걸쳐 과매수 또는 과매도 수준에 도달하여 최근에 가격이 크게 밀리고 있으므로 곧 철회 또는 반전이 예정되어 있음을 나타내는 훌륭한 지표입니다.
2. 하나의 기간(당신이 가장 선호하는 거래)과 여러 RSI 수준을 사용하여 해당 기간에 RSI 확장의 강도를 보여줍니다. 이것은 가격이 너무 오랫동안 한 방향으로 매우 세게 밀렸고 시장이 차익실현을 해야 할 때 평균 회귀 거래를 취하기 위한 훌륭한 전략입니다. 예시 스크린샷에서 H4 RSI가 25레벨을 넘어 2쌍으로 확장된 것을 볼 수 있습니다. 이는 일반적인 가격 조치보다 훨씬 더 멀리 있기 때문에 매수할 좋은 기회입니다.
대

BeST_Hull MAs Directional Strategy is a Metatrader Indicator based on the corresponding Hull Moving Average.It timely locates the most likely points for Entering the Market as well as the most suitable Exit points and can be used either as a standalone Trading System or as an add-on to any Trading System for finding/confirming the most appropriate Entry or Exit points. This indicator does use only the directional slope and its turning points of Hull MAs to locate the Entry/Exit points while it
What is the Chart Sync Indicator? This custom MQL5 tool enables multi-timeframe chart synchronization, addressing a common pain point in technical analysis: the inconsistencies when switching between chart windows or timeframes. Instead of managing each chart separately, this indicator links them so actions such as panning, zooming, drawing objects, or changing symbols are mirrored across all synced charts of the same symbol. The result is a smoother, unified analysis experience. Key Advantages:
FREE

ICT Turtle Soup Complete System - MT5 Indicator Overview The ICT Turtle Soup Complete System is an advanced MT5 indicator that combines Inner Circle Trader (ICT) concepts with the classic Turtle Soup trading pattern. This sophisticated tool identifies liquidity sweep reversals at key levels, providing high-probability trade setups with complete risk management calculations. Key Features 1. Multi-Timeframe Liquidity Detection Tracks Daily, 4H, 1H, and Yesterday's High/Low levels Identifies
FREE

Elevate your trading precision with the Copilot HUD Precision Price & Spread Visualizer. Most traders fail because they ignore the spread or lose track of candle closing times. This indicator is designed to provide professional-grade price transparency directly on your main chart window, combining a sleek dashboard with dynamic Bid/Ask visualization. Key Features: Dynamic Bid/Ask Lines: Unlike the default MT5 lines, these lines follow the current candle with a customizable length and thickness,
FREE
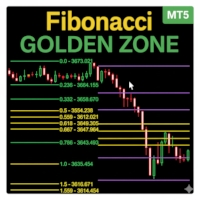
Fibonacci Sessions 지표는 정밀한 스캘핑 및 단기 전략을 위해 설계된 강력한 트레이딩 도구입니다. 뉴욕, 런던, 아시아 세션의 주요 피보나치 레벨を 자동으로 표시하여 트레이더들에게 주요 시장 세션에서의 가격 움직임을 명확하게 보여줍니다. 각 세션에서는 가격 반응이 가장 많은 고유한 "골든 존"이 강조됩니다. 이를 통해 되돌림, 돌파, 추세 지속 전략을 위한 매우 신뢰할 수 있는 영역이 생성됩니다. 이 지표는 가격이 한 골든 존에서 다른 골든 존으로 자주 이동하는 모습을 시각적으로 보여주며, 트레이더가 일관된 기회를 포착하도록 돕습니다. XAUUSD M5 시간 프레임에 최적화되어 있으며, 다른 외환쌍 및 글로벌 지수에서도 뛰어난 성능을 발휘합니다. 금, 통화쌍 또는 지수를 거래하든, 이 세션 기반 피보나치 맵핑은 높은 확률의 거래 구역을 식별하는 데 추가적인 이점을 제공합니다. 빨간 선: 극한 이익 목표 수준. 노란 선: 골든 존 (고확률 반응 영역).
FREE

This indicator helps to draw supply and demand zones based on ICT's concepts. Traders can customize their Demand and Supply zones' color. By default, demand is red, supply is blue. The recommended way of trading by ICT is to buy in Demand Zone and sell in Supply Zone. Do keep in mind to consider multiple other confluences when trading. Do keep in mind that it is possible for supply and demand zones to overlap. In such instances, I would recommend to refrain from trading as this implies a lack of
FREE

MOVING AVERAGE RIBBON Ritz MA Ribbon Dynamics – The Next-Gen Trend Visualizer Ritz MA Ribbon Dynamics is a futuristic multi-layer Moving Average system engineered to visualize trend momentum, volatility balance, and market rhythm in one adaptive ribbon.
Designed for modern traders who demand clarity, flexibility, and automation — this tool transforms the classic MA visualization into a dynamic analytical framework. Core Concept The indicator creates a multi-tier MA Ribbon that adapts to the cho
FREE

TILLSON MOVING AVERAGE Also known as TMA or T3 indicator. It is a moving average that uses EMA and DEMA in its formula and is calculated with the 3rd degree Binomial expansion. ... int handle1; //Handle of the Tillson TMA T3.EX5 custom indicator double euBuff1[]; int TMAperiod= 12 ; int TMSshift= 0 ; double VolumeFactor= 0.618 ; int OnInit () { ... handle1= iCustom ( NULL , PERIOD_CURRENT , "Market\\Tillson TMA T3.EX5" ,0,TMAperiod,0,0,TMSshift,0,0,Vol
FREE
https://www.mql5.com/en/users/gedeegi/seller The GEN indicator is a multifunctional technical analysis tool for the MetaTrader 5 (MT5) platform. It is designed to automatically identify and display key Support and Resistance (S&R) levels and detect False Breakout signals, providing clear and visual trading cues directly on your chart. Its primary goal is to help traders identify potential price reversal points and avoid market traps when the price fails to decisively break through key levels
FREE
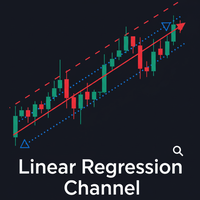
The Linear Regression Channel is a powerful technical analysis tool that helps visually identify the prevailing trend and potential price zones. Essentially, the indicator performs two main functions: It draws a trendline through the center of price action over a specified period. This line is calculated using the linear regression method, which results in the best possible "line of best fit" for the price data. From this center line, the indicator plots two parallel lines above and below, creat
FREE
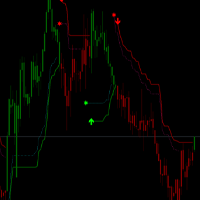
OV-VCS_ATR Trading Rules The OV-VCS_ATR indicator is a popular trend-following technical analysis tool that helps traders identify the current market trend and potential entry/exit points. Below are the general trading rules for using the OV-VCS_ATR indicator: 1. Indicator Overview The OV-VCS_ATR indicator consists of a line plotted on the price chart, which changes color to indicate the trend direction: Green Line: Indicates an uptrend (buy signal). Red Line: Indicates a downtrend
FREE

Time your Entry and Exits with Average True Range (ATR) Trailing Stops ATR Trailing Stops are primarily used to protect capital and lock in profits on individual trades but they can also be used, in conjunction with a trend filter, to signal entries. The indicator will help make your calculation of stop loss easier as it will be visually aiding you in choosing where to put your stoploss level on the chart by calculating the current value of ATR indicator. For those who are unfamiliar with ATR, i
FREE

Trend Magic Indicator for MT5
To download All Of Our Products , you can click this link: LINK Are you interested in the Wei Wave Indicator Volume : LINK
Are you interested in the Chandelier Indicator : LINK Are you interested in the Wave Trend Oscillator : LINK Are you interested in the Support & Resistance Indicator : LINK Are you interested in the Alpha Trend Indicator : LINK Are you interested in the NRTR Indicator : LINK
Introduction The Trend Magic Indicator is a smart tool that blends

TRUE SPIKES DERIV telegram channel for more information and other products: https://t.me/automated_TLabs
DM: https://t.me/gg4rex
Professional Trend-Spike Detection & Performance Tracking System for Boom & Crash Indices Download product user manual here: WHAT IS TRUE SPIKES? True Spikes is a precision-engineered trend-following indicator specifically designed to capture explosive spike movements in Boom and Crash synthetic indices. Unlike reversal-based systems, this indicator rides the m
FREE

This indicator can be considered as a trading system. It offers a different view to see the currency pair: full timeless indicator, can be used for manual trading or for automatized trading with some expert advisor. When the price reaches a threshold a new block is created according to the set mode. The indicator beside the Renko bars, shows also 3 moving averages.
Features renko mode median renko custom median renko 3 moving averages wicks datetime indicator for each block custom notification
FREE

Advanced ideas of the popular MACD indicator: It detects and displays classic and reverse divergences (two methods of detecting divergences). It uses different color to highlight an uptrend and a downtrend. Two methods of determining a trend: а) MACD crosses the 0 level (classic signal); б) MACD crosses its own average (early signal). This is a multi-timeframe indicator: it can display MACD data from other timeframes. Two methods of drawing: classic histogram and line. It generates sound and vis

CPR Pivot Lines It Will Draw Pivot Point R1,R2,R3 S1,S2,S3 Tc Bc Best Part Is That You Can Even Add Values Of High,Low,Close Manually Also To Get Your All Levels On Chart.So If Your Broker Data Of High ,Low ,Close Is Incorrect Then You Don’t Have To Depend On Them Anymore. You Can Even Modify All Lines Style. It Will Show Line In Floting Style And Not Continues Mess.
FREE
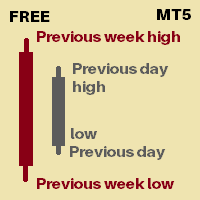
Its an indicator that will show you
Previous day high Previous day low Previous week high Previous week low You can set how many days of history you would like to see for previous day high low and previous week high low Currently 30 days of PDH/L will be marked 4 weeks of PWH/L will be marked You can change it from indicator settings. Dates are shown at marking lines to identify which date does that marking belongs to.
Thank you :) Always open to feedback and criticism if it helps me provide yo
FREE

The Swing High Low Indicator is an essential tool for traders who rely on price action. It automatically marks key reversal points (swing highs in red, swing lows in green), helping you visualize trends, spot breakouts, and draw precise trendlines. By highlighting these critical levels, the indicator reveals market structure shifts—whether the trend is strengthening, reversing, or entering consolidation. Perfect for all timeframes and strategies, it turns raw price data into actionable tra
FREE

Moving Average Trend Alert is a triple MA indicator that helps traders to identify potential market trends based on 3 MAs alignment and crossover.
Moving Average Trend Alert features: Customizable short-term, medium-term, and long-term MAs. Option to filter signals based on a minimum distance between moving averages to avoid premature MAs alignment. Optional Filter of signals with RSI indicator overbought/oversold levels. Optional Filter of signals with ADX indicator. Popup, email, and phone no
FREE

Smart Finder Order Block The Ritz Smart Finder Order Block is a next-generation market structure recognition tool, designed to intelligently detect and highlight institutional footprints within price action. Built on a dynamic blend of order block theory, consolidation tracking, and adaptive volatility modeling, it provides traders with a sophisticated lens to anticipate high-probability market reactions. Core Capabilities Smart Order Block Detection Identifies both Bullish and Bearish Order Blo
FREE
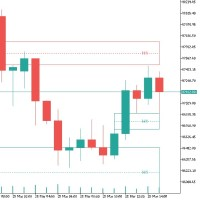
트레이딩의 임밸런스: 기본 및 전략 트레이딩의 임밸런스란 시장에서 수요와 공급 간의 불균형이 발생하는 현상을 의미합니다. 이는 매수 주문 과다(강세 임밸런스) 또는 매도 주문 과다(약세 임밸런스)로 나타날 수 있으며, 비효율적인 가격 책정으로 이어져 트레이더에게 기회를 창출합니다. 기술적 측면 "캔들 패턴" : 임밸런스는 종종 3개의 캔들 패턴으로 표시되며, 두 번째 캔들이 다른 캔들보다 길고 움직임의 방향을 결정합니다. "캔들 그림자" : 임밸런스의 주요 기준은 첫 번째와 세 번째 캔들의 그림자가 겹치지 않는 것입니다. 임밸런스 거래 방법 기본 전략 "임밸런스 식별" : 충분한 거래량 없이 가격이 급격하게 변한 영역을 찾습니다. "진입점" : 지정가 주문을 사용하여 임밸런스의 부분적 또는 전체적 중첩 이후에 거래를 시작합니다. "위험 관리" : 임밸런스 영역 외부에 스톱로스를 설정하고 임밸런스 크기의 1.5~2배로 이익을 확보합니다. 전략 예시 "임밸런스의 부분적 또는 전체적 채우
FREE
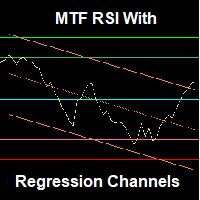
An advanced RSI indicator that displays dynamic linear regression channels in both the indicator window and the price chart, with predefined horizontal levels to detect overbought and oversold zones. Main Features (Summary): Synchronized linear regression channels on both price and RSI Multi–timeframe support Smart and ready-to-use horizontal levels Professional design with optimized performance Feedback & Support We value your experience! If you have any questions, suggestions, or encounter any
FREE
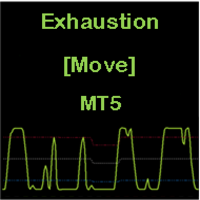
CONSTITUTION Exhaustion [Move] is an indicator consisting of an oscillator and three dynamic levels (upper, middler, lower). The inputs can be used to adjust the oscillator, dynamic levels and warning signals. It is designed for the MT5 platform only. APPLICATION This indicator should be used with a trend filter [e.g. moving averages, MA 200]. It detects the exhaustion of correction movements within a trend, thus giving entry points for new trades. It is usually used in the RENKO chart for SCA

INTRODUCTION The Fib Autotrendline is a basic tool that analysts use to find out when a security's trend is reversing. By determining the support and resistance areas , it helps to identify significant changes in price while filtering out short-term fluctuations, thus eliminating the noise of everyday market conditions. It is an excellent tool for any trader who follows indicators that use swing highs and swing lows . How to Use the fib Auto Trendline Indicator The Fib Auto Trendline

Breakout Monitor is a powerful trading tool designed to track price action within your custom-drawn zones. Simply draw a rectangle on your chart to define your consolidation or key levels, and the indicator will do the rest. It highlights the price range clearly and monitors it in real-time, ensuring you never miss a significant market move. When the price breaks through your defined boundaries, the indicator sends an instant Push Notification directly to your mobile phone in a clear, actionable
FREE

A combined indicator of two famous indicators: RSI , Bollinger Bands Can be used in all currency pairs Can be used in all time frames with many signals Very simple and fast to use
Description:
This indicator is made from the combination of RSI and Bollinger Bands indicators
As you can see, it shows good signals and is worth using and testing
We hope you are satisfied with this indicator
Settings: show past show candle: Displays the number of candles that the indicator calculates.
For example
FREE
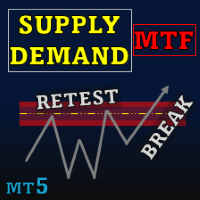
Special offer : ALL TOOLS , just $35 each! New tools will be $30 for the first week or the first 3 purchases ! Trading Tools Channel on MQL5 : Join my MQL5 channel to update the latest news from me Supply Demand Retest and Break Multi Timeframe , 이 도구는 강한 모멘텀 캔들에 기반하여 공급 및 수요 영역을 그리며, timeframe selector 기능을 사용하여 여러 시간대에서 이러한 영역을 식별할 수 있게 합니다. 재테스트 및 브레이크 라벨과 맞춤형 검증 및 스타일링 옵션을 통해 이 도구는 효과적인 거래 분석을 지원합니다. MT4 버전 자세히 보기: Supply Demand Retest and Break MT4 Multi Timeframe 더 많은 제품

Haven RSI Candlestick 은 기존의 상대강도지수(RSI) 라인 차트를 직관적인 캔들스틱 차트 형식으로 변환하는 혁신적인 기술 지표입니다.
이 도구는 기술적 분석에 의존하며 시장 모멘텀과 잠재적 반전 지점을 더 빠르고 깊이 있게 해석하고자 하는 트레이더를 위해 설계되었습니다. 기타 제품 -> 여기 . 주요 특징: RSI의 캔들스틱 시각화: 핵심 기능입니다. 이제 RSI 창 내에서 직접 프라이스 액션(Price Action) 기법과 캔들스틱 패턴 분석(예: '장악형', '도지')을 적용하여 모멘텀 변화의 신호를 더 일찍 감지할 수 있습니다. 클래식 분석과 RSI 동적 결합: 메인 차트의 캔들스틱 패턴과 RSI 캔들스틱 차트의 패턴을 교차 검증합니다. 가격 차트와 RSI 차트 모두에서 유사한 반전 신호가 동시에 나타나면 거래의 신뢰도가 크게 향상됩니다. 모든 상품 및 타임프레임에 적합: 통화, 주식, 암호화폐, 원자재 등 어떤 상품을 거래하든, 이 지표는 M1부터 MN까지
FREE
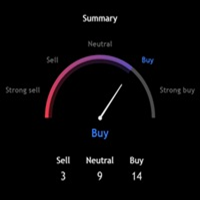
Technical Ratings for MT5 A multi-indicator analysis dashboard that displays aggregated technical signals directly on your MetaTrader 5 charts. This indicator calculates buy, sell, and neutral signals from 11 oscillators, 15 moving averages, and classic pivot points, presenting them in a single organized panel. What It Does Technical Ratings analyzes multiple technical indicators simultaneously and presents their consensus as clear trading signals. Instead of opening dozens of indicator windows

Fimathe Indicator The Fimathe Indicator is a tool for MetaTrader 5 designed to help traders identify support, resistance, neutral zones, and price channels. It features an interactive interface for drawing and managing support and resistance levels, generating take-profit channels and neutral zones, and providing visual and sound alerts for breakouts. Key Features Support and Resistance Lines: Dynamic and draggable lines to identify key levels. Reference Channel: Creates a channel between su
FREE

Prices move for many reasons and these can vary from one operator to another: software, private and institutional traders simultaneously contribute to the formation of the price, making predictive art very difficult. However, there are measurable factors that bind the price to an underlying trend in line with the physical reality that the financial asset represents: these are the macroeconomic indicators. Large investors use this information wisely to set their strategies. Understanding these m

모든 시간대에 Traditionnal, Fibonacci, Woodie, Classic, Demark, Camarilla의 피벗 포인트 그리기 모든 유형의 피벗 Traditionnal, Fibonacci, Woodie, Classic, Demark, Camarilla 지원 모든 기간 지원(M1...H1...D1...MN1...매년) 서버 일광 절약 시간제 지원 시드니에서 미국으로 열리는 외환 일일 섹션 지원 닫기 암호화 거래 지원 피벗과 추세 사이의 간격을 채우면 매우 유용합니다. 피벗 포인트는 추세의 방향을 보여주고 수요와 공급을 모니터링하기 위한 결정적인 영역을 제공합니다. 추세 지표로서 피벗 포인트는 주로 감상적 분석에 도움이 됩니다. PP보다 높은 가격은 강세를 나타내고, PP보다 낮은 가격은 시장에서 약세를 나타냅니다.
FREE

This is a multi timeframe version of the Supply and Demand indicator . It allows you to analyze a chart using the law of supply and demand on three different timeframes at a time. You will see zones of sales and purchases and determine the most profitable points to open positions. The indicator is based on the principle of market fractality. Supply and demand zones show places where a strong buyer or seller has made the price reverse and change its direction. The indicator has several types of
FREE
If you love this indicator, please leave a positive rating and comment, it will be a source of motivation to help me create more products <3 How to use Gann High-Low Activator? The Gann HiLo Activator helps the trader identify the current trend of the market. When the indicator is below the closing price, it can indicate that an uptrend is taking place. Conversely, when the indicator is above the closing price, it can indicate a downtrend. The Gann HiLo Activator also generates buy and sell sig
FREE

스타일이 중요하기 때문에 촛불의 색상, 배경을 밝거나 어둡게 변경하고 격자를 넣거나 제거하기 위해 매번 속성을 클릭하는 것이 얼마나 성가신 일인지 압니다. 클릭 한 번으로 해결하는 방법은 다음과 같습니다. 차트에서 그리드를 표시하거나 숨기는 버튼 1개. 트레이더가 원하는 캔들 스타일을 선택할 수 있는 3개의 맞춤형 버튼. 주간 모드와 야간 모드 사이를 전환하는 버튼 1개. *****설정에서 화면에서 버튼을 표시할 위치를 선택할 수 있습니다.*** 내 다른 제품을 확인하는 것을 고려하십시오 https://www.mql5.com/en/users/javimorales.fer/seller 스토캐스틱 RSI란 무엇입니까? 스토캐스틱 RSI(StochRSI)는 0과 1(또는 일부 차트 플랫폼의 경우 0과 100) 범위의 기술적 분석에 사용되는 지표이며 스토캐스틱 오실레이터 공식을 상대 강도 지수(RSI) 값 세트에 적용하여 생성됩니다. 표준 가격 데이터보다 작가 트레이딩 알고리즘의 창시자 하비
FREE

The ATR Exit indicator uses the candle close + ATR value to draw trailing stop lines (orange under buys, magenta over sells) that advance with the trend until the trend changes direction. It uses a multiple of the Average True Range (ATR), subtracting it’s value from the close on buy, adding its value to the close on sell. Moreover, the trailing stop lines are generated to support the order’s trend direction (long or short): In an upward trend, the long trailing stop line (orange line under bu
FREE

The Pivot Point indicator automatically calculates and displays the pivot point line and support and resistance levels. Pivot can be calculated according to the Classic, Floor, Fibonacci, Woodie, Camarilla or DeMark formula. It is also possible to select the period for calculating the indicator. A trader can choose from daily, weekly, monthly, or user-defined periods.
Types of pivots Classic Floor Fibonacci Woodie Camarilla DeMark
Main features The indicator shows the current and historic
FREE

FREE Bookmap Volume Heatmap Indicator Overview The Bookmap Volume Heatmap is a custom MetaTrader 5 (MQL5) indicator that creates a visual heatmap of trading volume distribution across price levels, similar to professional trading platforms like Bookmap. It provides traders with a clear visualization of where significant trading activity has occurred within a specified price range. Key Features 1. Volume Distribution Visualization Creates color-coded rectangles on the chart representing vol
FREE

앵커 VWAP(Anchored VWAP) 앵커 VWAP는 기존 VWAP의 변형으로, 거래 세션 시작이나 고정된 시간 간격이 아닌 특정 시점(앵커)에서 지표 계산을 시작합니다. 이는 주요 뉴스, 트렌드 시작, 지지선 또는 저항선 돌파와 같은 기술적 이벤트와 같은 특정 사건부터의 가격과 거래량 간의 관계를 평가하려는 트레이더에게 유용할 수 있습니다. 이 지표는 외환, 주식 및 지수에서 사용 가능합니다. 동일한 차트에 여러 인스턴스를 추가하고 각 VWAP의 앵커 지점을 클릭 한 번으로 수정할 수 있습니다. 가격이 VWAP에 도달할 때 알림을 활성화하십시오. VWAP는 "자성"을 가지고 있습니다: 캔들 위에 마우스를 올리면 HIGH로, 중앙에 두면 TYPICAL로, 캔들 아래에 두면 LOW로 자동 설정됩니다.
FREE

MetaTrader 5용 WH Trading Sessions MT5 지표로 거래 정확도를 높이세요! 이 강력한 도구는 주요 시장 세션을 손쉽게 시각화하고 관리하는 데 도움이 됩니다. 기반을 둔 on : WH SMC 인디케이터 MT5
MT4 버전 : WH Trading Sessions MT4
주요 특징: 대화형 GUI 패널 – 아시아, 런던, 뉴욕 거래 세션을 쉽게 선택하고 전환할 수 있습니다.
사용자 정의 알림 및 설정 – 직관적인 옵션 탭을 사용하여 지표를 귀하의 전략에 맞게 조정하세요.
빠르고 반응성이 뛰어난 인터페이스 – 이동, 최소화, 최대화가 가능한 패널 로 원활한 환경을 즐겨보세요.
자동 GMT 오프셋 처리 – 수동 조정이 필요 없음 - 세션은 항상 시장 시간과 일치합니다.
Trading Session을 통해 시장 활동을 앞서가고 거래 결정을 최적화하세요
FREE

This indicator is very useful for day traders or short term traders. (MT5 version) No need to calculate the number of pips manually, just look at the chart and you will see the Virtual Take Profit / Virtual Stop Loss target line and evaluate whether the entry point is feasible to reach the intended target or not.
Enter the intended Take Profit / Stop Loss pips for your trade. The indicator will display Virtual Take Profit / Virtual Stop Loss lines for you to easily see if the target is
FREE

This indicator is designed to help traders to help them Synchronize objects across all charts that have the same pair/currency.
Applicable objects: -Rectangle
-Trendlines
-Trendlines by Angle
-Horizontal Lines
-Vertical Lines
-Arrow Lines
-Channels
- Text boxes
Known Issues : - Visualization is not copied to the other charts. - If indicator is only placed in one chart, other charts with the same pair/currency will have difficulty deleting the objects if there is no "Sync Objects In Charts" in
FREE

The "Support Resistance Dynamic" indicator is a powerful technical analysis tool for the MetaTrader 5 platform, designed to automatically identify and plot dynamic Support and Resistance zones on price charts. This indicator helps traders easily recognize important price levels, potential reversal points, or breakout areas, thereby enabling more informed trading decisions. 2. Key Features Dynamic S/R Identification : Automatically identifies support and resistance zones based on an advanced Pivo
FREE

Matreshka self-testing and self-optimizing indicator: 1. Is an interpretation of the Elliott Wave Analysis Theory. 2. Based on the principle of the indicator type ZigZag, and the waves are based on the principle of interpretation of the theory of DeMark. 3. Filters waves in length and height. 4. Draws up to six levels of ZigZag at the same time, tracking waves of different orders. 5. Marks Pulsed and Recoil Waves. 6. Draws arrows to open positions 7. Draws three channels. 8. Notes support and re

차트에 지지 및 저항 수준과 추진 캔들 갭을 자동으로 그려주므로 다음 가격 방향 및/또는 잠재적 반전 가능성을 확인할 수 있습니다.
이 보조지표는 제 웹사이트(시장 구조 트레이더)에서 가르치는 포지션 트레이딩 방법론의 일부로 사용하도록 설계되었으며 타겟팅 및 잠재적 진입을 위한 주요 정보를 표시합니다. MT4 Version: https://www.mql5.com/en/market/product/97246/ 이 보조지표에는 2가지 핵심 기능과 4가지 추가 기능이 있습니다: 핵심 기능 1 - 일일, 주간 및 월간 시간대의 자동 지지선 및 저항선 이 인디케이터는 지난 2일에서 최대 6주 및 몇 달 전의 가장 최근 지원 및 저항 수준을 자동으로 가져옵니다. 이러한 레벨의 모양을 원하는 대로 완전히 사용자 지정하고 표시되는 레벨 수를 표시할 수 있습니다. 이러한 주요 레벨은 종종 가격이 하락하거나 반전되는 주요 지지 및 저항 구간으로 작용합니다. 또한 가격이 향할 목표가 되기도 하므로
The Higher timeframe candle tracker is used to get a glimpse of what the selected higher time frame candle is like. It plot the candle after the current price. It can come in handy for day traders and short term traders that often worry about how the current higher timeframe candle may look like. You can select the higher time frame or lower time frame from the options provided: By default the color for bears is red and for bulls is green. You are able to change the width of the candle, its wick
FREE

[TH] คำบรรยายสินค้า: The Horse Pro Signal (WinWiFi Robot Series) The Horse Pro Signal คืออินดิเคเตอร์ระดับมืออาชีพรุ่นล่าสุดจากตระกูล WinWiFi Robot Series ออกแบบมาสำหรับแพลตฟอร์ม MetaTrader 5 (MT5) โดยเฉพาะ เพื่อช่วยเทรดเดอร์ในการวิเคราะห์พฤติกรรมราคา (Price Action) ทั้งในสภาวะตลาดที่มีเทรนด์ชัดเจนและช่วงตลาดไซด์เวย์ (Sideways) คุณสมบัติเด่น: การวิเคราะห์แท่งเทียนอัจฉริยะ: ระบบอ้างอิงการเคลื่อนที่ของราคาตามเทรนด์และสลับกับการกรองสัญญานในช่วงไซด์เวย์ เพื่อความแม่นยำสูงสุด การแสดงผลที่ชัดเจน: มาพ
FREE

이 표시기를 사용하여 시장 내 개발 동향에 대한 경고를 받으십시오.
이 표시기를 사용하여,당신은 그들이 개발 시장에서 개발 동향에 대한 경고를 얻을 수있을 것입니다. 이 표시기는 추세 내의 항목 또는 종료를 식별하는 데 사용할 수 있습니다. 이 표시기는 더 높은 시간대의 정보를 현재 시간대의 가격 움직임과 결합하여 구매 또는 판매 신호를 출력합니다. 표시기는 추세 변화 또는 지배적 인 추세의 연속을 식별 할 수 있습니다.
참고:추세 다음 낮은 승리 비율을 가지고 있지만,추세의 수익률은 평균 손실의 3~5 배 크기가 될 수 있습니다. 간단한 설정 드래그 앤 언제든지 프레임에,어떤 차트에 놓습니다. 경고 사용(선택 사항) 그리고 당신은 완료! 시각 및 오디오 경고 휴대 전화로 직접 전송 경고 터미널로 전송 경고 팝업 다중 사용 주식,외환,옵션,선물 유연한 모든 시간 프레임에서 작동
FREE

MT5용 Hull Moving Average (HMA) – 빠르고 부드럽고 지연 없는 트렌드 지표
Hull Moving Average(HMA)는 매우 부드럽고 거의 지연이 없는 신호를 제공하는 고성능 MT5 트렌드 지표입니다. SMA, EMA, WMA와 달리 시장 방향 변화에 즉각적으로 반응하며 노이즈를 효과적으로 제거합니다. 스캘퍼와 데이트레이더에게 최적입니다. 효율적인 가중 이동평균 엔진을 기반으로 Alan Hull의 공식 공식을 정확히 구현하여 리페인트 없는 깨끗하고 정확한 트렌드 라인을 제공합니다. 핵심 장점 트렌드 변화에 지연 없는 반응 매우 부드럽고 안정적인 곡선 SMA/EMA/WMA보다 높은 정확도 리페인트 없음, EA 친화적 모든 상품에서 작동: Forex, 금, 지수, 암호화폐 최적 사용처:
트렌드 방향, 진입/청산, 풀백, 반전, 자동매매 전략. 진지한 트레이더를 위한 빠르고 신뢰성 높은 HMA.
FREE

The fact that round number levels have a significant influence on the market cannot be denied and should not be overlooked. These psychological levels are used by both retail Forex traders and major banks that deal in Forex. Very simple and effective indicator and most importantly free. ////////////////////////////////////////////////////////////////////////////////////////////////////////////////////////////////////////////////////////////// The program does not work in the strategy tester.
FREE

The Penta-O is a 6-point retracement harmonacci pattern which usually precedes big market movements. Penta-O patterns can expand and repaint quite a bit. To make things easier this indicator implements a twist: it waits for a donchian breakout in the right direction before signaling the trade. The end result is an otherwise repainting indicator with a very reliable trading signal. The donchian breakout period is entered as an input. [ Installation Guide | Update Guide | Troubleshooting | FAQ | A
FREE

기능
가격에 대한 거래량 확인 지표입니다. 주로 EURUSD에 적용되며, 다른 통화 쌍은 작동하지 않거나 계산에 오랜 시간이 걸릴 수 있습니다. 원활한 사용을 위해 "차트 경계를 오른쪽 경계에서 이동" 옵션을 활성화합니다(스크린샷에 표시됨). 새로운 막대가 나타날 때 데이터가 재설정됩니다.
변수 COlOR: 지표 색상 설정 WIDTH: 지표 너비 설정 PERIOD: 데이터 계산을 위한 기간 설정
‐----‐-------------------------------------------------------------------------------------------------------------------------------------------------
FREE

The Indicator show Daily Pivot Points. It is possible to specify the number of days to display. For forex it doesn't consider the sunday session data. It is possibile to modify the color, style and width for every level. It is better to use this indicator with timeframe not higher than Н1. 4 Levels of support and resistance with also Intermediate Levels that is possible to hide.
FREE

The Advanced Support and Resistance Indicator for MetaTrader 5 leverages sophisticated pivot point detection algorithms to autonomously identify and visualize critical price levels on the chart. Utilizing a configurable pivot period (default: 20 bars) and data source (High/Low or Open/Close), it intelligently scans historical price action within a user-defined loopback window (default: 290 bars) to pinpoint pivot highs and lows with strict validation criteria for enhanced precision. Pivots are d
FREE

If you heard about The Wyckoff Method, Volume Spread Analysis, etc... You are probably searching for the candlestick indicator that shows you the Volume spread all over the current bar, signaling every types of market status... You can control the several Market Levels with custom colors...
It is up to you to decide how to use it. Our job is provide you with the indicator...
If you like this indicator, all I am asking is a little Review (not a Comment, but a REVIEW! )... This will mean A LO
FREE

Volume Profile Indicator – User Guide Description: The Volume Profile Indicator is a powerful tool designed for MetaTrader 5. It visualizes market activity using volume distribution across price levels, showing: Histogram of volume at each price bin POC (Point of Control) – the price with the highest traded volume Value Area – the range covering a configurable percentage of volume (e.g. 70%) Support levels: Min, Max, and Pivot Average tick size for BUY and SELL movements Inputs and Parameters:
FREE

Auto Fibo Expansion is an indicator that projects the Fibonacci expansion levels above and below the opening price of the day. It does the calculation based on the previous day and projects the levels on the current day. It is very efficient to find "psychological" zones of support and resistance. Its appearance is all configurable and you can set up to 30 different levels. Enjoy! This is a free indicator, but it took hours to develop. If you want to pay me a coffee, I appreciate a lot <3 PayP
FREE
트레이딩 전략과 기술 지표를 판매하기에 가장 좋은 장소가 왜 MetaTrader 마켓인지 알고 계십니까? 광고나 소프트웨어 보호가 필요 없고, 지불 문제도 없습니다. 모든 것이 MetaTrader 마켓에서 제공됩니다.
트레이딩 기회를 놓치고 있어요:
- 무료 트레이딩 앱
- 복사용 8,000 이상의 시그널
- 금융 시장 개척을 위한 경제 뉴스
등록
로그인
계정이 없으시면, 가입하십시오
MQL5.com 웹사이트에 로그인을 하기 위해 쿠키를 허용하십시오.
브라우저에서 필요한 설정을 활성화하시지 않으면, 로그인할 수 없습니다.