Candle Movement Index
- Indicators
- Ahmad Kazbar
- Version: 1.1
- Updated: 27 August 2025
- Activations: 5
Candle Movement Index (CMI) — Visual Candle Strength Indicator for MT5
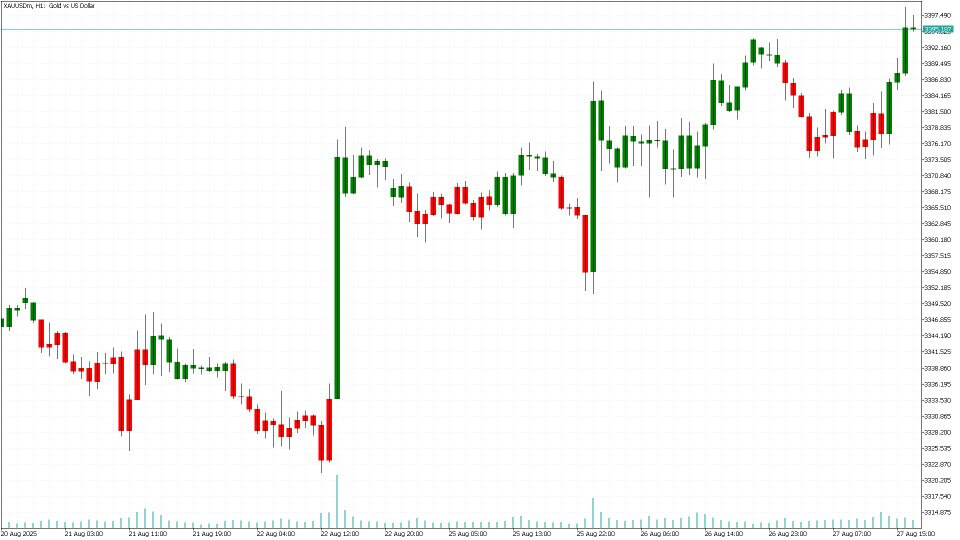
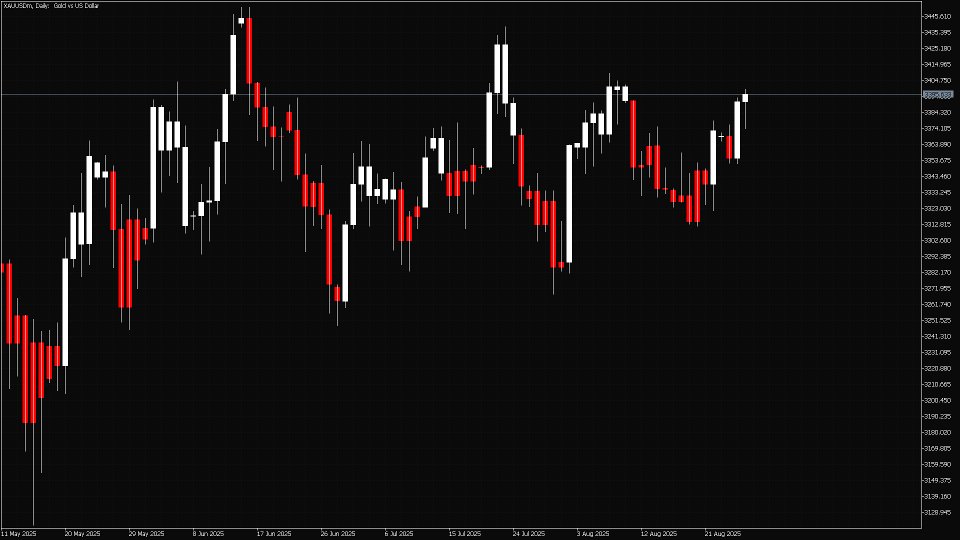
The Candle Movement Index (CMI) is a powerful MT5 indicator that visually measures the strength and momentum of each candle. It provides a color-coded representation of candle behavior, allowing traders to easily spot trend strength, market reversals, and volatility zones. This indicator is ideal for scalpers, intraday traders, and swing traders who want a quick and reliable visual confirmation of candle strength.
Key Features:
-
Visual candle strength detection that identifies bullish or bearish momentum
-
Color-coded display showing how strongly each candle closed relative to its open
-
Non-repainting algorithm for reliable live and historical performance
-
Works on all timeframes (M1 to MN)
-
Customizable parameters for sensitivity, colors, and thresholds
-
Low CPU usage and optimized for real-time charting
-
Can be combined with other tools such as ATR, RSI, MACD, or trend filters
How It Works:
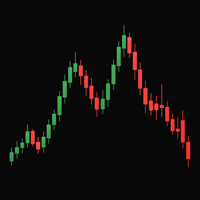
CMI calculates the relative movement between candle closes and opens, translating this data into a color gradient that reflects market pressure:
Bright green indicates a strong bullish candle
Bright red indicates a strong bearish candle
Neutral colors indicate low volatility or indecision
Use CMI to:
Identify trend continuation or exhaustion
Filter false signals from other indicators
Confirm entry and exit zones visually
Best Practices:
Combine with ATR or Moving Average for better volatility filtering
Works effectively as a confirmation tool alongside RSI or MACD
Recommended chart types: Candlestick or Heiken Ashi
Suitable for Forex majors, gold, and indices
Example Strategy:
-
When CMI bars turn bright green and the higher timeframe confirms an uptrend, consider a long entry.
-
When CMI turns bright red and the higher timeframe confirms a downtrend, consider a short entry.
-
Avoid trading when colors are mixed or neutral, indicating market indecision.
Input Parameters:
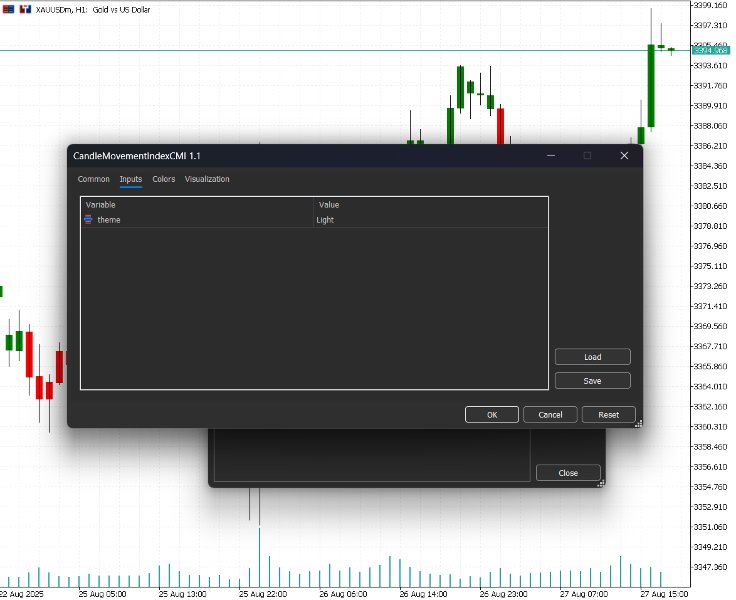
Sensitivity - Controls how reactive the color changes are to candle movement
BullishColor - Defines the bullish color intensity
BearishColor - Defines the bearish color intensity
NeutralZone - Sets the range for low-volatility conditions
AlertMode - Enables optional alerts for strong movement
Why Traders Use It:
Simplifies price action into clear visuals
Helps avoid emotional decisions
Detects momentum shifts early
Lightweight and stable for continuous use
Note:
This indicator is designed for visual analysis and educational purposes. It does not generate automatic trading signals or guarantee profits. Always test before live trading.
Support and Updates:
Lifetime free updates
Responsive support through MQL5 messages
Improvements based on user feedback
If you find this indicator helpful, please leave a rating and comment.
