Indicadores técnicos para MetaTrader 5 - 13

BeST_Hull MAs Directional Strategy es un indicador de Metatrader basado en la correspondiente Media Móvil Hull, que localiza oportunamente los puntos más probables para entrar en el mercado, así como los puntos de salida más adecuados, y puede utilizarse como un sistema de negociación independiente o como un complemento a cualquier sistema de negociación para encontrar/confirmar los puntos de entrada o salida más apropiados. Este indicador utiliza sólo la pendiente direccional y sus puntos de i
Haven CBDR es un indicador fácil de usar que muestra en el gráfico el rango ICT "Central Bank Dealers Range" (CBDR). El programa dibuja rectángulos que resaltan el rango de precios CBDR y también muestra líneas de desviación estándar adicionales para evaluar posibles niveles de soporte y resistencia. El producto permite configurar el intervalo de tiempo del CBDR, la cantidad de días calendario mostrados, los colores y estilos de los elementos gráficos, y ajusta automáticamente el esquema de colo
FREE
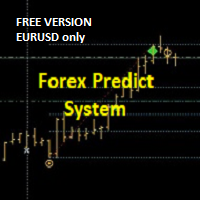
+++++++++++++++++++++++++++++
+++ VERSION GRATUITA - SOLO EURUSD
+++++++++++++++++++++++++++++
Por favor, añada PREFIX y/o SUFFIX a través de los ajustes si su Símbolo Gráfico de Broker es diferente (por ejemplo, sufijo = .r).
+++
Este es un sistema de previsión.
En el momento de la ruptura/previsión: el indicador dibuja la zona de retroceso (amarillo) y tres objetivos. Los niveles actúan como soporte y resistencia. Se puede utilizar en todos los pares/índices/marcos temporales/períodos. Par
FREE

Visión general del Indicador de Sesiones de Mercado El Indicador de Sesiones de Mercado es una herramienta diseñada para ayudar a los operadores a visualizar las horas de negociación activas de los principales mercados financieros mundiales, concretamente las sesiones de Tokio, Londres y Nueva York. Al marcar claramente estas zonas horarias en el gráfico, el indicador permite a los usuarios identificar la partición de las principales sesiones de negociación. Hay 3 sesiones de negociación regular
FREE
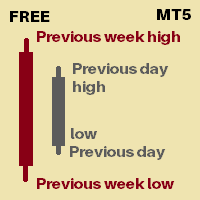
Es un indicador que le mostrará
Máximo del día anterior Mínimo del día anterior Máximo de la semana anterior mínimos de la semana anterior Puede establecer cuántos días de historial desea ver para los máximos y mínimos del día anterior y para los máximos y mínimos de la semana anterior. Actualmente se marcarán 30 días de PDH/L Se marcarán 4 semanas de PWH/L Puede cambiarlo desde los ajustes del indicador. Las fechas se muestran en las líneas de marcado para identificar a qué fecha pertenece ese
FREE

Deep Momentum Analyzer es un indicador de detección de tendencias impulsado por IA que visualiza el momentum del mercado a través de una pantalla de histograma intuitiva, ayudando a los traders a identificar condiciones de mercado alcistas y bajistas con precisión y claridad. Descripción general El Deep Momentum Analyzer transforma datos de mercado complejos en señales de trading claras y accionables utilizando algoritmos analíticos avanzados. Este indicador de grado profesional brinda a los tra
FREE

Sistema completo de sopa de tortuga de las TIC - Indicador MT5 Visión general El ICT Turtle Soup Complete System es un indicador MT5 avanzado que combina los conceptos de Inner Circle Trader (ICT) con el clásico patrón de trading Turtle Soup. Esta sofisticada herramienta identifica reversiones de barrido de liquidez en niveles clave, proporcionando configuraciones de trading de alta probabilidad con cálculos completos de gestión de riesgo. Características principales 1. Detección de liquidez
FREE

La Media Móvil Ponderada por Volumen (VWMA) se calcula en base a los Precios y sus Volúmenes relacionados dando importancia a aquellas velas con más Volumen. Durante periodos de casi igual volumen distribuido a lo largo del periodo observado (comúnmente, en periodos de bajo volumen) la VWMA será gráficamente similar a una Media Móvil Simple. Utilizada junto con otras medias móviles una VWMA podría ser utilizada como alerta, filtro o lo que tu imaginación te permita...
CÓMO "LEER" ESTE INDICADOR
FREE

Características
Indicador para verificar el volumen por precio. Funciona principalmente para EURUSD, en otros pares de divisas puede no funcionar o el cálculo puede llevar mucho tiempo. Para un uso fluido, activa la opción "Desplazar el borde final del gráfico desde el borde derecho", como se muestra en la captura de pantalla. Cuando aparece una nueva barra, se reinician los datos.
Variables COlOR: Configuración del color del indicador WIDTH: Configuración del ancho del indicador PERIOD: Det
FREE

SMC VALID EA (MT5) Versión: 1.10
Autor: Marrion Brave Wabomba
Categoría: Smart Money Conceptos (SMC) y conceptos de las TIC ICT Smart Money Zonas diarias (SMC Pro) ICT Smart Money Daily Zones (SMC Pro) - ICT Daily Buy & Sell Zones Pro es un indicador comercial de grado profesional Smart Money Concepts (SMC) / ICT para MetaTrader 5, diseñado para mapear claramente los niveles diarios institucionales y guiar a los operadores con zonas de decisión de alta probabilidad . Este indicador analiza a

El Penta-O es un patrón armonacci de 6 puntos de retroceso que suele preceder a los grandes movimientos del mercado. Los patrones Penta-O pueden expandirse y repintarse bastante. Para facilitar las cosas este indicador implementa un giro: espera una ruptura donchiana en la dirección correcta antes de señalar la operación. El resultado final es un indicador que se repinta con una señal de operación muy fiable. El periodo de ruptura donchiana se introduce como entrada. [ Guía de instalación | Guía
FREE
Indicador Trend Magic para MT5
Para descargar todos nuestros productos , puede hacer clic en este enlace: ENLACE ¿Está usted interesado en el Volumen Wei Wave Indicador : LINK
¿Está interesado en el Indicador Chandelier : LINK ¿Está interesado en el Oscilador de Tendencia de Onda ? LINK ¿Le interesa el indicador de soporte y resistencia ? LINK ¿Está interesado en el Indicador de Tendencia Alfa ? LINK ¿Le interesa el indicador NRTR ? LINK
Introducción El indicador Trend Magic es una herramien
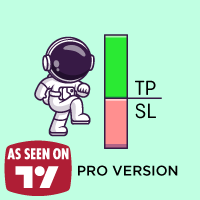
¿Estás cansado de esas viejas y aburridas líneas TP y SL que abarrotan tus gráficos? Gratis ahora, celebrando el lanzamiento de la utilidad Live Chart Viewer https://www.mql5.com/en/market/product/158488
¿Te cuesta mostrar tus operaciones de forma que llamen la atención ?
¡No te preocupes más! Te presentamos la solución definitiva que estabas esperando... ¡El Indicador TPSL Bounding Box PRO! Versión PRO (Con Ratio de Riesgo a Recompensa y Estadísticas de Aspecto más Moderno)
Con una si
FREE
FOTSI – Forex Overview True Strength Index Descubre la verdadera fuerza de cada divisa y opera con ventaja. El Indicador FOTSI es un oscilador multidivisa que mide el momentum real de cada moneda principal (USD, EUR, GBP, JPY, CHF, AUD, CAD, NZD) a través de todos sus pares. En lugar de analizar un único gráfico, el FOTSI combina la información de varios pares, suaviza el movimiento y aplica el algoritmo True Strength Index (TSI) para ofrecerte una visión clara, estable y sin retrasos de la fu
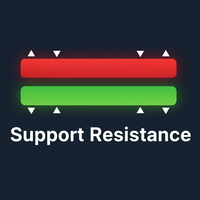
El indicador "Soporte Resistencia Dinámico" es una potente herramienta de análisis técnico para la plataforma MetaTrader 5, diseñada para identificar y trazar automáticamente zonas dinámicas de Soporte y Resistencia en los gráficos de precios. Este indicador ayuda a los operadores a reconocer fácilmente los niveles de precios importantes, los posibles puntos de reversión o las zonas de ruptura, lo que permite tomar decisiones de negociación más informadas. 2. Características principales Identifi
FREE

FVG Smart Zones – Edición Gratuita Indicador de Detección de Brechas de Valor Justo para MetaTrader 5 (MT5) ¿Buscas una herramienta de trading real, no solo otro indicador cualquiera?
FVG Smart Zones – Edición Gratuita te ofrece una visión profesional del mercado detectando automáticamente las Brechas de Valor Justo (FVG) y destacando zonas de trading de alta probabilidad directamente en tu gráfico. Diseñado para traders que siguen:
Conceptos de Dinero Inteligente (SMC)
Conceptos de T
FREE

El indicador Weis Waves RSJ suma los volúmenes de cada onda. Así obtenemos un gráfico de barras de volúmenes acumulados de ondas alternas. Es decir, el volumen acumulado hace que los gráficos de ondas Weis sean únicos. Permite comparar la relación de las características de la secuencia de ondas, como la correspondencia de la fuerza aplicada (expresada en el volumen) y el resultado recibido (el avance del precio).
Si todavía tiene preguntas, póngase en contacto conmigo por mensaje directo: https
FREE

MACD 2 Line MTF (Multi-Timeframe) Indicador para MetaTrader 5 Este indicador personalizado para MetaTrader 5 implementa un MACD clásico con dos líneas (Línea MACD y Línea de Señal) y un histograma codificado por colores , mejorado con capacidad multi-marco de tiempo . Permite a los operadores monitorizar las tendencias MACD desde marcos temporales superiores o inferiores directamente en el gráfico actual. Características principales: Línea MACD (EMA rápida menos EMA lenta) Línea de señal (SMA de
FREE

Este indicador calcula el perfil de volumen y coloca etiquetas que corresponden a los niveles VAH, VAL y POC, para cada vela individualmente.
Características de funcionamiento del indicador El indicador funciona en los marcos temporales de M3 a MN, pero utiliza los datos históricos de períodos más pequeños: M1 - para períodos de M3 a H1, M5 - para periodos de H2 a H12, M30 - para el periodo D1, H4 - para el periodo W1, D1 - para el periodo MN. El color y la ubicación de las etiquetas VAL, VAH y
FREE
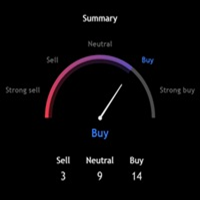
Calificaciones técnicas para MT5 Un panel de análisis multiindicador que muestra señales técnicas agregadas directamente en sus gráficos de MetaTrader 5. Este indicador calcula señales de compra, venta y neutrales a partir de 11 osciladores, 15 medias móviles y puntos de pivote clásicos, presentándolas en un único panel organizado. Qué hace Technical Ratings analiza múltiples indicadores técnicos simultáneamente y presenta su consenso como claras señales de trading. En lugar de abrir docenas de
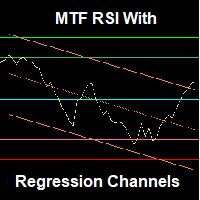
Un indicador RSI avanzado que muestra canales dinámicos de regresión lineal tanto en la ventana del indicador como en el gráfico de precios, con niveles horizontales predefinidos para detectar zonas de sobrecompra y sobreventa. Características principales (Resumen): Canales de regresión lineal sincronizados tanto en el precio como en el RSI Soporte multi-marco de tiempo Niveles horizontales inteligentes y listos para usar Diseño profesional con rendimiento optimizado Comentarios y soporte ¡Valor
FREE
El rastreador de velas de marco de tiempo superior se utiliza para obtener una visión de cómo es la vela de marco de tiempo superior seleccionada. Traza la vela después del precio actual. Puede ser útil para los traders diarios y los traders a corto plazo que a menudo se preocupan por el aspecto de la vela del marco de tiempo superior actual. Puede seleccionar el marco de tiempo superior o inferior de las opciones proporcionadas: Por defecto, el color para los osos es rojo y para los toros es ve
FREE
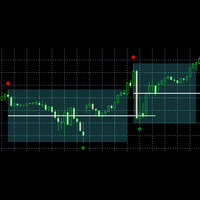
Basado en el concepto de Zonas de DTFX.
Vídeo 2
Daves sugiere utilizar una longitud de 25 para un rendimiento óptimo. Pero depende de usted para decidir sobre la base de backtest / forwardtest resultados.
Cómo este indicador dibuja zonas
En un escenario alcista, primero encontrará un swing high, luego un swing low, luego una ruptura con el precio cerrado por encima del swing high. Pero la forma en que encuentra el swing alto y bajo depende en gran medida del valor de la longitud de la estructu

Las señales de entrada de francotirador basadas en volumen y RSI para sintéticos Boom y Crash cuentan con sólidos sistemas de alerta de entrada. Para señales de filtro más avanzadas, considere el Harmonic Hybrid Pro. Cuando se negocian picos, se colocan estratégicamente tres órdenes para gestionar el riesgo, con la tercera orden colocada cerca de la mayor probabilidad de un pico. Las señales dejan de ser válidas quince minutos después de la última orden, y cualquier pérdida debe cerrarse rápidam
FREE
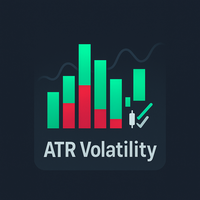
ATR Volatility Histogram para MT5 – Análisis técnico de la volatilidad Este indicador calcula y muestra la diferencia entre un ATR rápido y un ATR lento en forma de histograma, lo que permite visualizar en tiempo real los cambios en la volatilidad del mercado. Cálculo
Diferencia de volatilidad = ATR rápido - ATR lento Interpretación Valores positivos (barras verdes) indican aumento de la volatilidad y pueden confirmar el impulso de una ruptura. Valores negativos (barras rojas) indican disminuc
FREE

Versión MT5 : Este indicador representa un oscilador de momento genuino según la definición verdadera de "Momento", y como realizado por las técnicas de filtros digitales. Los artículos académicos sobre el tema por el desarrollador actual se pueden encontrar aquí y aquí , pero en esta descripción vamos a pedir prestado sólo el mínimo de marco conceptual y matemático necesario. En el proceso, exponemos algunos mitos de larga data sobre los indicadores que supuestamente miden el impulso de los pre
FREE

Una de las características buenas e importantes de MT4 es la disponibilidad del indicador iExposure. Con el indicador iExposure, los operadores pueden ver una comparación de las posiciones abiertas en curso y cuántos fondos se han utilizado y, lo que es más importante, cuál es el valor medio de estas posiciones abiertas.
Desafortunadamente este indicador no está disponible en MT5.
Este indicador es iExposure MT4 que reescribí utilizando el lenguaje de programación MT5. Este indicador se puede
FREE
If you love this indicator, please leave a positive rating and comment, it will be a source of motivation to help me create more products <3 ¿Cómo se utiliza el activador Gann High-Low? El Activador HiLo de Gann ayuda al operador a identificar la tendencia actual del mercado. Cuando el indicador está por debajo del precio de cierre, puede indicar que se está produciendo una tendencia alcista. Por el contrario, cuando el indicador está por encima del precio de cierre, puede indicar una tendencia
FREE

M & W Pattern Pro es un escáner avanzado de patrones M y W , utiliza filtros adicionales para asegurar que los patrones escaneados son rentables.
El indicador se puede utilizar con todos los símbolos y marcos de tiempo.
El indicador es un indicador sin repintado con cálculos estadísticos precisos.
Para utilizarlo , simplemente escanee el par más rentable utilizando la precisión del tablero de estadísticas , a continuación, introduzca las operaciones en la flecha de señal y salga en los niveles T

Tabajara Rules for MT5 , basado en el Setup Tabajara del profesor André Machado, indica la dirección del mercado utilizando medias móviles cuando hay velas en la misma dirección que la media móvil.
El indicador contiene la regla de color aplicada a las velas y a la media móvil.
Permite cambiar los parámetros: período y método de suavizado de la media móvil.
También permite cambiar los colores de las velas (bordes y relleno) y de la media móvil.
El modelo del profesor André Machado incluye una
FREE

INTRODUCCIÓN AL INDICADOR GPT SPIKES El indicador GPT Spikes es una revolucionaria herramienta de negociación diseñada específicamente para los mercados Boom and Crash de la plataforma Deriv. Utiliza algoritmos de última generación para proporcionar a los operadores una visión precisa del mercado, ayudándoles a detectar picos de mercado y puntos de inversión con una precisión sin precedentes. Tanto si es nuevo en el trading como si es un profesional experimentado, el indicador GPT Spikes le ofre
FREE

Zenith Session Flux es un indicador técnico de nivel profesional para MetaTrader 5 diseñado para identificar y visualizar las ventanas de negociación institucionales conocidas como ICT Killzones. El indicador automatiza el proceso de alineación temporal sincronizando la hora del servidor de su broker con la hora local de Nueva York, garantizando que los cuadros de sesión y los pivotes de precios aparezcan en los momentos institucionales precisos, independientemente de la zona horaria de su broke
FREE

El indicador KPL Swing es un sistema de comercio mecánico siguiendo la tendencia simple que automatiza la entrada y salida. El sistema funciona con una pérdida de parada dura y una pérdida de parada con seguimiento para salir con operaciones rentables. No se dan objetivos ya que nadie sabe hasta qué punto (o bajo) puede moverse el precio. Una pérdida de parada con seguimiento asegura las ganancias y elimina las emociones de la negociación. Convertido desde el indicador Amibroker con modificacion
FREE

Moving Average Trend Alert es un indicador de triple MA que ayuda a los operadores a identificar posibles tendencias de mercado basadas en la alineación y cruce de 3 MAs.
Características de la Alerta de Tendencia de Media Móvil: MAs personalizables a corto, medio y largo plazo. Opción de filtrar señales basadas en una distancia mínima entre medias móviles para evitar una alineación prematura de MAs. Filtro opcional de señales con niveles de sobrecompra/sobreventa del indicador RSI. Filtro opcio
FREE

La idea de un indicador Value Chart se presentó en un libro muy bueno que leí allá por 2020 , "Dynamic Trading Indicators: Winning with Value Charts and Price Action Profile ", de los autores Mark Helweg y David Stendahl. La idea es simple y el resultado es pura genialidad: Presentar el análisis de precios de velas de una manera sin tendencia.
CÓMO LEER ESTE INDICADOR
Busque los niveles de sobrecompra y sobreventa. Por supuesto, tendrá que probar los ajustes mucho para encontrar el "correcto" p
FREE

Utilice este indicador para recibir alertas sobre las tendencias que se desarrollan en el mercado.
Con este indicador, podrá recibir alertas sobre las tendencias que se están desarrollando en el mercado a medida que se desarrollan. Este indicador se puede utilizar para identificar entradas o salidas dentro de una tendencia. El indicador combina información de marcos de tiempo más altos, con movimientos de precios del marco de tiempo actual para generar una señal de compra o venta. El indicador
FREE

Mejores separadores de periodos para MetaTrader 5 La función incorporada de separadores de período no permite a los usuarios especificar el período de tiempo, por lo que puede utilizar este indicador para crear separadores de período más personalizables. En los gráficos intradía, puede colocar separadores de período en un momento específico, también puede colocar separadores de período adicionales en un momento específico el lunes para marcar el inicio de una semana. En gráficos de plazos superi
FREE

Swing Point Volume, el indicador que señala debilidad y fuerza en los máximos y mínimos. Este indicador se puede utilizar para el método Wyckoff.
Información proporcionada; - Swing en ticks personalizados. - Volumen y puntos en cada balance. - Porcentaje de Desplazamiento. - Opción de alerta sonora en rupturas superiores e inferiores. - Volumen en ticks y Volumen Real. - Volumen HL (extremo) o (apertura y cierre). - Formas de volumen personalizadas.

MQL4 también se ha convertido a MQL5 información de exposición para los amigos que utilizan iexposure. Muestra el número total de posiciones que se han abierto, cuántas posiciones de compra o venta hay, la cantidad neta de números de posición y sus precios de orden, el estado de ganancias y pérdidas de todas las posiciones totales. Yo no escribí su código, es de código abierto, ¡pero quería compartirlo con todos porque es un indicador que me gusta!
https://www.mql5.com/en/charts/14801856/usdjpy
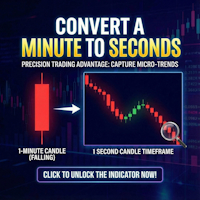
Second Timeframe Pro - ¡Vea el mercado antes que nadie!
Desbloquee un nivel oculto de la acción del precio
Mientras otros operadores miran velas por minuto, ¡usted puede ver 60 velas dentro de cada minuto!
¿Qué es Second Timeframe Pro?
Es un indicador revolucionario que crea gráficos de velas completos con segundos marcos de tiempo directamente en MetaTrader 5.
MT5 estándar le limita a un gráfico de minutos. Pero el mercado no se detiene cada minuto - pulsa cada segundo. Second Timeframe P

Identifique el patrón de vela envolvente con flechas y alerta ( filtro RSI incorporado ). Este indicador le ayuda a identificar el patrón de vela envolvente o barra exterior (OB) en el gráfico con flechas, junto con una alerta cuando aparece una nueva vela envolvente. El patrón de vela envolvente es una de las señales más importantes de reversión de Price Action. Puede elegir entre Engulfing estándar (Engulfing basado en el cuerpo de la vela) o Engulfing no estándar (Engulfing basado en el máxi

¡¡¡3 indicadores de velas en 1 !!! Los 3 más importantes indicadores candel en 1 packadge. Ayuda al trader en la visualización de gráficos, ¡¡¡previene la reversión!!! Doji : Doji Lápida, Doji Pierna Larga, Doji Libélula. Engulfing : Alcista, Bajista. Martillo : martillo rojo, martillo verde. Totalmente parametrable icono del indicador de configuración de color y alarma. ¡¡¡Actualización gratuita de por vida !!! Pruebe nuestra demo gratis.

Fractales Consecutivos Ajustables busca 2 o más fractales en una dirección y envía una alerta en pantalla, una alerta sonora y una notificación push, para puntos de inversión fuertes.
Fractales Consecutivos Ajustables, muestra los fractales en el gráfico junto con un texto que cambia de color para señales de compra y venta cuando uno o más fractales aparecen en un lado del precio.
Fractales Consecutivos Ajustables se basa en los Fractales de Bill Williams. El estándar Bill Williams fractales se

EL INDICADOR DE ENTRADA PERFECTA
¡Entra en operaciones como un profesional con el indicador de entrada perfecto!
No más conjeturas. Sólo Precisión. Doble-ZigZag + Confirmación Fractal = Sólo las Configuraciones de Compra y Venta más Fuertes.
¿Está cansado de señales falsas, entradas tardías y confusión interminable en los gráficos? El Indicador de Entrada Perfecta fue construido para dar a los operadores puntos de entrada cristalinos sin vacilación.
BONO ESPECIAL (VÁLIDO HASTA JUNIO 2026

Reconocimiento ultrarrápido de canales parabólicos (así como canales lineales, horizontales y ondulados) en toda la profundidad de la historia, creando una jerarquía de canales. Ajuste necesario: Máximo de barras en el gráfico: Ilimitado Este indicador está diseñado principalmente para la negociación algorítmica, pero también puede utilizarse para la negociación manual. Este indicador tendrá una evolución muy activa en un futuro próximo y descripciones detalladas sobre cómo aplicar para crear r

¿Le gusta, como a mí, operar con la tendencia? Entonces este indicador le ayudará. Rainbow Trend es un indicador de tendencia, que utiliza varias Medias Móviles en el gráfico.
Mide diferentes zonas de fuerza de tendencia para diferentes periodos: muy largo plazo, largo plazo, medio plazo, corto plazo y muy corto plazo.
Cada zona tiene su color, y es posible tener alerta sonora cuando los precios salen de una zona y entran en otra.
Su configuración es muy sencilla. Si encuentras algún bug o tiene

Incluye casi todos los conceptos relacionados con el Perfil de Volumen: POC , Área de Valor , POC en Desarrollo , VWAP Anclado , Delta de Volumen ; desde el "Total" en su nombre. Es rápido en sus cálculos y sencillo de trabajar.
Características:
1. Plazo de cálculo seleccionable para encontrar los niveles más negociados.
2. Capaz de calcular el Perfil de Volumen basado en datos de ticks
3. Barras de histograma ajustables por su conteo.
4. Barras de histograma ajustables por su altura (rang
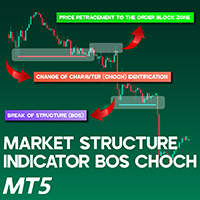
Indicador de Estructura de Mercado BOS CHOCH MT5 El Indicador de Estructura de Mercado (BOS-CHOCH) es una herramienta de estilo ICT construida para MetaTrader 5 (MT5). Identifica tanto eventos primarios como secundarios de Cambio de Carácter (CHOCH) y Rupturas de Estructura (BOS) a través de múltiples niveles, haciéndolo altamente valioso para los operadores ICT y Smart Money. Al simplificar el análisis del comportamiento de los precios, este indicador mejora la interpretación de la estructura d
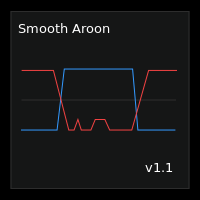
Smooth Aroon es una versión del Aroon Up and Down con suavizado y filtrado.
Características :
Suavizado : Dispone de suavizado de 0 a 99 . Para suavizar una señal, busque el valor máximo de los puntos en cuestión y, a continuación, establezca el nivel de suavizado por encima del valor máximo. Por ejemplo: si desea suavizar todas las señales por debajo de 30, debe ajustar el nivel de suavizado por encima de 30. Esto también suaviza todas las señales por encima de 70, ya que el Aroon Up and Down

El indicador GGP SuperTrend MT5 es una herramienta de análisis técnico que puede ayudar a los inversores a identificar las tendencias del mercado. El indicador se basa en el ATR y es muy útil para captar la dirección del impulso de un activo y se emplea ampliamente cuando se analizan acciones, divisas y materias primas. Traza una línea en el gráfico de precios, que actúa como un nivel dinámico de soporte o resistencia, ayudando a los operadores e inversores a tomar decisiones informadas sobre l

TREND HARMONY MT5 - Indicador Multi Timeframe Trend and Phase and Pullback Level Visualizer para Metatrader5 El indicador TREND HARMONY automatiza el análisis profundo de tendencias y genera visualizaciones para usted. ¡Tome el control de sus operaciones eliminando la incertidumbre! Revolucione su experiencia de trading con precisión y conocimiento a través del indicador TREND HARMONY Multi Timeframe - su indicador de visualización de tendencias MT5 definitivo. [ Características y Manual | Versi

Smart Drawing Assist PRO MT5. Aparecerán botones junto al objeto seleccionado. Los botones son sencillos y sorprendentemente fáciles de usar. Las características son las siguientes: Dibujar zigzag . Le permite dibujar patrones, dibujar en zigzag y dibujar formas. Todo lo que tienes que hacer es pulsar el botón y empezar a hacer clic punto a punto y se dibujará automáticamente. Cambia el color del objeto . Rectángulo/Línea de tendencia/Línea V/Línea de texto/Flecha de precio/Línea en línea/ y su

Necessary for traders: tools and indicators Waves automatically calculate indicators, channel trend trading Perfect trend-wave automatic calculation channel calculation , MT4 Perfect trend-wave automatic calculation channel calculation , MT5 Local Trading copying Easy And Fast Copy , MT4 Easy And Fast Copy , MT5 Local Trading copying For DEMO Easy And Fast Copy , MT4 DEMO Easy And Fast Copy , MT5 DEMO MACD se denomina media móvil de similitud y diferencia, que se desarrolla a partir de la media
FREE

Royal Wave es un oscilador Trend-Power que ha sido programado para localizar y señalar zonas de entrada y salida de bajo riesgo. Su algoritmo central analiza estadísticamente el mercado y genera señales de trading para zonas de sobrecompra, sobreventa y baja volatilidad. Mediante el uso de un sistema de alertas bien diseñado, este indicador facilita la toma de decisiones adecuadas con respecto a dónde entrar y dónde salir de las operaciones. Características Algoritmo Trend-Power Zonas de Entrada

RSI de dos periodos + Alertas compara las líneas RSI a largo y corto plazo, y traza un relleno entre ellas para una mejor visualización. El relleno se colorea de forma diferente según se trate de una tendencia alcista (RSI a corto plazo por encima del RSI a largo plazo) o bajista (RSI a corto plazo por debajo del RSI a largo plazo). El cruce del RSI de corto plazo con el RSI de largo plazo añade una señal de confirmación de tendencia más sólida que el uso del RSI de un solo periodo. Esta es una

KT Risk Reward muestra la relación riesgo-recompensa comparando la distancia entre el nivel de stop-loss/take-profit y el nivel de entrada. La relación riesgo-recompensa, también conocida como relación R/R, es una medida que compara el beneficio potencial de la operación con la pérdida y se representa como una relación. Evalúa la recompensa (take-profit) de una operación comparando el riesgo (stop loss) que conlleva. La relación entre los valores de riesgo-recompensa arroja otro valor que determ

Descripción El indicador utiliza la teoría del perfil de mercado para mostrar diariamente las zonas de negociación más relevantes. Las zonas que se muestran son LVN (nodos de bajo volumen) y POC (punto de control). Una zona LVN es aquella que representa las áreas de precios con menos tiempo o volumen a lo largo del día. Normalmente, estas zonas indican una iniciativa de oferta o demanda y, en el futuro, pueden convertirse en importantes zonas de ruptura o retroceso. Una zona POC es aquella que r
Categoría: Indicador Oscilador
Plataforma: MetaTrader 5
Tipo: Indicador de Entrada
Timeframes: Todos
Estilos de Trader: Scalping, Day Trading, Swing Trading, Opciones Binarias
Mercados: Todos Descripción El Oscilador Bipolar es una herramienta analítica basada en cálculos de desviación y un filtro de suavizado bipolar. Está diseñado para resaltar las condiciones de impulso y las posibles señales de trading, al tiempo que filtra el ruido a corto plazo. Características principales: Filtrado bipola

Auto Order Block con ruptura de estructura basada en ICT y Smart Money Concepts (SMC)
Futuros Ruptura de estructura ( BoS )
Bloque de órdenes ( OB )
Bloque de Orden de marco de tiempo superior / Punto de Interés ( POI ) mostrado en el gráfico actual
Fair value Gap ( FVG ) / Desequilibrio - MTF ( Multi Time Frame )
HH/LL/HL/LH - MTF ( Multi Time Frame )
Choch MTF ( Multi Time Frame )
Desequilibrio de Volumen , MTF vIMB
Brecha Potencia de 3
Igual High / Low 's , MTF EQH / EQL
Liquide z
Má
OmniSignal Navigator – Scalping inteligente en niveles clave Opere como un profesional con este indicador diario/semanal de Máximo-Mínimo-Cierre, diseñado para scalping y trading de rupturas de precisión.
Por qué funciona Perfecto para scalping: Se enfoca en zonas clave (PDH/PDL/PDC y PWH/PWL/PWC) en marcos temporales M2, M3, M5 y M15. (Marcos temporales más bajos = más señales, marcos temporales más altos = menos señales) No necesita análisis de gráficos: Simplemente espere las noti
FREE

Acerca de:
La Envolvente de Nadaraya-Watson es un indicador técnico sofisticado pero práctico que ayuda a los operadores a identificar condiciones de sobrecompra y sobreventa utilizando métodos avanzados de regresión kernel. Esta es la versión para MT5.
Para la versión MT4 ir aquí: https://www.mql5.com/en/market/product/158640/
Características principales Bandas basadas en ATR: Tres bandas superiores y tres inferiores proporcionan zonas graduadas de sobrecompra/sobreventa Cálculo de escala l
FREE

Si ha oído hablar del Método Wyckoff, Análisis de Volumen, etc... Probablemente esté buscando el indicador de velas que le muestre el Volumen extendido por toda la barra actual, señalando cada tipo de estado del mercado... Puede controlar los distintos niveles de mercado con colores personalizados...
Usted decide cómo utilizarlo. Nuestro trabajo es proporcionarle el indicador...
Si te gusta este indicador, todo lo que estoy pidiendo es un poco de revisión (no un comentario, pero una revisión!
FREE
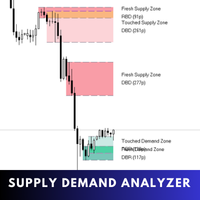
Supply Demand Analyzer es un indicador avanzado de negociación meticulosamente diseñado para la identificación, el análisis y la gestión precisos de las zonas de oferta y demanda. Mediante la integración de datos en tiempo real y algoritmos avanzados, esta herramienta permite a los operadores reconocer las fases del mercado, los movimientos de los precios y los patrones estructurales con una precisión sin precedentes. Simplifica la compleja dinámica del mercado y la convierte en información prác

Paquete Breakout 4 en 1 Funciones básicas El indicador funciona como un "Motor de Confirmación de Tendencia". Identifica cuando el precio rompe a través de un nivel estructural clave y luego utiliza osciladores secundarios para verificar si el movimiento tiene suficiente fuerza para continuar. 1. El motor de ruptura (S&R) La base del indicador es identificar el Soporte y la Resistencia (S&R) . Cuando el precio cierra por encima de la resistencia o por debajo del soporte, el indicador activa una
FREE
VWMA Signal Pro – Panel Multitemporal de Tendencia Ponderada por Volumen VWMA Signal Pro es un indicador analítico que combina la media móvil ponderada por volumen (VWMA) con filtros de confirmación de tendencia y un panel multitemporal compacto.
Ayuda a identificar la dirección de la tendencia y la fuerza del impulso utilizando acción del precio ponderada por volumen y confirmación de volatilidad. Calcula los valores de VWMA en varios marcos temporales y muestra señales de compra/venta confirm

Versión MT4 | FAQ El Indicador Owl Smart Levels es un sistema comercial completo dentro de un indicador que incluye herramientas de análisis de mercado tan populares como los fractales avanzados de Bill Williams , Valable ZigZag que construye la estructura de onda correcta del mercado y los niveles de Fibonacci que marcan los niveles exactos de entrada. en el mercado y lugares para tomar ganancias. Descripción detallada de la estrategia Instrucciones para trabajar con el indicador Asesor de c

Este indicador destaca visualmente las sesiones asiáticas, londinenses y neoyorquinas en su gráfico mediante rectángulos de colores. Calcula y muestra automáticamente el máximo, el mínimo y el rango de precios (en pips) de cada sesión para el día más reciente. Los rangos de la sesión se dibujan durante un periodo de tiempo configurable, lo que le permite revisar la acción del precio de la sesión durante varios días anteriores. Las principales características son: Horas de inicio y fin de sesión
FREE

Indicador Weis Wave Volume para MetaTrader 5 (MT5) Consulte todos nuestros productos aquí: Todos los productos Especificaciones Plataforma: MetaTrader 5 (MT5)
Tipo de indicador Indicador técnico personalizado
Nivel: Intermedio Intermedio
Plazos: Todos los plazos (Soporte Multi-Tiempo)
Estilos de negociación: Scalping, Day Trading, Swing Trading, Position Trading
Mercados: Divisas, Acciones, Materias Primas, Índices y Criptomonedas ¿Qué hace este indicador? El Indicador Weis Wave Volum
Indicador de compra/venta de alta precisión diseñado para FlipX Markets en Weltrade y pares de volatilidad en Deriv. FlipToxin fue codificado específicamente para el gráfico de 5 minutos (M5), pero también funciona en marcos de tiempo más altos con precaución. En Boom, Crash, PainX y GainX, se sugiere el gráfico de 15 minutos, especialmente en mercados con tendencia. Scalping Mindset Reminder
Este indicador está diseñado para entradas y salidas rápidas y precisas - perfecto para los operadores
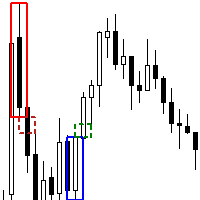
El indicador Order Block FVG Box para MetaTrader 5 es una poderosa herramienta diseñada para los operadores exigentes que buscan identificar y capitalizar las oportunidades comerciales de alta probabilidad. Este indicador destaca en la identificación de Bloques de Órdenes válidos que son seguidos inmediatamente por Fair Value Gaps (FVG), mejorando su estrategia de negociación con señales visuales precisas. Características principales: Identificación de bloques de órdenes : Detecta Bloques de Órd
FREE
El Mercado MetaTrader es la única tienda donde se puede descargar la versión demo de un robot comercial y ponerla a prueba, e incluso optimizarla según los datos históricos.
Lea la descripción y los comentarios de los compradores sobre el producto que le interese, descárguelo directamente al terminal y compruebe cómo testar el robot comercial antes de la compra. Sólo con nosotros podrá hacerse una idea sobre el programa, sin pagar por ello.
Está perdiendo oportunidades comerciales:
- Aplicaciones de trading gratuitas
- 8 000+ señales para copiar
- Noticias económicas para analizar los mercados financieros
Registro
Entrada
Si no tiene cuenta de usuario, regístrese
Para iniciar sesión y usar el sitio web MQL5.com es necesario permitir el uso de Сookies.
Por favor, active este ajuste en su navegador, de lo contrario, no podrá iniciar sesión.